0103 - 5053 $6.00+0.00
Article
*e-mail: [email protected]
Isotropic and Anisotropic NMR Chemical Shifts in Liquid Water: A Sequential
QM/MM Study
Eudes E. Fileti,*, a Herbert C. Georg,b Kaline Coutinhob and Sylvio Canutob
a
Instituto de Química, Universidade de São Paulo, CP 26077, 05513-970 São Paulo-SP, Brazil
b
Instituto de Física, Universidade de São Paulo, CP 66318, 05315-970 São Paulo-SP, Brazil
Apresentamos um estudo QM/MM seqüencial dos deslocamentos químicos gás-líquido da água. Cálculos de química quântica extensivos, usando a teoria do funcional da densidade foram realizados para estruturas do líquido de água, geradas através de simulações de Monte Carlo e Dinâmica Molecular. A dependência do deslocamento químico com os potenciais empíricos utilizados nas simulações, com o tamanho do aglomerado e com o funcional escolhido para os cálculos quânticos foi analisada. Os resultados corrigidos devido ao erro de superposição de base estão em boa concordância com os resultados experimentais, mostrando que um potencial empírico simples associado a um funcional apropriado é capaz de descrever os deslocamentos químicos. Todos os resultados apresentados são estatisticamente convergidos.
We present a sequential QM/MM study of the gas-liquid chemical shifts of water. Extensive quantum chemical calculations using density functional theory have been performed for structures of liquid water generated by Monte Carlo and Molecular Dynamic simulations. The dependence of the chemical shifts on the empirical potential used in the simulations, on the cluster size and on the functional chosen for the quantum chemical calculations were analyzed. The results after correcting for basis set superposition errors are in good agreement with the experimental data, showing that a simple empirical potential associated to an appropriate functional is able to describe the chemical shifts. All results presented here are statistically converged.
Keywords: sequential QM/MM, water, NMR, chemical shift, DFT
Introduction
Calculations of the chemical shielding can reproduce with accuracy the chemical environment of the nuclei in a molecule. The advances in computational resources and the improvement in the theoretical methods provide important refinements to estimate the chemical shielding, such as inclusion of the electron correlation effects and the possibility of studying systems that are more complex than isolated molecules or small clusters. Presently the determination of the chemical shifts for nuclei in proteins, solids and liquids through current methodologies1-5 are very convincing.
An important category of systems whose electronic structure can be investigated through NMR calculations are solvated systems. A solvated molecule experiences the effect of the interaction with its vicinity, such as in hydrogen bonds.6,7 Several theoretical models were proposed to
describe the solvent effects on chemical shielding.8-14 The
main branches are the self-consistent reaction field methods (SCRF)15,16 where the solute is placed inside a hollow cavity
in a polarizable medium represented by its dielectric constant. In some cases, explicit solvent molecules, forming minimum energy clusters are considered in order to mimic the solvation shells of the solute.10,17 It was shown that the
former method does not work in determining the chemical shift and the latter, though it can serve as a rough approximation, does not serve as a model to the liquid phase18 since the system is fixed at the equilibrium
geometry, and consequently not describing the thermal disorder that characterizes a liquid system.
Chesnut and Rusiloski18 have proposed a more realistic
the expected value, although they have shown a better qualitative agreement compared with the results obtained with SCRF and rigid cluster approximation. Two years after that work, Malkin et al.13 showed in a study about the isotropic
chemical shift, that improving the description of the solvation shells and the sampling of the configurations submitted to quantum calculations, they could find better values for the gas-liquid chemical shift. In fact such results are in better agreement with the expected values than the results of the Chesnut and Rusiloski.18
The SCRF, rigid cluster approximation and Malkin sampling methods were compared by Chesnut and Rusiloski.18
The authors verified that the continuum method fails even at reproducing the sign of the isotropic chemical shift and that the discrete approximation is more reliable. They also verified that the rigid cluster approximation, in the case of (H2O)5 provided results close to that obtained from the average over the structures from simulations. However the best agreement between the experimental and theoretical values was given by the Malkin sampling method,13 that represented the chemical
shift as a distribution of values around an average obtained from quantum calculations and not as an absolute value obtained by a single calculation. Nevertheless none of these works made use of a rigorous statistical treatment to obtain converged averages. Recent results20-24 showed that statistically
converged results can be ensured by considering the auto-correlation functions of the energy in sampling the configurations from the liquid simulation.20-24
In this work we revisit the chemical shift of liquid water using a sequential QM/MM methodology21,23,24 and analyze
how different functionals describe the chemical shielding in both gas and liquid phase. Other aspects will be considered, such as the dependence with the potential used in the simulations, the effects of molecular vibrations, the dependence with the selected clusters size. Additionally, we will also analyze the results obtained for the anisotropic chemical shielding in the liquid phase, for which theoretical results are scarce. An important fact is that our results can be compared to the recently proposed absolute scale for chemical shielding of the oxygen atom25 as well as the new
experimental values determined for the hydrogen atom.26
Theoretical details
Absolute chemical shielding and chemical shift
The absolute chemical shielding is an orientation-dependent property. It depends on the orientation of the molecule in relation to the applied magnetic field. Thus the chemical shielding can be described by a second rank non-symmetric cartesian tensor, σ, in which nine distinct
components specify the orientation of the shielding in relation to the coordinate system. Thus we have:27
(1)
In conventional NMR experiments, it is very difficult to determine all the components of the chemical shielding, thus only the symmetric part of the shielding is determined. Then it is defined the isotropic chemical shielding, σiso, given by the trace of the tensor,
i.e.27,28
(2)
In many cases, it is enough to analyze this property to compare with the experimental results, however important information is missed. Thus we use the anisotropic chemical shielding σanis expressed by27,28
(3)
The isotropic and anisotropic gas-liquid chemical shifts of the X atom are determined by
(4)
and
(5)
In experimental NMR spectra, a standard system is chosen as a reference, thus the chemical shift is taken as the difference between the shielding of the atom of interest and the corresponding atom in the reference system. In theoretical calculations, the magnetic shielding must then be subtracted from the shielding in the reference system (both obtained at the same level). In the differences given by the expressions (4) and (5), the reference values cancel out, therefore the chemical shifts here are referred simply as the difference between the shielding of the atom in the liquid phase and the shielding of the atom in the gas phase.
Simulations and statistical analysis
describe the inter- and intramolecular interactions. We used two rigid potentials, SPC29 e TIPS,30 and two flexible
potentials: the Ferguson potential31 (FERG) that is based
on SPC potential and the Dang-Pettitt32 potential (DP),
which is based on the TIPS potential. The general potential form is given by,
(6)
where the first sum is the traditional Lennard-Jones plus Coulomb potential that describes the intermolecular interactions. The two other summations are the intramolecular part of the potential that describes the stretching of the O-H bond represented by l (the FERG
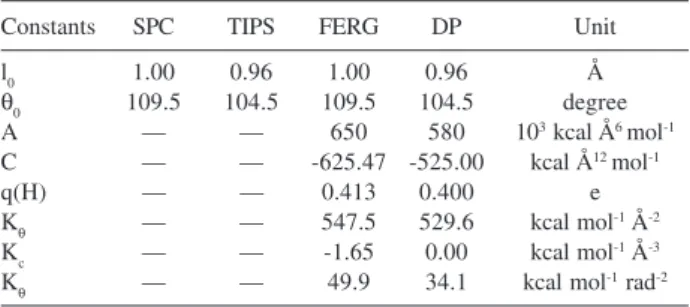
potential has a cubic contribution to the stretching) and the HOH angle deformation represented by θ. The values of these parameters are given in Table 1.
The simulations with rigid water molecules were performed by the Monte Carlo Metropolis method as implemented in the program DICE.33 The production
simulations were carried out for 5×10⁷ steps at a temperature
of 298 K, in the NVT ensemble with 500 water molecules. In the case of flexible molecules we used the Molecular Dynamics method with the GROMACS program.34,35 For
both the gas phase and the liquid phase we performed simulations of 1 ns with a time step of 0.25 fs in a temperature of 298 K. The MD simulations were performed in the NVT ensemble with 500 water molecules.
Since the configurations obtained from the Monte Carlo simulations obey the Boltzmann statistics, the average of the magnetic shielding or any other property is given through a simple averaging over the number of configurations used, N, that is:
(7)
It is known that non-correlated values of si yield a normal distribution with standard deviation, s, given by
(see reference 21 and references therein),
(8)
and a statistical error, Δ, given simply by,
(9)
One notices that, for large N, the standard deviation
converges to a constant value whereas the statistical error tends to zero. In this way the final value of the shielding will be represented by the distribution 〈σ〉 ±
s that describes the Gaussian distribution and comprises
68% of the values.
Using the auto-correlation function of the energy,21
the structures selected for subsequent quantum calculations were taken with an interval of 5×10⁴ MC
steps and 10 ps in MD simulations. This procedure provides configurations with less than 15% of statistical correlation between each other in both cases.
Quantum mechanical calculations
Density functional theory (DFT) has been successfully applied to several problems in quantum chemistry, and also in the determination of the chemical shifts.2-5,13,14 We used it in this work to describe the
isotropic and anisotropic chemical shifts in liquid water. As a first approach, we have employed the hybrid functional B3LYP36,37 with the purpose of studying the
convergence with the number of water molecules used (cluster size). The large 6-311++G(2d,2p) basis set was used to calculate the shielding of the reference molecule. It is accepted that the 6-311++G(d,p) basis set is enough to provide results in considerably good agreement with the experimental results.19,38 To evaluate
the cluster size effect on the magnetic shielding, we used the 6-311++G(2d,2p) basis set for the first solvation shell (1 + 4 molecules) while for the molecules beyond this we used the 3-21G basis set. To observe the dependence of the chemical shifts with the functional employed, we also used other functionals as discussed later. The GIAO method38-40 was chosen to
treat the gauge invariance problem. All quantum calculations were performed with the Gaussian 03 program.41
Table 1. Parameters of the potentials used in the simulations
Constants SPC TIPS FERG DP Unit
l0 1.00 0.96 1.00 0.96 Å
θ0 109.5 104.5 109.5 104.5 degree
A — — 650 580 103 kcal Å6 mol-1
C — — -625.47 -525.00 kcal Å12 mol-1
q(H) — — 0.413 0.400 e
Kθ — — 547.5 529.6 kcal mol-1 Å-2
Kc — — -1.65 0.00 kcal mol-1 Å-3
Results and Discussion
Absolute magnetic shielding of the gas-phase
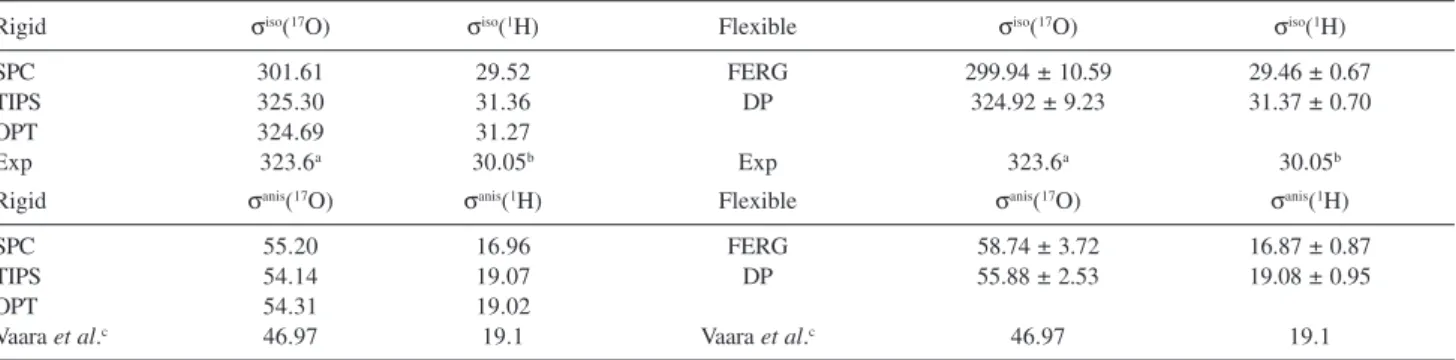
Before discussing the results obtained for the chemical shifts it is necessary to discuss the absolute magnetic shieldings obtained for the isolated (rigid and flexible) molecule. Table 2 shows the values of the isotropic and anisotropic shieldings for the atoms of the isolated water molecule, in rigid geometry and for the 100 geometries generated by the flexible potential models in gas phase, obtained in the MD simulations. In addition, we carried out calculations on B3LYP/6-311++G(2d,2p) optimized geometry (designated in Table 2 by OPT) as a reference to the geometries obtained by the simulations.
All values obtained for the rigid SPC geometry, as well as the configurations produced by FERG potential (based on SPC geometry) are in poor agreement with the experimental value. The oxygen atom, for instance, presented a difference in the isotropic shielding of ~24 ppm from its experimental value of 323.6 ppm.25 For the
anisotropic shielding a large discrepancy occurred for the hydrogen atoms for which the SPC and FERG potentials provided a difference of ~2 ppm. These differences are due to the fact that the SPC geometry is very different from that found experimentally (see Table 1). On the other hand, the TIPS potential (based on experimental geometry) as well as the DP potential (based on the TIPS geometry) yielded satisfactory values for the magnetic shielding of the atoms in both the fixed and flexible (vibrating) molecules. In the case of the oxygen atom of the TIPS molecule the deviation from the experimental result was ~0.5%. For hydrogen atoms, obtaining accurate values for the isotropic shielding is computationally expensive. A value of 30.9 ppm was obtained in the CCSD(T) level.42
However the best theoretical estimative for this value, 30.2 ppm, was achieved using an elaborate RASSCF model.43
Our values naturally are not so accurate, presenting a deviation of ~4% from the experimental value, but are in good agreement with other theoretical values from the recent literature in which a MP2/6-311++G(2d,2p) calculation has found 31.02 ppm.44
There is no experimental result for the anisotropic shielding in gas-phase, hence Table 2 presents some reference theoretical results. Taking those values, we observe that our results for the SPC and FERG models are not in a good agreement. For the FERG potential we obtained 16.87 ± 0.87 ppm for σanis(1H) while the
reference value is 19.1 ± 0.1 ppm.43 The TIPS and DP
models, in turn, showed better agreement; 19.07 ppm (TIPS) and 19.08 ± 0.95 ppm (DP). In the case of the oxygen atom, σanis(17O) was calculated at the RASSCF
level as being 46.97 ppm43 and at the
MP2/6-311++G(2d,2p) level as being 46.05 ppm.44 However the
value obtained here of 55.88 ± 2.53 ppm, suggests that the electron correlation effects must be important to characterize this property. The difference between the values for rigid and flexible molecules reveals the importance of considering the intramolecular vibrations. Such vibrations lead to fluctuations resulting in a distribution of values. Finally we observe that the values presented in Table 2 using the TIPS geometry are very similar to that values obtained for the optimized isolated molecule, indicating the similarity between the two geometries.
Absolute chemical shielding of the liquid-phase
For a more appropriate description of the liquid many aspects must be considered. First of all, the liquid is characterized by a distribution of possible structures at a certain temperature and cannot be compared to the gas phase.45 Secondly, it is important to consider the solvent
molecules explicitly since important intermolecular
Table 2. Isotropic, σiso, and anisotropic, σanis, absolute magnetic shielding for the water atoms in rigid and flexible geometry. Values in ppm obtained at B3LYP/6-311++G(2d,2p) level. OPT stands for the values obtained for the B3LYP/6-311++G(2d,2p) optimized geometry. Uncertainties are the standard deviations of the averages obtained with 100 configurations
Rigid σiso(17O) σiso(1H) Flexible σiso(17O) σiso(1H)
SPC 301.61 29.52 FERG 299.94 ± 10.59 29.46 ± 0.67
TIPS 325.30 31.36 DP 324.92 ± 9.23 31.37 ± 0.70
OPT 324.69 31.27
Exp 323.6a 30.05b Exp 323.6a 30.05b
Rigid σanis(17O) σanis(1H) Flexible σanis(17O) σanis(1H)
SPC 55.20 16.96 FERG 58.74 ± 3.72 16.87 ± 0.87
TIPS 54.14 19.07 DP 55.88 ± 2.53 19.08 ± 0.95
OPT 54.31 19.02
Vaara et al.c 46.97 19.1 Vaara et al.c 46.97 19.1
interactions such as hydrogen bonds must be well described. Therefore, we consider the first hydration shell composed of five molecules (1 solute + 4 solvent).46
The magnetic shieldings for the reference water molecule, calculated at the B3LYP/6-311++G(2d,2p) level are shown in Table 3. σ(1H) is given as the average over
the two hydrogen atoms since they are equivalent as can be seen from Figure 1. One observes that the standard deviations of the shieldings for the flexible potentials are larger than the deviations for the corresponding rigid potential due to inclusion of vibration contribution. The rigid potentials presented values systematically larger than the values presented by the corresponding flexible potential. For instance, the chemical shielding for the TIPS oxygen atom is 297.36 ± 7.75 ppm while for the DP oxygen atom is 288.66 ± 10.98 ppm. The difference of ~9 ppm between the average shieldings can be attributed to vibration effects. Figure 2 presents the statistical convergence for the calculated average shieldings of the FERG and DP configurations. One can also see that the averages converge with approximately 50 configurations. It is also important to notice in Table 3 that the isotropic shielding suffers a larger effect due to the choice of potential than the anisotropic shielding. The sensitivity of the shieldings with the potential is more evident in Figure 2.
Having presented the results for the chemical shielding, we now discuss the gas-liquid chemical shifts. Two aspects not discussed so far will be taken into account in the next sections. The first is the convergence of the shielding with the cluster size. It is argued that the first solvation shell alone is not enough to reproduce the experimental results18
and that, in order to have a good description of the magnetic shielding in the liquid phase, it is necessary more than four molecules in the first solvation shell.13 The second aspect
to be considered is the basis set superposition error (BSSE). Since our study involves supermolecular quantum mechanics calculations, the BSSE correction is essential for the reliability of the results. Thus we used the counterpoise correction (CC),47 calculating the chemical
shift using the reference magnetic shielding calculated in the presence of the basis functions of the solvent molecules. In the next analysis, we will consider the results obtained using the liquid structures generated by the DP potential since this potential described better the magnetic shielding for both liquid and gas phases.
Table 3. Isotropic, σiso, and anisotropic, σanis, absolute magnetic shield-ing for the reference water molecule in the presence of the first solvation shell. Values in ppm obtained at the B3LYP/6-311++G(2d,2p) level. Un-certainties are the standard deviations of the averages obtained over 100 configurations
σiso(17O) σiso(1H)
SPC 275.09 ± 7.11 26.45 ± 1.01
TIPS 297.36 ± 7.75 29.01 ± 0.96
FERG 261.46 ± 10.95 25.59 ± 1.23
DP 288.66 ± 10.98 28.26 ± 1.33
Exp 287.5a 25.71b
σanis(17O) σanis(1H)
SPC 51.24 ± 10.79 25.78 ± 3.60
TIPS 49.09 ± 10.01 25.19 ± 3.71
FERG 46.55 ± 12.97 25.11 ± 3.77
DP 48.15 ± 12.49 25.35 ± 3.49
Exp — 27.4b
aReference 25; breference 26.
Figure 2. Convergence of average isotropic, σiso (ppm) and anisotropic,
σanis (ppm) shielding for the atoms of the reference molecule in first sol-vation shell of liquid water. Solid circles stand for the averages obtained with DP potential and white balls with FERG potential. The vertical bars represent the statistical errors.
Locally dense basis set
For the solvent water molecules we used the expedient employed by Chesnut and co-workers,48-50 in
which the reference water molecule is treated by a relatively large basis set and a smaller basis set is employed in the other atoms of the system. This procedure, that drastically reduced the computational effort, provides good results when compared with the conventional approximation of balanced basis. In another study, on the first coordination shell of the geometrical structure of the ice, (H2O)17,51 two basis
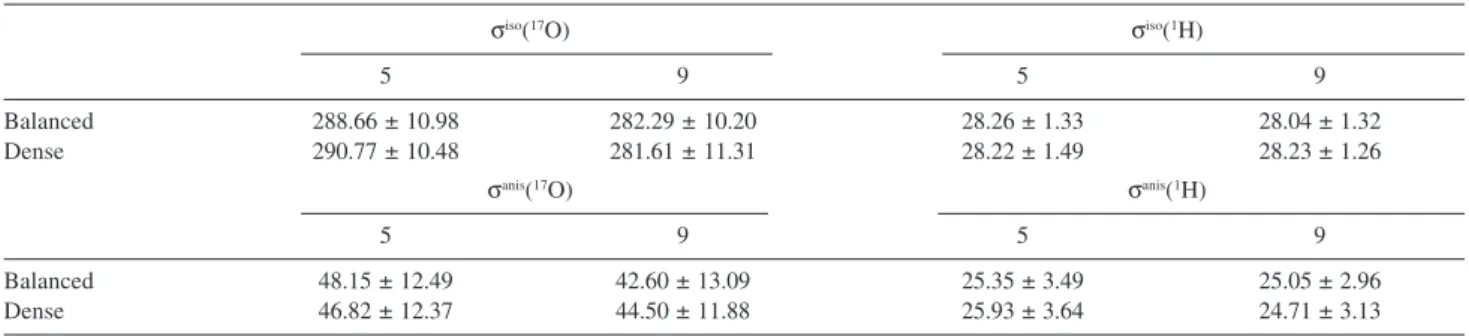
sets were employed: the 6-311G(d,p) for the whole cluster; and the locally dense 6-311G(d,p) basis set (describing the central molecule) combined with the 4-31G basis set (describing its neighbors). The results they found were essentially the same suggesting the use of this approximation. Here we carried out a test to have insights on the magnitude of the effects on the structures obtained from the simulations. Table 4 presents the values of the isotropic and anisotropic shieldings for two different cluster sizes extracted from the simulations, with 5 and 9 water molecules. For the pentamer we used the 6-311++G(2d,2p) basis set to describe the whole system (Balanced) and, in sequence, we used the 6-311++G(2d,2p) to describe the central molecule and the 3-21G to describe its neighbors (Locally Dense). We observed that the difference between the two treatments was substantial for the oxygen atoms. For both σiso(O) and σanis(O) the difference
amounts to ~ 2 ppm, suggesting that describing the pentamer with the large basis set only on the central molecule is not reliable enough. Thus, we performed the same analysis for a large cluster with 9 molecules. Now we considered, on the one hand, the balanced basis set in all nine molecules and, on the other hand, the molecules of the first solvation shell described by a 6-311++G(2d,2p) basis set and the other molecules
described by a 3-21G basis set. Now, the difference for
σiso(O) was smaller than 0.7 ppm whereas the difference
for σanis(O) was ~1 ppm. We consider these differences
as acceptable as the procedure permitted a great reduction of the computational cost thus allowing a detailed study of the larger clusters. Based on this analysis, our study on the effects of the larger solvation shells will be performed with the 6-311++G(2d,2p)/3-21G locally dense basis set.
Chemical shift gas-liquid. Dependence with the cluster size and the counterpoise correction
For some properties the first solvation shell of the liquid water might be enough to obtain a good description of the solvent effect.46 However, for the magnetic shielding
it is necessary to go beyond, to obtain a converged value with the number of solvent molecules. In this section we will examine this effect varying the cluster size and observing the value of the chemical shielding of the reference water molecule. Figure 3 presents typical configurations of the liquid for each size. In each snapshot the first solvation shell is emphasized, indicating that all the five molecules are described with 6-311++G(2d,2p). In the other clusters, of 9, 13, 17 and 24 molecules, the molecules beyond the first shell are described by the 3-21G basis set.
As we have seen in Figure 2, the values for both the isotropic and anisotropic shielding have a converged average after approximately 40 configurations. Therefore for the clusters of 13, 17 and 24 molecules we take the average over 50 statistically uncorrelated configurations. Table 5 presents the counterpoise uncorrected (without CC) and corrected (with CC) values for the isotropic, δiso,
and anisotropic, δanis, chemical shift of the central water
molecule. The counterpoise correction is essential for a good description of the magnetic shielding of the oxygen atom and consequently of its chemical shift. For the
Table 4. Comparison between isotropic, σiso, and anisotropic, σanis, absolute magnetic shielding for balanced and locally dense basis sets. Balanced stands for 6-311++G(2d,2p) basis set and dense stands for a combination of 6-311++G(2d,2p) and 3-21G (see text). Values in ppm obtained at B3LYP level for the structures generated by DP potential. Numbers 5 and 9 refer to the cluster size. Uncertainties are the standard deviations of the averages obtained over 100 configurations (see text)
σiso(17O) σiso(1H)
5 9 5 9
Balanced 288.66 ± 10.98 282.29 ± 10.20 28.26 ± 1.33 28.04 ± 1.32
Dense 290.77 ± 10.48 281.61 ± 11.31 28.22 ± 1.49 28.23 ± 1.26
σanis(17O) σanis(1H)
5 9 5 9
Balanced 48.15 ± 12.49 42.60 ± 13.09 25.35 ± 3.49 25.05 ± 2.96
configurations with 9 water molecules for instance, the BSSE is responsible for ~6 ppm. For the hydrogen atom this error is only ~0.3 ppm. For the anisotropic chemical shift the BSSE is smaller, being less than 2 ppm for the oxygen atom and 1 ppm for the hydrogen atoms.
Table 5 shows that the chemical shifts reach stable values with 13 water molecules (see Figure 4). For these clusters the average chemical shift of oxygen is –38.10 ± 7.37 ppm, comparable with the experimental value of –36.1 ppm. For the hydrogen atoms we obtain an average of –2.91 ± 0.98 ppm. These values, corrected against BSSE and calculated with the DP potential, can be directly compared with the theoretical values of Malkin13 of δiso(17O) = –44.8 ± 2.3 ppm and δiso(1H) = –2.8 ± 0.3 ppm.
Our present results represent a considerable improvement leading to better agreement with experiment. Table 5 presents, in addition, the values of the anisotropic chemical shifts, for which there are theoretical results only in the rigid cluster approximation,51 which as seen, fails at
Figure 3. Cluster sizes used in the calculations. Highlighted molecules
were treated with a larger basis set (6-311++G(2d,2p)) while the others were treated with a smaller basis set (3-21G).
Table 5. Dependence of the isotropic, δiso, and anisotropic, δanis, chemical shifts on the cluster size. Counterpoise corrected (with CC) and uncorrected values in ppm. The structures were generated with the DP potential and the quantum calculations were performed at B3LYP level. Uncertainties are the standard deviations
without CC with CC
δiso(17O) δiso(1H) δiso(17O) δiso(1H)1
1 0.0 0.0 0.0 0.05
5 -36.25 ± 13.15 -3.11 ± 1.36 -29.49 ± 8.33 -2.77 ± 1.02
9 -43.31 ± 13.52 -3.14 ± 1.28 -36.61 ± 7.67 -2.88 ± 0.92
13 -44.32 ± 15.59 -3.22 ± 1.40 -38.10 ± 7.37 -2.91 ± 0.9817
17 -44.54 ± 11.77 -3.29 ± 1.39 -38.12 ± 7.95 -2.99 ± 1.0124
24 -44.32 ± 11.79 -3.47 ± 1.42 -38.11 ± 7.92 -3.12 ± 0.99
Exp -36.1 -4.26 -36.1 -4.26
δanis(17O) δanis(1H) δanis(17O) δanis(1H)
1 0.0 0.0 0.0 0.0
5 -7.74 ± 12.74 6.27 ± 3.85 -5.96 ± 10.73 7.08 ± 3.78
9 -11.28 ± 12.12 5.82 ± 3.72 -10.99 ± 11.01 6.93 ± 3.28
13 -13.78 ± 13.02 5.83 ± 3.20 -11.94 ± 10.54 6.59 ± 3.35
17 -14.27 ± 13.01 5.75 ± 3.31 -12.57 ± 10.13 6.62 ± 3.22
24 -14.55 ± 13.22 6.03 ± 3.22 -12.69 ± 10.78 6.78 ± 3.40
describing the isotropic chemical shift. This shift for the oxygen atom decreases with the increasing number of configurations whereas for the hydrogen atom the opposite occurs (see Figure 5). This effect was observed before in the water dimer40 and discussed in the light of recent
experimental results.26 Its main cause has been attributed
to induced currents in the proton acceptor oxygen atom.40
Table 6 presents the components of the chemical shift tensor that are parallel, δ//, and perpendicular, δ⊥, to the
symmetry axis of the tensor, that is nearly parallel to the hydrogen bond axis. Those components can be obtained from the linear combinations of the σiso and σanis, given by:
(10)
The values of both the parallel and perpendicular components for the oxygen atom have the same trend, namely the decrease with the increasing number of water molecules in the cluster. These values also converge for clusters of size 13, being δ//(17O) = -46.06 ± 12.32 ppm and δ⊥(17O) = -34.12 ± 6.52 ppm the CC corrected values. As
for the values of the hydrogen atoms, the chemical shifts
δ//(1H) and δ
⊥(
1H) showed opposite tendency, the converged
values being 1.48 ± 1.57 ppm and -5.11 ± 1.99 ppm respectively, both corrected for BSSE. Figure 6 shows the behavior for these two chemical shifts when the number of solvent molecule increases.
Dependence with the functional
Several previous works explored the use of functionals as well as suggested improvements to applications of the DFT methods in chemical shieldings calculations.52-54 In
this section we will explore the behavior of the isotropic and anisotropic chemical shifts. For that we employed a large series of functionals. The B,55 B336 and G9656
exchange functionals were used in combination with the P86,57 LYP37 and PW9158 correlation functionals. We also
consider the functionals PBE1PBE,59 MPW1PW9160 and
B97-161 in our analysis.
As we have seen in the previous sections, the average shielding are converged with 13 molecules. So in this analysis we are using this cluster size to calculate the averages. The values for the isotropic chemical shift are presented in Table 7. The chemical shift values vary with the functional in a range of 7.24 ppm for the oxygen atom, the largest value being the one obtained with the BLYP functional, -43.10 ppm, and the smallest
Table 6. Dependence of the parallel, δ//, and perpendicular, δ⊥, components of the isotropic chemical shift (in ppm) on the cluster size. Counterpoise
corrected (with CC) and uncorrected values in ppm. The structures were generated with the DP potential and the quantum calculations were performed at the B3LYP level. Uncertainties are the standard deviations
without CC with CC
δ//(17O) δ//(1H) δ//(17O) δ//(1H)
1 0.0 0.0 0.0 0.0
5 -41.41 ± 16.69 1.07 ± 2.25 -33.46 ± 13.04 1.95 ± 1.73
9 -50.90 ± 16.68 0.74 ± 2.26 -43.94 ± 12.94 1.75 ± 1.63
13 -53.50 ± 14.37 0.66 ± 1.81 -46.06 ± 12.32 1.48 ± 1.57
17 -54.05 ± 14.47 0.54 ± 1.88 -46.50 ± 12.63 1.42 ± 1.71
24 -54.02 ± 14.67 0.55 ± 1.79 -46.57 ± 15.90 1.35 ± 1.57
δ⊥(
17O) δ
⊥(
1H) δ
⊥(
17O) δ
⊥(
1H)
1 0.0 0.0 0.0 0.0
5 -33.67 ± 13.20 -5.20 ± 2.28 -27.50 ± 7.58 -5.13 ± 2.20
9 -39.52 ± 13.56 -5.08 ± 2.07 -32.95 ± 6.69 -5.19 ± 1.87
13 -39.72 ± 12.44 -5.17 ± 2.17 -34.12 ± 6.52 -5.11 ± 1.99
17 -39.78 ± 12.63 -5.21 ± 2.19 -33.93 ± 6.54 -5.20 ± 2.26
24 -39.48 ± 12.61 -5.48 ± 2.21 -33.88 ± 7.03 -5.42 ± 2.02
value obtained with the B3PW91 functional, -35.86 ppm. For the hydrogen atoms we observed a variation in the range of 0.18 ppm the largest value obtained with the G96P86 functional and the smallest value obtained with the MPW1PW91 and PBE1PBE functionals. The choice of the exchange functional is important for a good description of the isotropic chemical shift. It can be observed, for instance, by comparing the obtained values with the functionals which have B, B3 and G96 as the exchange functional, for which the difference reaches 5 ppm for the isotropic chemical shift of the oxygen atom (which is the case of BLYP and B3LYP functionals). That shows a relative superiority of the B3 functional. In all the cases, the values obtained with the functional G96 were intermediate to the values obtained with the B and B3 functional.
One can also compare the quality of the correlation functionals. One can see that with the same exchange functional (B, B3 or G96) the PW91 was the one that presented the best values for δiso(17O). For δiso(1H) the
values obtained with P86 showed a slightly superior quality than PW91 correlation functional. Using the LYP correlation functional we obtained the largest values for
δiso(17O) and the smallest values for δiso(1H). In a recent
study on the determination of the chemical shift for 105 molecules in gas phase, it was noted that the B3LYP, B3P86 and B3PW91 presented essentially the same performance. However, in the present work we observed that the B3PW91 presents a smaller deviation from the experimental value (0.7%) than the B3LYP (5.5%) and B3P86 (2.4%) functionals.
The MPW1PW91 and PBE1PBE functionals have already been successfully employed in the determination of the chemical shift.14 Here they have shown again to be
good models to gas-liquid chemical shifts, presenting for the δiso(17O) a deviation smaller than 0.7% from the
experimental value.
Finally we have obtained the value for the anisotropic chemical shift, for both oxygen and hydrogen atoms, showing to be less sensitive to the employed functional, being the difference among the several values within a small range of 0.75 ppm for δanis(17O) and 0.23 ppm for δanis(1H).
Conclusions
The chemical shifts in liquid water were studied using the sequential QM/MM methodology. The liquid water was simulated via Monte Carlo and Molecular Dynamic
methods with four different potentials. Two of them without intramolecular terms (SCP and TIPS), and two with intramolecular terms (FERG and DP). Statistically Table 7. Averages of the chemical shifts (in ppm) obtained for the clusters with 13 water molecules calculated with several functionals. Uncertainties are
the standard deviations
δiso(17O) δiso(1H) δanis(17O) δanis(1H)
BLYP -43.10 ± 7.93 -2.98 ± 1.04 -11.50 ± 10.28 6.44 ± 3.16
B3LYP -38.10 ± 7.37 -2.91 ± 0.98 -11.94 ± 10.54 6.59 ± 3.35
G96LYP -40.49 ± 8.00 -3.04 ± 1.01 -12.28 ± 10.93 6.60 ± 3.40
BP86 -42.68 ± 7.91 -3.04 ± 1.00 -11.85 ± 10.88 6.44 ± 3.33
B3P86 -36.96 ± 7.30 -2.94 ± 0.98 -12.19 ± 10.41 6.41 ± 3.33
G96P86 -39.87 ± 7.78 -3.08 ± 0.99 -12.25 ± 10.66 6.64 ± 3.34
BPW91 -40.35 ± 7.70 -3.03 ± 1.00 -11.58 ± 10.74 6.48 ± 3.32
B3PW91 -35.86 ± 7.23 -2.93 ± 0.99 -11.90 ± 10.45 6.55 ± 3.32
G96PW91 -37.53 ± 7.64 -3.06 ± 1.00 -11.96 ± 10.62 6.59 ± 3.31
MPW1PW91 -35.86 ± 7.15 -2.90 ± 0.98 -11.66 ± 10.36 6.53 ± 3.31
PBE1PBE -36.14 ± 7.13 -2.90 ± 0.97 -11.76 ± 10.29 6.60 ± 3.34
B971 -36.29 ± 7.14 -2.92 ± 0.98 -11.91 ± 10.28 6.61 ± 3.34
Exp -36.1a -4.26b
aReference 25; breference 26.
Figure 6. Average of the parallel, δ// (ppm) and perpendicular, δ⊥ (ppm),
uncorrelated structures were selected and used in the DFT calculations of the absolute magnetic shielding and of the isotropic and anisotropic chemical shifts. Statistically converged averages were obtained for these properties.
In a first analysis we studied the dependence of the chemical shielding with the potential employed to generate the structures of the liquid. Using the B3LYP/ 6-311++G(2d,2p) method, we have verified that the rigid potentials are not appropriate for the description of the chemical shift, showing the necessity to consider the vibration effects in the study of the liquid and gas phase. We also verified that the FERG potential, though it has reproduced relatively well the chemical shift, does not provide a good description for the absolute shielding. Next, we considered only the DP potential which reproduced satisfactorily both the absolute shieldings and the chemical shifts.
To study the convergence of the averages calculated in relation to cluster size we analyzed clusters containing 5, 9, 13, 17 and 24 molecules. The expedient of locally dense basis set was used to perform the calculations. In this sense, the reference molecule and its first solvation shell were treated with the 6-311++G(2d,2p) basis set while the remaining molecules in the cluster were treated with the 3-21G basis set. We observed that the difference between the results with the conventional method, where all molecules are described with the larger basis set and the locally dense basis set approach, was small, being less than 1 ppm for the isotropic chemical shift for the oxygen atom in the cluster with 9 molecules and the computational demand was drastically reduced.
For each cluster size we obtained the isotropic and anisotropic chemical shifts, with and without the counterpoise correction, as averages over 50 configurations, except for clusters of size 5 and 9 for which we used 100 configurations in the average. We verified that the isotropic chemical shift for the oxygen atom only achieved convergence when the cluster had 13 molecules and the BSSE was corrected. We observed that while the BSSE correction, that was ~6 ppm, has improved the value for oxygen atom, it has worsened the value for the hydrogen atom. For the anisotropic chemical shifts the errors were smaller, namely less than 2 ppm for the oxygen atom and 1 ppm for the hydrogen atoms. Thus, with the B3LYP functional, we obtained the values of 38.10±7.37 ppm and -2.91±0.98 ppm as the better description for the isotropic chemical shifts for the oxygen and hydrogen atoms, respectively. These values are within 5% of the experimental ones, giving a motivation to analyze the dependence of the chemical shift with the functional.
For this analysis we considered 12 different functionals, and we verified that the range of values is 7.24 ppm for the
oxygen atom, with the largest value being that obtained with BLYP functional and the smallest value obtained with the B3PW91 functional. We noticed that the choice of the exchange functional is important for the description of the chemical shifts, which varied up to 5 ppm between the B and B3 exchange functionals. We also noticed that the values obtained with the G96 functionals produced intermediate results between the B and B3 results, with the B3 functional producing the best values. The MPW1PW91, PBE1PBE and B971 functionals presented values for
δiso(17O) in excellent agreement with the experimental
values, since all of them presented deviations smaller than 0.7%. We also verified that the anisotropic chemical shifts were less sensitive to the functional, being the results for different functionals in a range of 0.75 ppm for δanis(17O).
The present results combine quantum mechanics calculations of nuclear magnetic resonance parameters with the necessary statistical nature of the liquid and all results presented here are statistically converged.
Acknowledgments
This work has been partially supported by CNPq and FAPESP (Brazil).
References
1. Krauss, M.; Olsen, L.; Antony, J.; Hemmingsen, L.; J. Phys. Chem. B 2002, 106, 9446.
2. Krishnamurty, S.; Heine, T.; Goursot, A.; J. Phys. Chem. B
2003, 107, 5728.
3. Zhou, P.; Li, G.; Shao, Z.; Pan, X.; Yu, T.; J. Phys. Chem. B
2001, 105, 12469.
4. Consentino, U.; Villa, A.; Pitea, D.; Moro, G.; Barone, V.; Maiocchi, A.; J. Am. Chem. Soc. 2001, 124, 4901.
5. Dong, S.; Ida, R.; Wa, G.; J. Phys. Chem. A 2000, 104, 11194.
6. Scheiner, S.; Hydrogen Bonding: A Theoretical Perspective, Oxford Press: Oxford, 1999.
7. Jeffrey, G. A.; Introduction to Hydrogen Bond, Oxford Press: Oxford, 1997.
8. Yamazaki, T.; Sato, H.; Hirata, F.; J. Chem. Phys. 2001, 115, 8949.
9. Sebastiani, D.; Rothlisberger, U.; J. Phys. Chem. B 2004, 108, 2807.
10. Jackowski, K.; Barszczewicz, A.; J. Mol. Struct. 1998, 431, 47.
11. Nymand, T.; Astrand, P. O.; Mikkelsen, K. V.; J. Phys. Chem. B
1997, 101, 4105.
12. Cui, Q.; Karplus, M.; J. Phys. Chem. B 2000, 104, 3721. 13. Malkin, V. G.; Malkina, O. L.; Steinebrunner, G.; Huber, H.;
14. Mennucci, B.; Martínez, J. M.; Tomasi, J.; J. Phys. Chem. A
2001, 105, 7287.
15. Kirkwood, J. G.; J. Chem. Phys. 1934, 2, 351. 16. Onsager, L.; J. Am. Chem. Soc. 1936, 58, 1486.
17. Jackowski, K.; Chem. Phys. Lett. 1992, 194, 167.
18. Chesnut, D. B.; Rusiloski, B. E.; J. Mol. Struct. 1994, 314, 19.
19. Cheeseman, J. R.; Trucks, G. W.; Keith, T. A.; Frisch, M. J.; J. Chem. Phys. 1996, 104, 5497.
20. Fileti, E. E.; Coutinho, K.; Malaspina, T.; Canuto, S.; Phys. Rev. E 2003, 67, 061504.
21. Coutinho, K.; Canuto, S.; Adv. Quantum Chem. 1997, 28, 89. 22. Malaspina, T.; Coutinho, K.; Canuto, S.; J. Chem. Phys. 2002,
117, 1692.
23. Coutinho, K; Canuto, S.; J. Chem. Phys 2000, 113, 9132.
24. Coutinho K; Canuto, S.; Zerner, M. C.; J. Chem. Phys. 2000, 112, 9874.
25. Wasylishen, R. E.; Bryce, D. L.; J. Chem. Phys. 2002, 117, 10061.
26. Modig, K.; Halle, B.; J. Am. Chem. Soc. 2002, 124, 12031. 27. Pople, J. A.; Schneider, W. G.; Bernstein, H. J.; High-Resolution
Nuclear Magnetic Resonance, McGraw-Hill: New York, 1959. 28. Slichter, C. P.; Principles of Magnetic Resonance, Harper and
Row: New York, 1963.
29. Berendsen, H. J. C.; Postma, J. P. M.; van Gunsteren, W. F.; Hermans, J. In Intermolecular Forces; Pullman, B., ed.; Reidel: Dordrecht, 1981, p. 331.
30. Jorgensen, W. L.; J. Am. Chem. Soc. 1981, 103, 335. 31. Ferguson, D. M.; J. Comput. Chem. 1995, 16, 501.
32. Dang, L. X.; Pettit, B. M.; J. Phys. Chem. 1987, 91, 3349. 33. Coutinho, K.; Canuto, S.; DICE: A Monte Carlo Program for
Molecular Liquid Simulation; Universidade de São Paulo: São Paulo, 2001.
34. Berendsen, H. J. C.; van der Spoel, D.; van Drunen, R.; Comput. Phys. Commun. 1995, 91, 43.
35. Lindahl, E.; Hess, B.; van der Spoel, D.; J. Mol. Model. 2001, 7, 306.
36. Becke, A. D.; J. Chem. Phys. 1993, 98, 5648.
37. Lee, C.; Yang, W.; Par, R. G.; Phys. Rev. B 1988, 37, 785.
38. Wolinski, K.; Hinton, J. F.; Pulay, P.; J. Am. Chem. Soc. 1990, 112, 8251.
39. Ditchfield, R.; Mol. Phys. 1974, 27, 789. 40. Ditchfield, R.; J. Chem. Phys. 1976, 65, 3123.
41. Frisch, M. J.; Trucks, G. W.; Schlegel, H. B.; Scuseria, G. E.; Robb, M. A.; Cheeseman, J. R.; Montgomery, Jr., J. A.; Vreven, T.; Kudin, K. N.; Burant, J. C.; Millam, J. M.; Iyengar, S. S.; Tomasi, J.; Barone, V.; Mennucci, B.; Cossi, M.; Scalmani, G.; Rega, N.; Petersson, G. A.; Nakatsuji, H.; Hada, M.; Ehara, M.; Toyota, K.; Fukuda, R.; Hasegawa, J.; Ishida, M.; Nakajima, T.; Honda, Y.; Kitao, O.; Nakai, H.; Klene, M.; Li, X.; Knox, J. E.; Hratchian, H. P.; Cross, J. B.; Bakken, V.; Adamo, C.;
Jaramillo, J.; Gomperts, R.; Stratmann, R. E.; Yazyev, O.; Austin, A. J.; Cammi, R.; Pomelli, C.; Ochterski, J. W.; Ayala, P. Y.; Morokuma, K.; Voth, G. A.; Salvador, P.; Dannenberg, J. J.; Zakrzewski, V. G.; Dapprich, S.; Daniels, A. D.; Strain, M. C.; Farkas, O.; Malick, D. K.; Rabuck, A. D.; Raghavachari, K.; Foresman, J. B.; Ortiz, J. V.; Cui, Q.; Baboul, A. G.; Clifford, S.; Cioslowski, J.; Stefanov, B. B.; Liu, G.; Liashenko, A.; Piskorz, P.; Komaromi, I.; Martin, R. L.; Fox, D. J.; Keith, T.; Al-Laham, M. A.; Peng, C. Y.; Nanayakkara, A.; Challacombe, M.; Gill, P. M. W.; Johnson, B.; Chen, W.; Wong, M. W.; Gonzalez, C.; Pople, J. A.; Gaussian 03, Revision B.04; Gaussian Inc., Pittsburgh PA, 2003.
42. Gauss, J.; Stanton, J. F.; J. Chem. Phys. 1996, 104, 2574. 43. Vaara, J.; Lounilla, J.; Ruud, K.; Helgaker, T.; J. Chem. Phys.
1998, 109, 8388.
44. Karadakov, P.; J. Mol. Struct. 2002, 602, 293.
45. Hehre, W. J.; Radom, L.; Schleyer, P. v.R.; Pople, J. A.; Ab Initio Molecular Orbital Theory, John Wiley: New York, 1986. 46. Eisenberg, D.; Kauzmann, W.; The Structure and Properties
of Water, Oxford University Press: London, 1969. 47. Boys, S. F.; Bernardi, F.; Mol. Phys. 2004, 19, 553.
48. Chesnut, D. B.; Moore, K. D.; J. Comput. Chem. 1989, 10,
648.
49. Chesnut, D. B.; Phung, C. G.; Chem. Phys. Lett. 1991, 183,
505.
50. Chesnut, D. B.; Rusiloski, B. E.; J. Phys. Chem. 1993, 97, 2839.
51. Hinton, J. F.; Guthrie, P.; Pulay, P.; Wolinski, K.; J. Am. Chem. Soc. 1992, 114, 1604.
52. Allen, M. J.; Keal, T. W.; Tozer, D. J.; Chem. Phys. Lett. 2003, 380, 70.
53. Wilson, P. J.; Tozer, D. J.; Chem. Phys. Lett. 2001, 337, 341. 54. Wilson, P. J.; Amos, R. D.; Handy, N. C.; Chem. Phys. Lett.
1999, 312, 475.
55. Becke, A. D.; Phys. Rev. A 1988, 38, 3098.
56. Gill, P. M. W.; Mol. Phys. 1996, 89, 433. 57. Perdew, J. P.; Phys. Rev. B 1986, 33, 8822.
58. Perdew, J. P.; Chevary, J. A.; Vosko, S. H.; Jackson, K. A.; Pederson, M. R.; Singh, D. J.; Fiolhais. C.; Phys. Rev. B 1992,
46, 1992.
59. Perdew, J. P.; Burke, K.; Ernzerhof, M.; Phys. Rev. Lett. 1997,
78, 1396.
60. Adamo, C.; Barone, V.; J. Chem. Phys. 1998, 108, 664.
61. Hamprecht, F. A.; Cohen, A. J.; Tozer, D. J.; Handy, N. C.; J. Chem. Phys. 1998, 109, 6264.
62. Hindman, J. C.; J. Chem. Phys. 1966, 44, 4582.
Received: December 08, 2005
Web Release Date: October 19, 2006