*e-mail: [email protected]
A Rapid and Simple Method for Determination of 5-Hydroxytryptophan in Dietary
Supplements by Capillary Electrophoresis
Aline G. Coelho,a Fernanda P. C. Aguiara and Dosil P. de Jesus*,a,b
aInstitute of Chemistry and bInstituto Nacional de Ciência e Tecnologia de Bioanalítica,
University of Campinas (UNICAMP), P.O. Box 6154, 13083-970 Campinas-SP, Brazil
Neste trabalho é apresentado o desenvolvimento de um método rápido e simples, empregando eletroforese capilar, para determinação de 5-hidroxitriptofano (5-HTP) em amostras de suplementos alimentares. O eletrólito de corrida utilizado foi constituído por 20 mmol L−1 de
fosfato de sódio (pH 10) e 0,2 mmol L−1 de brometo de cetiltrimetilamônio (CTAB), empregado
como inversor de fluxo eletrosmótico. Foram obtidos limites de detecção e quantificação de 3,1 e 10,1 µmol L−1, respectivamente. A curva analítica obtida, para concentrações do analito entre
0-500 µmol L−1, apresentou linearidade com coeficiente de correlação linear (R2) de 0,9995. A
precisão instrumental intra-dia (repetibilidade), expressa em desvio padrão relativo (RSD), para a área de pico e tempo de migração do 5-HTP foram de 2,2 e 1,9% (n = 8), respectivamente. O método eletroforético foi empregado na análise de quatro diferentes amostras comerciais de suplementos alimentares e o RSD (n = 3) para as determinações variaram de 2 a 3%. A exatidão do método foi avaliada pela comparação das concentrações de 5-HTP obtidas pelo método proposto e por cromatografia líquida de alta eficiência (HPLC). Os erros relativos variaram entre 0 e 5,9% e não foram observadas diferenças significativas entre as concentrações, ao nível de 95% de confiança.
A rapid and simple capillary electrophoresis (CE) method was developed to determine 5-hydroxytryptophan (5-HTP) in samples of commercial dietary supplements. The optimized background electrolyte (BGE) was composed by 20 mmol L−1 sodium phosphate (pH 10) and
0.2 mmol L−1 cetyltrimethylammonium bromide (CTAB) for electroosmotic flow inversion. The
limits of detection (LOD) and quantification (LOQ) for 5-HTP were 3.1 and 10.1 µmol L−1,
respectively. The analytical curve demonstrated linearity over a concentration range of 0-500 µmol L−1 with a correlation coefficient (R2) of 0.9995. The intraday instrumental precision
(repeatability) as relative standard deviation (RSD) in terms of peak area and migration time of the 5-HTP were 2.2 and 1.9% (n = 8), respectively. The CE method was applied to the analysis of four different samples of commercial dietary supplements and the RSD (n = 3) for the determinations ranged from 2 to 3%. The accuracy of the method was evaluated comparing the measured 5-HTP concentrations to those obtained by a high performance liquid chromatography (HPLC) method. The relative error ranged from 0 to 5.9% (n = 3) and no significant differences between the concentrations were observed at a confidence level of 95%.
Keywords: serotonin, tryptophan, indolamines, Griffonia simplicifolia, depression
Introduction
The use of complementary and alternative medicines for the treatment of physical and mental health problems has been increasing in the last decade worldwide.1,2 Natural
medications for mood disorders, such as depression, anxiety, and insomnia are among the most popular. An example is
the commercialization of 5-hydroxytryptophan (5-HTP) as dietary supplements for the treatment of depression, obesity, fibromyalgia, insomnia, chronic headaches, and also as a potent antioxidant.3 The 5-HTP is an aromatic
amino acid synthesized invivo from the essential amino acid tryptophan by the enzyme tryptophan hydroxylase (Figure 1).1,4 After entering the central nervous system, the
Serotonin is a neurotransmitter and vasoconstrictor in the central nervous system, responsible for the modulation of anger, aggression, mood, sexuality, appetite, and muscle contraction. Some authors have reported7,8 that low
serotonin levels can lead to depression disease. As 5-HTP and tryptophan are precursors in the serotonin synthesis (Figure 1), the ingestion of these amino acids has been studied for the treatment of depression.1 For this propose,
the 5-HTP has some advantages, once it is converted more quickly to serotonin because it easily crosses the barrier blood-brain, while the tryptophan needs a carrier molecule.1,9 Moreover, tryptophan requires an additional
step (conversion to 5-HTP) in the serotonin synthesis pathway.
Currently, commercial supplements of 5-HTP are obtained from seeds of an African plant called
Griffonia simplicifolia. In the USA, dietary supplement formulations containing 5-HTP, vitamins, and preservatives can be purchased from health-food stores and drugstores without medical prescription. The main benefits of taking 5-HTP dietary supplements are effectiveness as standard antidepressants, mood enhancement, helping in weight loss, and aiding sleeping.
There is an increasing tendency towards using 5-HTP as alternative and natural medication for treatment of mood disorders and obesity, so the development of analytical methods for determination of this amino acid in dietary supplements, biological fluids, and other matrices has gained great attention. High performance liquid chromatography (HPLC) methods have been used for determination of 5-HTP and other indoleamines, such as tryptophan and serotonin, in rat brain tissue,10 coffee,9
human serum,11 fruiting bodies of edible mushroom,12
chocolate,7 milk-based ingredients, and dried sport
supplements.13 Electrochemical14-16 and
ultraviolet-visible16 spectroscopy methods have also been used for
determination of 5-HTP.
Capillary electrophoresis (CE) can be advantageous for determination of 5-HTP, since this technique can provide high separation efficiency and short analysis time with consumption of low volumes of sample and background electrolyte (BGE).17 However, few works have reported
the use of CE for determination of 5-HTP in standard solutions,18,19 urine,20-22 serum,22,23 neuronal extracts,24
medical syrup,25 and human plasma.26 In addition, most of
these works employed amperometric,19,20 fluorescence,21-24
and mass spectrometry26 detection methods instead of
ultraviolet (UV) detection that is the most commonly used in commercial CE systems.
In this paper, a simple and rapid method for determination of 5-HTP in dietary supplements using CE with UV detection is proposed. This method required simple sample preparation steps such as dissolving samples in water, filtration, and appropriated dilution in the CE BGE. To the best of our knowledge, this is the first work reporting the analysis of 5-HTP dietary supplements by CE.
Experimental
Reagents and solutions
All reagents were of analytical grade except methanol, which was HPLC grade. Sodium hydroxide, sodium phosphate, and phosphoric acid were purchased from Labsynth (Diadema, SP, Brazil). Potassium hydrogen phthalate was from Vetec (Rio de Janeiro, RJ, Brazil). Cetyltrimethyl ammonium bromide (CTAB) and L-tryptophan were purchased from Sigma-Aldrich (Steinheim, Germany), and 5-HTP was from Acros (New Jersey, USA). Methanol was from Tedia (Fairfield, OH, USA). Ultra-pure water was obtained from Direct-Q 3 UV Water Purification System (Millipore, Molsheim, France). The BGE was composed by 20 mmol L−1 sodium phosphate
and 0.2 mmol L−1 CTAB for electroosmotic flow inversion.
The pH of the BGE was adjusted to 10 with sodium hydroxide aqueoussolution (0.1 mol L−1).Stock solution
of 5-HTP (10 mmol L−1) was prepared by dissolving the
solid reagent in ultra-pure water. Standard solutions of 5-HTP were prepared by dilution of the stock solution with ultra-pure water or BGE, as required. Phthalate (as potassium hydrogen phthalate) was added (100 µmol L−1)
to all solutions as an internal standard.
Sample preparation
Four different commercial dietary supplements containing 5-HTP were purchased from pharmacy stores in the USA. The samples were crushed (tablets) or removed
BGE and the internal standard was then added. For HPLC analysis, the samples solutions were only diluted with ultra-pure water. The diluted sample solutions were filtered through a membrane filter (0.22 µm) before injection into CE or HPLC systems.
Instrumentation and procedure
CE analyses
CE analyses were performed in an Agilent 7100 capillary electrophoresis system (Agilent, Waldbronn, Germany) equipped with a diode array detector. The CE method employed a bare fused silica capillary of 60 cm total length, 52.5 cm effective length, and 50 µm internal diameter. The sample solutions were hydrodynamically injected into the capillary using 50 mbar pressure for 4 s. The separation voltage was −20 kV and the UV detection was performed at 214 nm with a data acquisition rate of 2.5 Hz. Before the first run of the day, the capillary was flushed with 1 mol L−1 NaOH aqueous solution for 5 min,
then with ultra-pure water for 5 min, and finally with the BGE for 5 min.
HPLC analyses
The accuracy of the proposed method was evaluated by comparison with a HPLC method adapted from a reference method for determination of tryptophan.27
The HPLC analyses were performed using an Agilent HPLC 1200 Series (Agilent, Waldbronn Germany). The analytical column was a C18 Zorbax Eclipse plus (5 mm,
4.6 mm × 250 mm). The mobile phase consisted of sodium acetate aqueous solution (8.5 mmol L−1), with pH 4.0
adjusted with acetic acid/methanol (95:5, v/v), at a flow rate of 1.5 mL min−1. UV detection was performed at 280 nm.
Results and Discussion
CE Separation
The optimization of the CE parameters was important to attain fast and efficient separation. The pH of the BGE was adjusted to 10.0 because at high pH values the 5-HTP has a net negative charge caused by the full ionization of its carboxylic acid group (pKa = 2.7) and the partial
protonation of the amine group (pKa = 9.6) and the hydroxyl
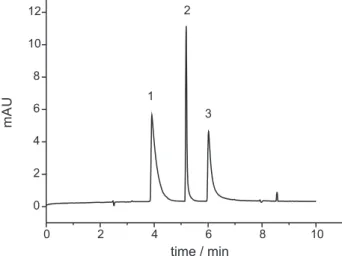
group (pKa = 10.7) on the indole ring. Figure 2 shows
an electropherogram of a standard solution containing
acids could be baseline separated and the 5-HTP showed a higher electrophoretic mobility (shorter migration time) than tryptophan. This difference can be explained by the presence of the hydroxyl group in the 5-HTP that is partially ionized at the pH of the BGE.
The noticeable asymmetry in the peak shape, mainly for phthalate and tryptophan, can be ascribed to electrodispersion, an intrinsic phenomenon in electrophoretic process caused by differences in mobilities between the analyte zones and the BGE. Despite this electrodispersion, good peak resolution was achieved.
The inversion of the eletroosmotic flow, by adding CTAB in the BGE, contributed to a reduced separation time of less than 7 min. Phthalate was demonstrated to be a good internal standard because it was not present in the samples and its migration time was very close to those of the analytes.
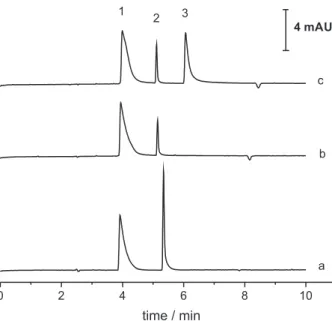
Figures 3a and 3b show electropherograms of a standard solution of 5-HTP (300 µmol L−1) and a dietary supplement
sample, respectively. For some samples, slight shifts in the migration time for the 5-HTP peak were observed and can more likely be attributed to variation in the electroosmotic flow intensity or influence of the sample composition (ionic strength). Nevertheless, the identity of the 5-HTP peak was confirmed by spiking experiments. Although vitamins, additives, and excipients were present in the samples, no
Figure 2. Electropherogram of a standard solution of 5-HTP and tryptophan (300 µmol L−1 each). BGE: 20 mmol L−1 sodium phosphate
(pH 10) and 0.2 mmol L−1 CTAB for electroosmotic flow inversion. Fused
interference peaks were observed, demonstrating a good selectivity of the proposed method.
The CE method demonstrated a good recovery (95%) for a sample spiked with tryptophan at 300 µmol L−1
(Figure 3c), suggesting the proposed method can also be used to evaluate contamination or intentional adulteration of 5-HTP dietary supplements with tryptophan. Nevertheless, the analyzed samples showed tryptophan concentration lower than the limit of detection (LOD).
Figures of merit of the CE method
To ensure the applicability of the proposed method, the main figures of merit were evaluated according to the recommendations described in the literature28 and the
results are summarized in Table 1. The linearity of the analytical curve over a wide range of 5-HTP concentrations (0-500 µmol L−1) was evidenced by the high value of the
regression coefficient (R2 = 0.9995). The instrumental
precision was evaluated by consecutive injections (n = 8) of a standard solution of 5-HTP (200 µmol L−1) and the
relative standard deviation (RSD) was 2.2% in terms of peak area and 1.92% for the migration time.
Analyses of dietary supplements
The feasibility and usefulness of the developed CE method was evaluated by the determination of 5-HTP in four different samples of commercial dietary supplements.
The labeled concentration of 5-HTP in the samples was 100 mg per tablet (or pill) except for one sample that was 200 mg per tablet. Table 2 shows the results obtained by the proposed CE method and the HPLC method used for comparison. The RSD (n = 3) for the determinations ranged from 2 to 3 % for the CE method and 0.5 to 6% for the HPLC method. By the Student’s t-test (Table 2), no statistically significant differences between the concentrations measured by the methods were found at a confidence level of 95%.
Conclusions
The consumption of 5-HTP as a dietary supplement has increased worldwide since evidence emerged suggesting this amino acid can be an alternative and natural medication for treatment of mood disorders and obesity. Thus, the development of analytical methods for determination of 5-HTP in many sample matrices will attract great attention in the coming years. In this context, this work has contributed to demonstrating that CE can be a suitable technique for fast and simple determination of 5-HTP in dietary supplements, as well as for detection of contamination/adulteration with tryptophan.
Figure 3. Electropherograms of (a) a standard solution of 5-HTP (300 µmol L−1), (b) a sample of dietary supplement, and (c) a sample
of dietary supplement spiked with tryptophan (300 µmol L−1). Phthalate
(100 µmol L−1) was added to the solutions as internal standard. Separation
conditions as in Figure 2. Peaks: (1) phthalate (internal standard), (2) 5-HTP, (3) tryptophan.
Table1. Figures of merit of the method
Migration time / mina 5.2 ± 0.1
N / mb 158,093
Regression equationc Y = 2.5 × 10⁻³x − 1.15 × 10⁻²
LOD / (µmol L−1)d 3.1
LOQ / (µmol L−1)e 10.1
Linear range / (µmol L−1)f 0-500
R2 0.9995
aMean and standard deviation for 8 consecutive replicate runs; bnumber of
plates per meter calculated from N/m = 5.54 (tm/w1/2)2/L, where t m is the
migration time, w1/2 is the peak width at half height, and L is the effective capillary length; cx = concentration of 5-HTP (µmol L−1); y = ratio of peak
area of 5-HTP to that of internal standard; dS/N = 3; eS/N = 10; fn = 3.
Table 2. Results of the comparison between CE and HPLC methods Sample
Concentration measured (mean ± SD)a
Error / %b
Accuracy, calculated t-valuec
CE HPLC
1 206 ± 6 199 ± 1 3.5 1.99
2 96 ± 2 102 ± 4 −5.9 2.32
3 108 ± 5 105 ± 4 2.9 0.81
4 94 ± 2 94 ± 6 0 0
amg per tablet or pill; SD = standard deviation (n = 3); brelative error; ccalculated Student’s t-value; 2.78 is the tabulated t-value at a confidence
2008/57805-2, 2008/53868-0, and 2012/21787-6) and the Conselho Nacional de Desenvolvimento Científico e Tecnológico (CNPq, grants No. 305318/2012-8, 476397/2010-3, and 573672/2008-3). The authors thank Dr Luke Beesley for English revision of the manuscript.
References
1. Iovieno, N.; Dalton, E. D.; Fava, M.; Mischoulon, D.; J. Affect. Disord.2011, 130, 343.
2. Shaw, K.; Turner, J.; Del Mar, C.; Aust. N. Z. J. Psychiat.2002,
36, 488.
3. Koppisetti, G.; Siriki, A.; Sukala, K.; Subbaraju, G. V.; Anal. Chim.Acta2005, 549, 129.
4. Turner, E. H.; Loftis, J. M.; Blackwell, A. D.; Pharmacol. Therapeut. 2006, 109, 325.
5. Park, M.; Kang, K.; Park, S.; Back, K.; Biosci. Biotech. Bioch.
2008, 72, 2456.
6. Freedman, R. R.; Maturitas2010, 65, 383.
7. Guillén-Casla, V.; Rosales-Conrado, N.; León-González, M. E.; Pérez-Arribas, L. V.; Polo-Díez, L. M.; J. Chromatogr. A2012,
1232, 158.
8. Van Praag, H. M.; Westenberg, H. G. M.; Gerritsen, T. W.; Meijer, B. A.; Psychiat. Res. 1982, 7, 373.
9. Martins, A. C. C. L.; Silva, T. M.; Gloria, M. B. A.; Quim. Nova
2010, 33, 316.
10. Haavik, J.; Flatmark, T.; Jacobsen, S. W.; Anal. Bioch.1980,
107, 71.
11. Hervé, C.; Beyne, P.; Jamault, H.; Delacoux, E.; J. Chromatogr. B
1996, 675, 157.
14. Cohen, J. L.; Widera, J.; Cox, J. A.; Electroanal. 2002, 14, 231. 15. Shahrokhian, S.; Bayat, M.; Microchim. Acta2011, 174, 361. 16. Tunna, I. J.; Patel, B. A.; Anal. Method.2013, 5, 2523. 17. Olefirowicz, T. M.; Ewing, A. G.; Anal. Chem.1990, 62, 1872. 18. Gostkowski, M. L.; Wei, J.; Shear, J. B.; Anal. Biochem.1998,
260, 244.
19. Wang, J.; Chen, G.; Talanta 2003, 60, 1239.
20. Wang, W.; Qiu, B.; Xu, X.; Zhang, L.; Chen, G.; Electrophoresis
2004, 25, 903.
21. Li, M. D.; Tseng, W. L.; Cheng, T. L.; J. Chromatogr. A2009,
1216, 6451.
22. Caslavska, J.; Gassmann, E.; Thormann, W.; J. Chromatogr. A
1995, 709, 147.
23. Chan, K.; Muschik, G.; Issaq, H.; J. Chromatogr. A1995, 718, 203.
24. Wise, D. D.; Shear, J. B.; J. Chromatogr. A2006, 1111, 153. 25. Takagai, Y.; Igarashi, S.; Chem. Pharm. Bull.2003, 51, 373. 26. Peterson, Z. D.; Lee, M. L.; Graves, S. W.; J. Chromatogr. B
2004, 810, 101.
27. Allred, M. C.; Macdonald, J. L.; J. Assoc. Off. Anal. Chem.
1988, 71, 603.
28. Ribani, M.; Bottoli, C. B. G.; Collins, C. H.; Jardim, I. C. S. F.; Melo, L. F. C.; Quim. Nova2004, 27, 771.
Submitted on: October 7, 2013.
Published online: February 7, 2014