• Nenhum resultado encontrado

Rev. Saúde Pública vol.46 número1

N/A
N/A
Protected

Academic year: 2018

Share "Rev. Saúde Pública vol.46 número1"

Copied!
9
0
0

Texto

(1)

Maria Rita de Cassia Oliveira CuryI

Vania Del´Arco PaschoalII

Susilene Maria Tonelli NardiIII

Ana Patrícia ChierottiII

Antonio Luiz Rodrigues JúniorIV

Francisco Chiaravalloti-NetoV

I Secretaria Municipal de Saúde e Higiene. São José do Rio Preto, SP, Brasil

II Faculdade de Medicina de São José do Rio Preto. São José do Rio Preto, SP, Brasil III Laboratório Regional de São José do Rio

Preto. Instituto Adolfo Lutz. São José do Rio Preto, SP, Brasil

IV Departamento de Medicina Social. Faculdade de Medicina de Ribeirão Preto, Universidade de São Paulo (USP). Ribeirão Preto, SP, Brasil

V Departamento de Epidemiologia. Faculdade de Saúde Pública. USP. São Paulo, SP, Brasil Correspondence:

Francisco Chiaravalloti-Neto Faculdade de Saúde Pública da USP Av. Dr. Arnaldo, 715

01246-904 São Paulo, SP, Brasil E-mail: franciscochiara@usp.br Received: 2/15/2011 Approved: 7/26/2011

Article available from: www.scielo.br/rsp

Spatial analysis of leprosy

incidence and associated

socioeconomic factors

Análise espacial da incidência

de hanseníase e fatores

socioeconômicos associados

ABSTRACT

OBJECTIVE: To identify clusters of the major occurrences of leprosy and their associated socioeconomic and demographic factors.

METHODS: Cases of leprosy that occurred between 1998 and 2007 in São

José do Rio Preto (southeastern Brazil) were geocodifi ed and the incidence

rates were calculated by census tract. A socioeconomic classifi cation score

was obtained using principal component analysis of socioeconomic variables. Thematic maps to visualize the spatial distribution of the incidence of leprosy with respect to socioeconomic levels and demographic density were constructed using geostatistics.

RESULTS: While the incidence rate for the entire city was 10.4 cases per 100,000 inhabitants annually between 1998 and 2007, the incidence rates of individual census tracts were heterogeneous, with values that ranged from 0 to 26.9 cases per 100,000 inhabitants per year. Areas with a high leprosy incidence

were associated with lower socioeconomic levels. There were identifi ed

clusters of leprosy cases, however there was no association between disease incidence and demographic density. There was a disparity between the places where the majority of ill people lived and the location of healthcare services.

CONCLUSIONS: The spatial analysis techniques utilized identifi ed the poorer neighborhoods of the city as the areas with the highest risk for the disease. These data show that health departments must prioritize politico-administrative policies to minimize the effects of social inequality and improve the standards of living, hygiene, and education of the population in order to reduce the incidence of leprosy.

(2)

Leprosy is a chronic infectious disease that affects the skin and peripheral nervous system, and may cause irreversible physical lesions. The disease is often stig-matizing to patient, as they tend to be excluded and debilitated in their social relationships and economic activities.

Attempts by the World Health Organization to eliminate this disease have been unsuccessful, and leprosy is still a global public health problem. Among countries with populations larger than one million, Brazil, Nepal and East Timor still present disease prevalences of more than 10 cases per 100,000 inhabitants. In 2008, the prevalence of leprosy in Brazil was 24.0/100,000 inhab-itants (45,847 cases in treatment) with a detection rate

of 20.5/100,000 annually (39,125 new cases detected).a

The Brazilian government’s policies to eliminate leprosy predominantly include actions to be extended to the entire primary care sector, thus promoting the decentralization of disease control activities and public

RESUMO

OBJETIVO: Identifi car áreas com maior ocorrência de casos de hanseníase e

fatores socioeconômicos e demográfi cos associados.

MÉTODOS: Casos de hanseníase ocorridos entre 1998 e 2007 em São José

do Rio Preto, SP, foram geocodifi cados e coefi cientes de incidência foram

calculados por setores censitários. Por meio da técnica de análise de componentes

principais, obteve-se um escore para classifi cação socioeconômica. O uso do

método de krigagem ordinária resultou em mapas temáticos para visualização da distribuição espacial da incidência de hanseníase, do nível socioeconômico

e da densidade demográfi ca.

RESULTADOS: Enquanto a incidência para toda a cidade foi de 10,4 casos por 100.000 habitantes por ano, entre 1998 e 2007, as incidências por setores censitários foram heterogêneas, variando de zero a 26,9 casos por 100.000 habitantes por ano. Houve concordância entre áreas com valores mais altos de incidência e menores níveis socioeconômicos. Foram identificados aglomerados de casos de hanseníase. Não foi observada associação da doença

com densidade demográfi ca. Detectou-se falta de relação entre os locais de

moradia da maioria dos doentes e a localização dos serviços de saúde.

CONCLUSÕES: As técnicas de análise espacial utilizadas permitiram

caracterizar as áreas mais defi citárias do município como as de maior risco

para hanseníase.

DESCRITORES: Hanseníase, epidemiologia. Fatores Socioeconômicos.

Sistemas de Informação Geográfi ca, utilização. Vigilância

Epidemiológica.

INTRODUCTION

a WHO Weekly epidemiological record. Geneva: WHO. 2008 [cited 2009 Sep 30]; 83(33):293-300. Available from: http://www.who.int/lep/ resources/wer8333.pdf

b Ministério da Saúde do Brasil (BR), Secretaria de Vigilância Sanitária, Departamento de Vigilância Epidemiológica, Programa Nacional de Eliminação da Hanseníase. Plano Nacional de eliminação da hanseníase em nível municipal 2006-2010, Brasília (DF); 2006.

information about the characteristics, signs, and

symp-toms of the illness.b

The decentralization and amplifi cation of medical

assis-tance to the entire healthcare network requires knowl-edge of the spatial distribution of the disease, among other factors. The expected variations in the

occur-rence of leprosy in different regions7,13 associated with

increasing rates of urbanization11 point to a need for

predicting disease incidence based on the geographic area or population characteristics. These estimates are necessary to identify possible environmental risk factors and to recognize areas of particular concern, thus allowing for a better allocation of resources and more

effective planning for available services.7

(3)

diseases and the importance of a critical analysis of

access to resources.6

Several studies have employed spatial analysis tech-niques for leprosy, including investigations of spatial dependence of average leprosy detection rates in the

state of São Paulo,14,16 the control of communicants in

a town within São Paulo,c an evaluation of the

suscep-tibility to leprosy from communicants among residents

on a small island in Indonesia,4 and the search for spatial

and spatial-temporal clusters of leprosy cases.9,10

Faced with the necessity of reorganizing disease control strategies, directing resources, consolidating recent advances, assisting in decision making, and stimulating innovative actions in the surveillance of leprosy, this study aimed to identify clusters of major occurrences of leprosy as well as the socioeconomic and demographic factors associated with the disease.

METHODS

São José do Rio Preto is located in the northwestern region of the State of São Paulo (S20º49’11” and

W49º22’46”) and has an area of 575 km2 with a

popu-lation estimated to be 419,633 in 2009. It is a regional center for 101 municipalities and is a major urban center in the region, drawing a large number of people from neighboring towns and states in search of services linked to commerce, health, and education.

This is a territory-based ecological study. Study units

were defi ned by census tracts allotted by the Brazilian

Institute of Geography and Statistics (IBGE) using data

from the census carried out in 2000.d

All new leprosy cases diagnosed from January 1st, 1998

to December 31st, 2007 in residents of the city of São

José do Rio Preto who had their addresses

geocodi-fi ed in the Leprosy Project15 database were included

in this study.

The geocodification of leprosy cases was achieved utilizing the Mapinfo computer program version 7.0 that matched the addresses of cases to locations on a street map provided by the city hall of São José do Rio Preto. The analysis and automatic standardization of addresses consisted of dividing the addresses into two parts, the street name and number of the residence. Standardization

modifi ed these components, when necessary to follow

the criteria adopted by the Brazilian Address System. A geocode for each address was obtained by linearly interpolating the number of the residence to the

corre-sponding street segment identifi ed by the range of street

numbers.20 Then, leprosy cases were grouped according

to the 432 urban census tracts using tools in the ArcGis computer program version 9.2. The incidence rate for each sector was calculated by dividing the number of cases in that sector by a population estimate from 2002 multiplied by 100,000.

Characterization of the socioeconomic level of each census tract was based on the following variables: average years of education of the breadwinner (A), average years of education of the female breadwinner (B), average income of the breadwinner (C), average income of the female breadwinner (D), percentage of illiterate people (E), percentage of illiterate women (F),

and percentage of residences with fi ve or more

inhab-itants (G). These variables were analyzed using the STATA computer program version 7.0 using principal component analysis. This statistical method produces factors that are not correlated with one another and that represent the important aspects characterized by

correlations among the variables.1 From the factors

identifi ed, one was responsible for the greatest

propor-tion of the total variapropor-tion (87%) and was chosen as the socioeconomic factor (SF). The greater its value, the better the socioeconomic level of the inhabitants in a given census tract. This factor was calculated for each sector using the following formula:

The demographic density was calculated for each census tract by dividing the population of each sector by its area using information available from the IBGE for the 2000 census.

Choropleth maps allowed the visualization of the spatial distribution of leprosy incidence rates, the socio-economic score factor, and the demographic density from the urban area of the municipality. Centroids were assumed to be geographical representations of the ecological units (census tracts). Samples of these processes were modeled in the stochastic Gaussian approach as a continuous point pattern on the physical

environment.2

Geostatistical estimation by the kriging method, also

known asgeneralized weighted least squares on general

linear modeling, was used to produce the response surfaces for thematic mapping after establishing the mathematical parameters including semivariogram,

anisotropy, distance, sill, and nugget.2 The response

surfaces were broken up into quintiles – fi ve partitions

with 20% relative frequency each – for leprosy inci-dence rate and the socioeconomic factor, and sextiles – six partitions – for demographic density.

c Mencaroni DA. Análise espacial da endemia hansênica no município de Fernandópolis, SP [doctorate thesis]. Ribeirão Preto: Universidade de São Paulo, Escola de Enfermagem de Ribeirão Preto; 2003.

(4)

The ArcGis computer program version 9.2 was used for the production of these thematic maps and for the statistical interpolation of the municipal boundaries and the delimitation of the urban area using digital cartography of the census tracts provided by IBGE. Chi-square statistical tests were used to assess the association between the leprosy incidence and socio-economic factor. Both continuous variables were transformed into categorical variables using quartiles as cutoff points.

This research project was approved by the Ethics and Research Committee at The Faculdade de Medicina de São José do Rio Preto (São José do Rio Preto Medicine School) (protocol number 120/2004).

RESULTS

Figure 1 shows that the leprosy prevalence and detec-tion rates in 2006 and 2007 were less than 10 cases per 100,000 inhabitants.

Of the 414 total cases of leprosy reported between 1998

and 2007, 398 (96%) were geocodifi ed. Of these, 379

occurred in the urban area and were included in this study. The lighter choropleth categories in Figure 2 represent areas with low incidence rates while darker categories represent areas with higher incidence rates. Although the incidence for the municipality as a whole between 1998 and 2007 was 104.1 cases per 100,000 inhabitants (that is, 10.4 cases per 100,000 per year), Figure 2 shows that the incidence rates were heteroge-neous within the urban area, with values that ranged from zero to 269.5 cases per 100,000 inhabitants (that is, 0 to 26.9 cases per 100,000 inhabitants annually). Figure 2 depicts a large cluster of leprosy cases in the northern area of the city and two smaller clusters in the extreme eastern and southeastern areas.

In the choropleth presentation of the distribution of socioeconomic factor scores (Figure 3), the darker areas characterize regions in which the population is most dependent on government assistance; in essence, these areas’ inhabitants were socially excluded in terms of the promotion of healthcare, education, nourishment, work, housing, and a healthy environment. On the other hand, the lighter areas represent clusters with higher socioeconomic levels, and thus are representative of social inclusion and the percentage of the population

that profi ts from economic production.

In Figure 4 the lighter areas represent higher population densities and the darker areas, lower densities. Figure 5 shows, among other geographic features, government and private schools, daycare facilities, government healthcare clinics, hospitals, and reference centers for leprosy in the city.

Areas with lower socioeconomic levels are located in the northern, northeastern, and southeastern areas of the city, coinciding with areas that have the highest leprosy incidence rates (Figures 2, 3). The demographic density varies in these regions; some areas are highly populated while some have a smaller number of people per square meter due to protected woodlands on the banks of the rivers that cut through the northern and northeastern regions (Figure 4).

The western region, which is characterized by the city’s main industrial park, the airport, a cemetery, and green-belt, has a moderate socioeconomic level and a medium to low demographic density. The leprosy incidence rates were intermediate, with the highest values occurring closest to the northern region (Figures 2, 3, 4). The southwestern and central regions showed high socioeconomic levels and low leprosy incidence rates, though the former also had a low demographic density

Prevalence

Prev

alence (per 100,000 inhabitants)

Detection r

ate (per 100,000 inhabitants)

20.0

1998 1999 2000 2001 2002 2003 2004 2005 2006 2007

15.0

10.0

5.0

0

16.0

12.0

8.0

4.0

0.0

Detection rate

(5)

(large houses and green areas) and the latter, a high density (high concentration of residential apartment blocks) (Figures 2, 3, 4).

The eastern region of the city is characterized by a combination of low, medium, and high socioeconomic levels and, respectively, high, intermediate, and low leprosy incidence rates (Figures 2, 3). The demographic density also varied, but without any apparent relation-ship to socioeconomic levels or leprosy cases. The areas of low demographic density in the eastern region are sparse due to the municipal reservoir, the lake that supplies water to part of the population (Figures 4, 5).

After transforming the incidence rate and the socioeco-nomic factor into categorical variables, the chi-squared test showed an association between disease and the SF

(χ2 = 180.7; p < 0.0001).

Figures 3 and 5 show that the northern, northeastern, and southeastern regions, which have low socioeco-nomic levels, have the highest number of government schools, daycare facilities, and government healthcare clinics and are close to the city trash dump. Almost all hospitals (all private) and most of the private schools and daycare facilities are located in the southwestern and central regions, regions with high socioeconomic

Leprosy incidence rates cases by 100.000 inhab

0 - 47.5 47.6 - 67.6 67.7 - 100.3 100.4 - 141.6

141.7 - 269.5

(6)

levels. The reference centers for leprosy are also located in areas with a low incidence of the disease (Figure 2) and high socioeconomic levels (Figure 3).

DISCUSSION

This study confi rms the decrease in leprosy

preva-lence and incidence and found heterogeneous leprosy incidence rates in São José do Rio Preto census tracts. Clusters of high leprosy occurrence were associated with the lowest socioeconomic level areas and it was revealed that locations where ill people live lack healthcare services. Additionally, there is no association

between leprosy incidence and demographic density. The decrease in leprosy prevalence, which was less than 10 cases per 100,000 inhabitants in 2006 and 2007, and in the detection of new cases point to a possible elimination of the disease in the city.

The possibility of the occurrence of ecological fallacy, an important consideration in ecological studies, was minimized by the use of census tracts as the units of analysis, which, according to the IBGE, are continuous areas comprising an average of 300 buildings with homogeneous demographic and socioeconomic charac-teristics. The adequacy of the socioeconomic factor as a

representation of the socioeconomic levels is confi rmed

Socieconomic factor principal component

442.8 - 835.6

835.6 - 1,195.8 1,195.8 - 1,686.8 1,686.8 - 2,799.9 2,799.9 - 8,790.9

(7)

by the greater concentrations of public schools, daycare

facilities and healthcare clinics in the areas identifi ed as

having lower socioeconomic levels. On the other hand,

areas identifi ed as having higher socioeconomic levels

possessed greater concentrations of private schools and daycare facilities, and almost all the hospitals are located in areas with higher socioeconomic levels.

The association of areas of low socioeconomic levels and high leprosy incidence rates found in this study

are in agreement with the results of Bechelli5 (1936).

Additionally, it has been reported that patients with

unfavorable social conditions have lower chances of

receiving treatmente and, in their residences’ locations,

obstacles are in place to make access to healthcare

services diffi cult.12 According to Sampaio et al17 (1987),

apart from the favorable climatic conditions in tropical

regions, other factors such as nutritional defi ciencies,

promiscuity, and low socioeconomic levels predispose individuals to leprosy.

The identification of areas with different levels of leprosy incidence and of clusters with the highest inci-dence rates provides information that can be useful to

Demographic density

0.0038 - 0.0054 0.0055 - 0.0068 0.0069 - 0.0084 0.0085 - 0.0104 0.0105 - 0.0144 0.0015 - 0.0037

Figure 4. Spatial distribution of demographic density (inhabitants per km2). São José do Rio Preto, Southeastern Brazil, 2000.

(8)

help surmount administrative challenges and facilitate decentralized assistance and monitoring with the aim of eliminating leprosy. The heterogeneous occurrence of leprosy indicates that analyses designed to determine whether the disease is being eliminated cannot be made by treating the municipality as an indivisible unit. The implementation of control measures and disease treatment are centralized in São José do Rio Preto,

which is in confl ict with the Brazilian Ministry of

Health directives.f Centralization hinders access to

treatment and is further exacerbated by the fact that the two leprosy reference centers are located in areas with high socioeconomic levels and low incidence rates of the disease. Decentralization of leprosy control measures would provide better conditions for the assistance of patients and their contacts, allowing diagnosis and treatment close to their homes, and improving acceptance, understanding, and knowledge

among the public about the disease. This may also help to reduce the stigma attached to leprosy and improve disease control.

The use of GIS and spatial analysis techniques have shown to be important tools in planning disease surveil-lance and control measures, and in evaluating and

monitoring the effectiveness of healthcare services.3,8

The features and techniques utilized in this study, apart from providing important information for plan-ning surveillance and control measures for leprosy,

identifi ed clusters at the highest risk for leprosy in the

poorest areas of the city. Investment in the schools, culture, healthcare, basic sanitation, housing, work opportunities, and leisure activities, in areas with higher incidences of leprosy can help to minimize the effects of social inequality and increase the standard of living, hygiene, and education of the population thereby

reducing the magnitude of the disease burden.18,19

f Ministério da Saúde (BR). Guia para o controle da hanseníase. Brasília (DF): Departamento de Atenção Básica, Secretaria de Políticas de Saúde; 2002.

Figure 5. Urban perimeter of São José do Rio Preto, rivers, reservoir, railway, highways, government and private schools and daycare facilities, healthcare clinics and hospitals.

Rivers Reservoir Railway Trash dump Healthcare clinics Hospitals

Private schools and daycare facilities Government shools and daycare facilities Urban perimeter

Leprosy reference centers N

(9)

1. Altman DG. Practical statistics for medical research. Boca Raton: Chapman & Hall/CRC; 1999.

2. Bailey TC, Gatrell AC. Interactive spatial data analysis. Harlow: Longman; 1995.

3. Bailey TC. Spatial statistical methods in health. Cad Saude Publica. 2001;17(5):1083-98. DOI:10.1590/ S0102-311X2001000500009

4. Bakker MI, Hatta M, Kwenang A, Van Mosseveld P, Faber WR, Klatser PR, et al. Risk factors for developing leprosy: a population-based cohort study in Indonesia.

Lepr Rev. 2006;77(1): 48-61.

5. Bechelli LM. O tempo de incubação da lepra. Rev Bras Leprol. 1936;4(Esp):355-60.

6. Carvalho MS, Souza-Santos R. Análise de dados espaciais em saúde pública: métodos, problemas, perspectivas. Cad Saude Publica. 2005;21(2):361-78. DOI:10.1590/S0102-311X2005000200002

7. Dias MCFS, Dias GH, Nobre ML. Distribuição espacial da hanseníase no município de Mossoró/ RN, utilizando o Sistema de Informação Geográfi ca - SIG. An Bras Dermatol. 2005;80(Supl 3):S289-94. DOI:10.1590/S0365-05962005001000005

8. Elliott P, Wartenberg D. Spatial epidemiology: current approaches and future challenges. Environ Health Perspect. 2004;112(9):998-1006. DOI:10.1289/ ehp.6735

9. Fisher EAJ, Pahan D, Chowdhury SK, Oskam L, Richardus JH. The spatial distribution of leprosy in four villages in Bangladesh: an observational study.

BMC Infect Dis. 2008; 8(1):125. DOI:10.1186/1471-2334-8-125

10. Fisher EAJ, Pahan D, Chowdhury SK, Richardus JH. The spatial distribuition of leprosy cases during 15 years of a leprosy control program in Bangladesh: an observational study. BMC Infect Dis. 2008;8(1):126. DOI:10.1186/1471-2334-8-126

11. Lapa T, Ximenes R, Silva NN, Souza W, Albuquerque MFM, Campozana G. Vigilância da hanseníase em Olinda, Brasil, utilizando técnicas de análise

espacial. Cad Saude Publica. 2001;17(5):1153-62. DOI:10.1590/S0102-311X2001000500015

12. Lovett TA, Haynes R, Sünnenberg G, Gale S. Car travel time and accessibility by bus to general practitioner services: a study using patient registers and GIS. Soc Sci Med. 2002;55(1):97-111. DOI:10.1016/S0277-9536(01)00212-X

13. Montenegro ACD, Werneck GL, Kerr-Pontes LRS, Barreto ML, Feldemeier H. Spatial analysis of the distribution of leprosy in the state of Ceará, Northeast Brazil. MemInst Oswaldo Cruz. 2004;99(7):683-6. DOI:10.1590/S0074-02762004000700003 14. Opromolla PA, Dalben I, Cardim M. Análise da

distribuição espacial da hanseníase no Estado de São Paulo 1991-2002. Rev Bras Epidemiol. 2005;8(4):356-64. DOI:10.1590/S1415-790X2005000400001 15. Paschoal VDA, Nardi SMT, Cury MRCO, Lombardi

C, Virmond MCL, Silva RMDN, et al. Criação de banco de dados para sustentação da pós-eliminação em hanseníase. Cienc Saude Coletiva. 2011;16(Supl 1):1201-10. DOI:10.1590/S1413-81232011000700052 16. Rodrigues-Júnior AL, do Ó VT, Motti VG. Spatial

and temporal study of leprosy in the State of São Paulo (Southern Brazil), 2004-2006. Rev Saude Publica. 2008;42(6):1012-20. DOI:10.1590/S0034-89102008000600006

17. Sampaio SAP, Castro RM, Rivitti EA. Dermatologia básica. 3.ed. São Paulo: Artes Médicas; 1987. 18. Veronesi R, editor. Doenças infecciosas e parasitárias.

8.ed. Rio de Janeiro: Guanabara Koogan; 1991. 19. Virmond M. Papel das instituições de pesquisa e

ensino em hanseníase no controle e prevenção de incapacidade e reabilitação. Hansen Int.

1999;24(1);32-7.

20. Zimmerman DL, Fang X, Mazundar S, Rushton G. Modeling the probability distribution of positional errors incurred by residential address geocoding. Int J Health Geogr. 2007;6(1):1-16. DOI:10.1186/1476-072X-6-1

REFERENCES

Imagem

Figure 1 shows that the leprosy prevalence and detec- detec-tion rates in 2006 and 2007 were less than 10 cases per  100,000 inhabitants.
Figure 2. Spatial distribution of leprosy incidence rates (per 100,000 inhabitants) in the urban area
Figure 3. Spatial distribution of the socioeconomic factor. São José do Rio Preto, Southeastern Brazil, 2000.
Figure 4. Spatial distribution of demographic density (inhabitants per km 2 ). São José do Rio Preto, Southeastern Brazil, 2000.
+2

Referências

Documentos relacionados

Efeito da temperatura (260C e 360C) e da dexametasona na diferenciação sexual A experiência decorreu nas condições experimentais descritas anteriormente. Os ovos provinham de

The composition of dichloromethane, ethanol and water extractives of the heat treated pine wood samples that were analysed corresponded to treatments at 190ºC during 2, 6 and 12 h

Anopheles were observed in two areas with different levels of human settlement in the Cantá city, Roraima State, Northern Brazil.. The influence of the dry and rainy seasons

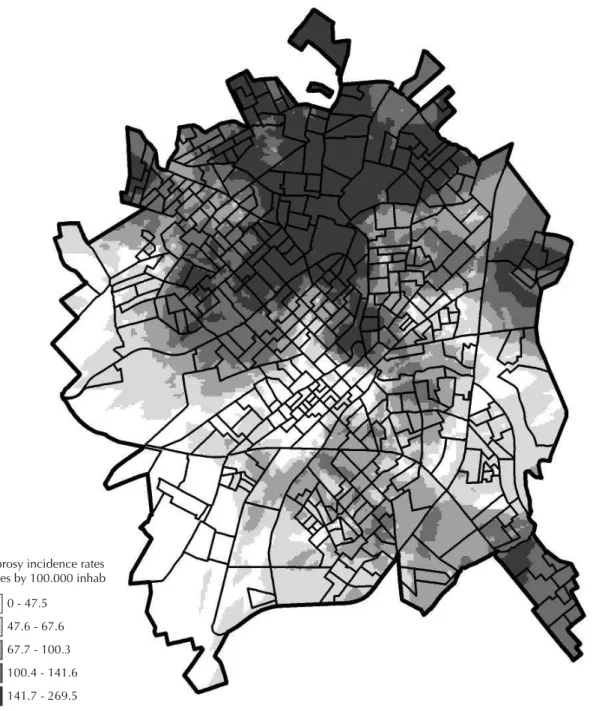
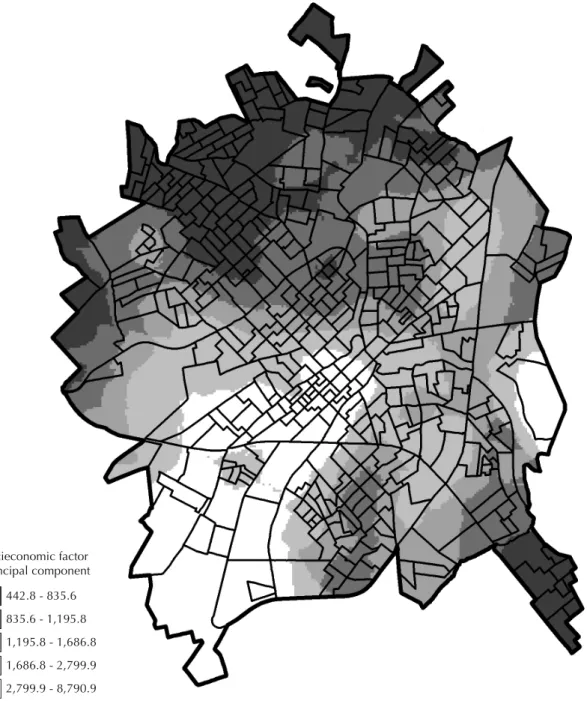
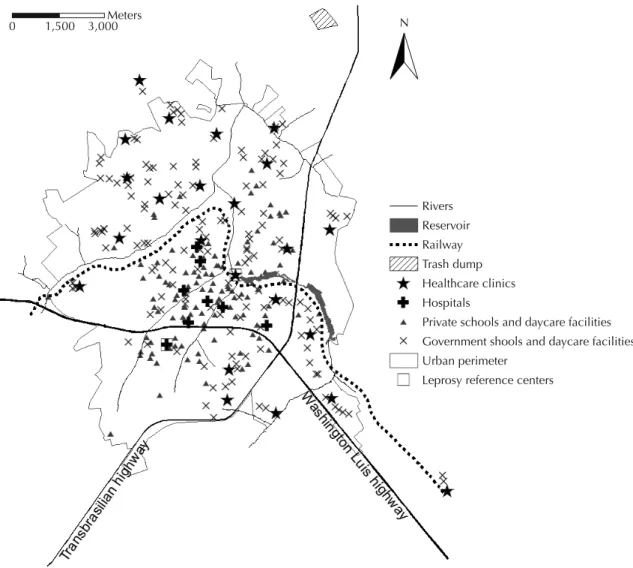
The ACCS with high relative risk and with excess risk in the northern part of the city are also areas with precarious urban infrastructure and located next to the municipality

pessoas julgam que, se tomarem pais dessa maneira, poderá infiltrar-se nelas algo de mau que receiam: por exemplo um traço dos pais, uma deficiência ou uma

Distribuição Reservatório Captação Estação de Tratamento de Água Adutora de água tratada Adutora de água bruta Estação elevatória de água bruta Curso de água

We hypothesized that this depth would provide a minimum temperature range with almost constant temperatures, conducive to the development of the symbiotic fungus and the brood yet

Em um movimento de revisionismo histórico, alguns autores consideram o programa de anemia falciforme estadunidense como um passo no aprendizado ético para programas de