Djacyr Magna Cabral FreireI,II Jose Guilherme CecattiI
Cláudio Sergio Medeiros PaivaII
I Departamento de Tocoginecologia. Faculdade de Ciências Médicas. Universidade Estadual de Campinas. Campinas, SP, Brasil
II Universidade Federal da Paraíba. João Pessoa, PB, Brasil Correspondence: Jose Guilherme Cecatti Unicamp
R. Alexander Fleming, 101 Cidade Universitária
13083-881 Campinas, SP, Brasil E-mail: [email protected] Received: 9/30/2009 Approved: 4/15/2010
Article available from: www.scielo.br/rsp
Symphysis-fundal height curve
in the diagnosis of fetal growth
deviations
Curva de altura uterina por idade
gestacional e diagnóstico de desvios
do crescimento fetal
ABSTRACT
OBJECTIVE: To validate a new symphysis-fundal curve for screening fetal growth deviations and to compare its performance with the standard curve adopted by the Brazilian Ministry of Health.
METHODS: Observational study including a total of 753 low-risk pregnant women with gestational age above 27 weeks between March to October 2006 in the city of João Pessoa, Northeastern Brazil. Symphisys-fundal was measured using a standard technique recommended by the Brazilian Ministry of Health. Estimated fetal weight assessed through ultrasound using the Brazilian fetal weight chart for gestational age was the gold standard. A subsample of 122 women with neonatal weight measurements was taken up to seven days after estimated fetal weight measurements and symphisys-fundal classifi cation was compared with Lubchenco growth reference curve as gold standard. Sensitivity, specifi city, positive and negative predictive values were calculated. The McNemar χ2 test was used for comparing sensitivity of both symphisys-fundal curves studied.
RESULTS: The sensitivity of the new curve for detecting small for gestational age fetuses was 51.6% while that of the Brazilian Ministry of Health reference curve was signifi cantly lower (12.5%). In the subsample using neonatal weight as gold standard, the sensitivity of the new reference curve was 85.7% while that of the Brazilian Ministry of Health was 42.9% for detecting small for gestational age.
CONCLUSIONS: The diagnostic performance of the new curve for detecting small for gestational age fetuses was signifi cantly higher than that of the Brazilian Ministry of Health reference curve.
Serial measurement of symphysis-fundal height (SFH) during pregnancy is a major clinical tool to evaluate fetal growth as well as to identify other pregnancy complications.a It is an easy-to-use low-cost tool, although it has not been widely confi rmed as a reliable measurement in the prenatal care routine. Belizan et al4 showed these serial measurements greatly improve the predictive capacity of detecting fetal growth abnormali-ties. The Brazilian Ministry of Health (BMoH) recom-mends the use of a standard SFH curve developed by Fescina et al.9 Normal uterine growth is within the 10th and the 90th percentiles.b However, studies have reported different SFH patterns for Brazilian populations,10,18,21 and these differences could be explained not only by specifi c characteristics of ethnic groups but also by other factors such as different measurement techniques, risk level, socioeconomic and nutritional conditions, gestational age estimates and number of examiners.
RESUMO
OBJETIVO: Validar curva de referência de altura uterina por idade gestacional para o rastreamento de desvios do crescimento fetal e comparar sua performance com a curva-padrão adotada pelo Ministério da Saúde do Brasil.
MÉTODOS:Estudo observacional que envolveu 753 gestantes de baixo risco de João Pessoa, PB, entre março e outubro de 2006, com idade gestacional acima de 27 semanas. A altura uterina foi medida de acordo com técnica preconizada pelo Ministério da Saúde. O padrão-ouro foi o peso fetal, estimado pelo ultrassom com base na curva de referência brasileira por idade gestacional. Uma subamostra de 122 casos com pesos neonatais obtidos até sete dias depois da estimativa do peso fetal, a classifi cação da altura uterina foi comparada com a curva de Lubchenco como padrão-ouro. A sensibilidade, a especifi cidade e os valores preditivos positivo e negativo foram calculados. Para comparar o desempenho da sensibilidade entre ambas as curvas de altura uterina, utilizou-se o teste χ2 de McNemar.
RESULTADOS: A sensibilidade da nova curva para a detecção de fetos pequenos para a idade gestacional foi de 51,6%, enquanto a da curva do padrão-ouro foi signifi cativamente menor (12,5%). Na subamostra que teve o peso neonatal como padrão-ouro, a sensibilidade da nova curva de referência foi de 85,7%, enquanto a do Ministério da Saúde exibiu 42,9% de sensibilidade para a detecção de fetos pequenos para a idade gestacional.
CONCLUSÕES: A capacidade diagnóstica da nova curva de referência para detectar fetos pequenos para a idade gestacional foi signifi cativamente melhor do que a da curva recomendada pelo Ministério da Saúde.
DESCRITORES: Desenvolvimento Embrionário e Fetal. Útero, crescimento & desenvolvimento. Idade Gestacional. Ultrassonografi a Pré-Natal. Diagnóstico Pré-Natal. Estudos de Validação.
INTRODUCTION
a Ministério da Saúde. Pré-natal e puerpério: atenção qualifi cada e humanizada: manual Técnico. 2.ed. Brasília, DF; 2006. b National Collaborating Center for Women’s and Children’s Health. Antenatal care: routine care for the healthy pregnant woman. Clinical Guideline. 2.ed. London: RCOG Press; 2009 [cited 2009 Sep 9]. Available from: http://www.nice.org.uk/nicemedia/pdf/ CG62FullGuidelineCorrected June2008July2009.pdf
always available. Although SFH curves are usually used to screen fetal growth restriction, there are concerns about their performance.
Freire et al10 have demonstrated that the UH growth curve developed with low risk pregnant women from Joao Pessoa (Northeastern Brazil), differs signifi cantly from that adopted by the BMoH9 as the standard for the Brazilian population.
Differences between both curves, the one from Freire et al10 and that from Fescina et al9 used by the BMoH, raise the hypothesis that they perform differently when identifying normal fetal growth and any deviations. Therefore, since one of the main applications of SFH measurements in prenatal care is for screening fetal growthdeviations,a the standard curve may not be effec-tive enough for this purpose, over or under diagnosing those conditions because it is based in a sample of women with a pattern of fetal growth different from that of the Brazilian population. The objective of the present study was to validate the SFH growth curve as a standard method for the screening of fetal growth devia-tions and to compare its performance with the pattern curve adopted by the Brazilian Ministry of Health.
METHODS
The validation of a SFH reference curve for gestational age was based on a curve developed by Freire et al.10 The present study was carried out in a university hospital and a public maternity hospital in the city of João Pessoa, Northeastern Brazil, from March to October 2006. These hospitals were selected as they are reference centers of prenatal care in the public health service and they have higher demand of pregnant women. Eligibility of preg-nant women was assessed in the ultrasound department of these hospitals. The sample size was calculated based on an estimated prevalence of 12% intra-uterine growth restriction in this population.a An 80% sensitivity for SFH measurements was assumed for detection of actual fetal growth restriction in the sample, with a sampling error of 9.2% and type I error of 0.05. The estimated sample size was 750 pregnant women. A sample of 753 pregnant women was selected according to free demand for each prenatal service.
The inclusion criteria included gestational age above 26 weeks, with a known last menstrual period or confi rmed by ultrasound during the fi rst half of pregnancy. Women who were pregnant with twins, fetal death or any fetal malformations that prevented the assessment of fetal weight and the amniotic fl uid index by ultrasound were excluded. The following variables were studied: SFH, gestational age, ultrasound-derived estimated fetal weight (EFW), and fetal growth deviation (categorized by gestational age in small – lower than the 10th percen-tile; large – higher than the 90th percentile; and adequate
– between the 10th and the 90th percentiles). Data was also collected for the following control variables: age; body mass index (BMI, classifi ed by reference values for each gestational age according to Atalah et al1 as recommended by the BMoH); ethnic group/skin color; number of pregnancies; parity; previous caesarean sections; previous abortions and smoking habits.
SFH was measured with a fl exible inelastic measuring tape from the pubic symphysis to the uterine fundus after correction of uterine dextrorotation, following the standard technique as recommended by the BMoH.10,a Fetal weight was estimated by ultrasound using Hadlock et al formula13 as described elsewhere.5 The gold standard for classifying EFW was adapted from the curve developed by Cecatti et al5 with normal EFW percentiles established by ultrasound according to gestational age in a Brazilian population using third degree polynomial adjustments. We opted for this method due to high linear correlation previously found between EFW and neonatal weight.6
SFH measurements were taken in pregnant women attending prenatal care visits for routine ultrasound examination. Data was recorded in standard forms by the examiner. Ultrasound scans were performed with GE® Voluson 730 PRO and GE® Logic 500 equipment, both with multifrequency (2.5–5.0 MHz) convex probes.
For statistical analysis, SFH and EFW values for each pregnant woman in the study were plotted on their related charts as a function of gestational age and were compared to related standards. To validate Freire et al SFH growth curve,10 sensitivity, specifi city, positive and negative predictive values were calculated for screening fetal growth deviation. The gold standard for diag-nosing SGA and large for gestational age (LGA) fetuses was the classifi cation of fetal weight using ultrasound-derived EFW reference curve developed by Cecatti et al.5 The same procedure was then performed with the BMoH SFH curve. For the comparison of sensitivity, the McNemar’s χ2 test was used for non-independent samples with Yates’ correction.
In a subsample of 122 women SFH measurements were taken up to seven days before delivery. Additionally, SFH classifi cation was compared with neonatal weight classifi cation based on Lubchenco et al’s curve17 as the gold standard. SFH sensitivity for the diagnosis of fetal growth deviations was also compared with that of the BMoH standard SFH curve. A level of signifi cance of 5% was set. For statistic analysis EpiInfo 2000 and Excel™ software were used.
RESULTS
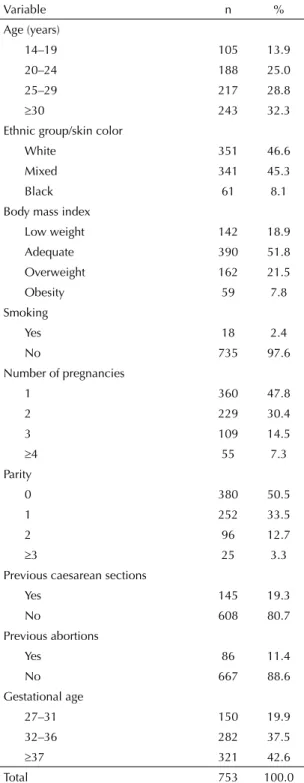
The age of the 753 women studied ranged between 13 and 45 years old, with mean age of 26.5. The predomi-nant ethnic group/skin color was white (46.6%); BMI ranged between 18.9 kg/m2 and 37.8 kg/m2 with mean BMI of 27 kg/m2. Most of them did not smoke (97.6%). Table 1 shows that 47.5% were primigravida, 50% had never had a delivery and 17.2% had previous cesarean sections. Gestational age ranged between 29 and 41 weeks, and most were over 32 weeks of pregnancy.
Figure 1 shows the distribution of SFH measurements against the 10th percentile and the 90th percentile in Freire et al SFH curve.10 The majority of cases were considered adequate (64.3%) and 10.5% were SGA. Compared to Cecatti et al curve,5 the proportion of adequate growth increased (70.1%) while the propor-tion of SGA (8.5%) and LGA (21.4%) decreased.
The sensitivity of SFH curve for the diagnosis of SGA and LGA, using the ultrasound-derived EFW curve as gold standard, is outlined in Table 2. Table 3 shows the sensitivity of SFH curve for the diagnosis of SGA and LGA using the neonatal weight curve as gold standard. The sensitivity of Freire et al11 curve for detecting SGA was 51.6% while that of the BMoH curve was only 12.5%, a statistically signifi cant difference. When using actual neonatal weight, the sensitivity of the SFH curve was also higher for detecting SGA (85.7%) than that of the BMoH curve (42.9%).
DISCUSSION
This study validated the SFH curve developed by Freire et al10 and compared its performance with that of the BMoH curvea in a population of pregnant women under conditions similar to those seen in public health facilities in Brazil. This sample characteristic may be attributed to BMI distribution in the population as a signifi cant association between BMI and SFH measurement was seen (data not shown). Almost half of pregnant women with fetal growth lying above the 90th percentile was classifi ed as overweight or obese,a higher proportion than those below the 90th percentile in the SFH curve (23.1%) (p<0.0001; data not shown). The BMI in the sample seems to refl ect the behavior of ultrasound-derived EFW, which showed 8.5% of SGA and 21.4% of LGA. BMI was also signifi cantly associated with EFW (p<0.001; data not shown) as the proportion of overweight or obese pregnant women was signifi cantly higher in the LGA (41.0%) than in the non-LGA group (25.7%). This may explain the high prevalence of LGA in the sample, as well as refl ect the so-called “obesity epidemics” as currently described in Western societies.
In general, studies on fetal growth curves among Brazilian women19 use Hadlock et al curve13 as a
reference. However, a fetal growth curve created from a specifi c Brazilian population would be more appropriate, so the present study used the EFW curve, which was developed based on a sample of Brazilian women5,6 to assess SFH for diagnosing SGA and LGA. There is a wide variation in the performance of SFH measurements as a method for screening fetal growth
Table 1. Percentage distribution of pregnant women according
to demographic and obstetric characteristics. João Pessoa, Northeastern Brazil, 2006.
Variable n %
Age (years)
14–19 105 13.9
20–24 188 25.0
25–29 217 28.8
≥30 243 32.3
Ethnic group/skin color
White 351 46.6
Mixed 341 45.3
Black 61 8.1
Body mass index
Low weight 142 18.9
Adequate 390 51.8
Overweight 162 21.5
Obesity 59 7.8
Smoking
Yes 18 2.4
No 735 97.6
Number of pregnancies
1 360 47.8
2 229 30.4
3 109 14.5
≥4 55 7.3
Parity
0 380 50.5
1 252 33.5
2 96 12.7
≥3 25 3.3
Previous caesarean sections
Yes 145 19.3
No 608 80.7
Previous abortions
Yes 86 11.4
No 667 88.6
Gestational age
27–31 150 19.9
32–36 282 37.5
≥37 321 42.6
deviation, especially when detecting SGA fetuses. It seems that the variation in the diagnostic performance between SFH reference curves is infl uenced not only by sociodemographic characteristics, but also by different methods used in the studies, the standardization of the technique used to measure SFH, the population under study (high- and low-risk pregnant women), and criteria used to defi ne fetal growth restriction.
Belizan et al4fi rst reported 86% sensitivity and 90% specifi city with 10% false positives, and concluded
that SFH measurements can be used in the prenatal care to screen for fetal growth restrictions. Ghate et al12 assessed the performance of the SFH curve in predicting low-weight newborns and they found 87.5% sensitivity, 90% specifi city and a positive predictive value of 77.8%. In the present study, the sensitivity of 51.6% of SFH in detecting SGA using EFW as gold standard is adequate to recommend its use for screening fetal growth deviation during prenatal care. The sensitivity of 85.7% of the SFH in detecting SGA in newborns of
Table 2. Performance of the symphysis-fundal height curve for the diagnosis of small for gestational age and large for gestational
age (n=753) with the ultrasound-derived estimated fetal weight curve as gold standard and comparison with the symphysis-fundal height curve of the Brazilian Ministry of Health. João Pessoa, Northeastern Brazil, 2006.
Symphysis-fundal height Ultrasound-derived estimated fetal weight
SGA No-SGA
SGA 33 46
No-SGA 31 643
Total 64 689
LGA No-LGA
LGA 91 99
No-LGA 70 493
Total 161 592
Performance SGA LGA
SFH curve(%) BMoH curve (%) SFH curve (%) BMoH curve (%)
Sensitivity 51.6 * 12.5 * 56.5 84.5
Specifi city 93.3 98.4 84.3 52.9
Positive predictive value 41.8 42.1 47.9 32.8
Negative predictive value 95.4 92.4 87.6 92.6
(*) signifi cant difference; McNemar’s χ² with Yates’ correction = 23.04; p<0.0001
SGA: small gestational age; LGA: large gestational age; SFH: symphysis-fundal height; BMoH: Brazilian Ministry of Health
Table 3. Performance of the symphysis-fundal height curve for the diagnosis of small for gestational age and large for gestational
age (n=122) with the neonatal weight curve as the gold standard and comparison with the symphysis-fundal height curve of the Brazilian Ministry of Health. João Pessoa, Northeastern Brazil, 2006.
Symphysis-fundal height Neonatal Weight
SGA No-SGA
SGA 12 7
No-SGA 2 101
Total 14 108
LGA No-LGA
LGA 8 20
No-LGA 10 84
Total 18 104
Performance SGA LGA
SFH curve (%) BMoH curve (%) SFH curve (%) BMoH curve (%)
Sensitivity 85.7 42.9 44.4 88.9
Specifi city 93.5 99.1 80.8 51.0
Positive predictive value 63.2 85.7 28.6 23.9
Negative predictive value 98.1 93.0 89.4 96.4
this study supports this recommendation as it shows a higher performance than that of the BMoH standard curve. Villar & Belizan23 and Engstrom & Sittler8 studies also indicated that SFH is an important and helpful measurement in the clinical diagnosis, not only in the screening of fetal growth deviation, but also to identify complications during pregnancy and errors in estimating gestational age. The charts may help identify low weight fetuses and allow appropriate interventions during prenatal care.
Fescina et al9 reported 50% sensitivity and 93%
speci-fi city and concluded that SFH measurement is an excel-lent method to identify fetuses with adequate weight for gestational age. This curve was accepted as a reference
standard for Latin America and the Caribbean in 1984, and later by the BMoH.a Since high sensitivity is a key characteristic of a good screening method, the use of this curve currently recommended by the BMoH in Brazil may be, at least, questionable. Even though a sensitivity of 51.6% is lower than that desired for an excellent screening method, Freire et al’s curve10 has performed better than the BMoH curve in the clinical practice context. Other Brazilian studies also showed better performance of other curves19,21 in comparison to that of the BMoH curve, supporting the recommenda-tion to validate curves directly derived from Brazilian populations. Maybe these curves would be more appro-priate in Brazil, improving the probability of screening fetal growth deviations when used as a diagnostic 20
25 30 35 40 45
20 25 30 35 40 45
SFH (cm)
P10 P90
10.5% 25.2%
64.3%
GA (weeks)
Figure 1. Distribution of 753 symphysis-fundal height measurements for the 10th percentile and the 90th percentile of Freire’s
curve. João Pessoa, northeastern Brazil, 2006.
Figure 2. Distribution of 753 estimated fetal weight measurements for the 10th percentile and the 90th percentile of Cecatti et
al. curve. João Pessoa, Northeastern Brazil, 2006. EFW: estimated fetal weight; GA: gestational age
EFW(g)
0 500 1000 1500 2000 2500 3000 3500 4000 4500 5000
26 28 30 32 34 36 38 40 42
GA (weeks) P90
P10 21.4%
70.1%
resource in prenatal care. Ideally, all measurements of these different studies could be pooled in a common Brazilian reference SFH curve.
According to Freire et al,10 the SFH growth curve of pregnant women from public hospitals in the city of João Pessoa signifi cantly differs from the standard curve recommended by the BMoH.9 Some other studies have investigated curves developed from a Brazilian population of pregnant women, however these curves differ methodologically from the present curve, espe-cially in the SFH measurement technique and variation between examiners.18
Although Neilson20 claimed there is a lack of evidence indicating any real benefi t of using SFH measurement in prenatal care, many countries have prenatal care protocols recommending its use along with refer-ence curves designed for the population of interest.b Despite technological improvements, the real benefi t of obstetric ultrasound, when used in the clinical routine as a screening method for fetal growth restric-tion in low-risk popularestric-tions, is not yet supported by strong scientifi c evidence.2,14 Considering that even in developed countries it is estimated that approximately 50% of SGA fetuses are only identifi ed at birth or death, and that this number is likely to be higher in developing countries, it is reasonable to accept the use of a low-cost method like the SFH measurement, even without excellent sensitivity. In a recent study Lindqvist & Molin16 showed that SGA fetuses that were not diagnosed during prenatal care have a four times greater risk of developing unfavorable outcomes than those diagnosed during prenatal care. This data
emphasizes the need for assessing feasible screening methods that are appropriate to the reality of mother-infant health care.
One of the limitations of the present study is that we could not correlate neonatal outcome in the entire sample as only 122 cases (16.2%) had neonatal weight determined up to seven days after SFH and EFW measurements. However, a high linear correlation between EFW and neonatal weight (r = 0.94) was found in this subsample, which was considered to be more than enough to ascertain a strong association.11 Therefore, this fi nding supported the classifi cation of EFW as the gold standard to diagnose fetal growth deviation in this study. Another limitation is regarding its cross-sectional design. As each pregnant woman had her SFH measurement assessed only once, it was not possible to evaluate the individual standard of SFH growth. Hypothetically, some undetected cases of SGA (false negatives) could have a reduction of SFH between two consecutive measurements. This hypothesis is consistent with new conceptual aspects of fetal growth restriction, which consider detecting a reduction in fetal weight a more important diagnostic criterion than the use of predetermined percentiles in fetal weight curves.3,7,22
1. Atalah E, Castillo C, Castro R, Aldea A. Propuesta de un nuevo estándar de evaluación nutricional en
embarazadas. Rev Med Chil. 1997;125(12):1429-36.
2. Bais JM, Eskes M, Pel M, Bonsel GJ, Bleker OP. Effectiveness of detection of intrauterine growth retardation by abdominal palpation as screening test
in a low risk population: an observational study. Eur
J Obstet Gynecol Reprod Biol. 2004;116(2):164-9. DOI:10.1016/j.ejogrb.2004.01.037
3. Baschat AA, Hecher K. Fetal growth restriction due to
placental disease. Semin Perinatol. 2004;28(1):67-80.
DOI:10.1053/j.semperi.2003.10.014
4. Belizán JM, Villar J, Nardin JC, Malamud J, De Vicurna LS. Diagnosis of intrauterine growth retardation by a simple clinical method: measurement of uterine
height. Am J Obstet Gynecol. 1978;131(6):643-6.
5. Cecatti JG, Machado MRM, Santos FFA, Marussi EF. Curva dos valores normais de peso fetal estimado por
ultra-sonografi a segundo a idade gestacional. Cad
Saude Publica. 2000;16(4):1083-90. DOI:10.1590/ S0102-311X2000000400026
6. Cecatti JG, Machado MRM, Krupa FG, Figueiredo PG, Pires HMB. Validação da curva normal de peso fetal estimado pela ultra-sonografi a para o
diagnóstico do peso neonatal. Rev Bras Ginecol
Obstet. 2003;25(1):35-40. DOI:10.1590/S0100-72032003000100006
7. Cetin I, Foidart JM, Miozzo M, Raun T, Jansson T, Tsatsaris V, et al. Fetal growth restriction: a workshop
report. Placenta. 2004;25(8-9):753-7. DOI:10.1016/j.
placenta.2004.02.004
8. Engstron JL, Sittler CP. Fundal height measurement. Part 5:The effect of clinician bias on fundal height
measurement. J Nurse Midwif. 1994;39(3):130-41.
DOI:10.1016/0091-2182(94)90095-7
9. Fescina RH, Quevedo C, Martell M, Nieto F, Schwarcz R. Altura uterina como método para
predecir el crecimiento fetal. Bol Ofi cina Sanit Panam.
1984;96(5):377-86.
10. Freire DMC, Paiva CSM, Coelho EAC, Cecatti JG. Curva da altura uterina por idade gestacional
em gestantes de baixo risco. Rev Bras Ginecol
Obstet. 2006;28(1):3-9. DOI:10.1590/S0100-72032006000100002
11. Freire DMC, Cecatti JG, Paiva CSM. Correlação entre peso fetal estimado por ultrassonografi a e peso
neonatal. Rev Brasil Ginecol Obstet. 2010;32(1):4-10.
DOI:10.1590/S0100-72032010000100002
12. Ghate M, Pratinidhi A, Gupte A. Risk prediction charts
for low birth weight. Indian Pediatr. 1996;33(1):15-8.
13. Hadlock FP, Harrist RB, Martinez-Poyer J. In utero analysis of fetal growth: a sonographic weight
standard. Radiology. 1991;181(1):129-33.
14. Jahn A, Razum O, Berle P. Routine screening for intrauterine growth retardation in Germany: Low sensitivity and questionable benefi t for diagnosed
cases. Acta Obstet Gynecol Scand. 1998;77(6):643-8.
DOI:10.1034/j.1600-0412.1998.770611.x
15. Kayem G, Grangé G, Bréart G, Goffi net F. Comparison of fundal height measurement and sonographically measured fetal abdominal circumference in the prediction of high and low birth weight at term.
Ultrasound Obstet Gynecol. 2009; 34(5):566-71. DOI:10.1002/uog.6378
16. Lindqvist PG, Molin J. Does antenatal identifi cation of small-for-gestational age fetuses signifi cantly
improve their outcome? Ultrasound Obstet Gynecol.
2005;25(3):258-64. DOI:10.1002/uog.1806
17. Lubchenco LO, Hansman C, Byd E, Dressler M. Intrauterine growth as estimated from liveborn birth
weight data at 24 to 42 weeks of gestation. Pediatrics.
1963;32:793-800.
18. Martinelli S, Bittar RE, Zugaib M. Proposta de nova curva de altura uterina para gestações
entre a 20a e a 42a semana.. Rev Bras Ginecol
Obstet. 2001;23(4):235-41. DOI:10.1590/S0100-72032001000400006
19. Martinelli S, Bittar RE, Zugaib M. Predição da restrição do crescimento fetal pela medida da altura uterina.
Rev Bras Ginecol Obstet. 2004;26(5):383-9. DOI: 10.1590/S0100-72032004000500007
20. Neilson JP. Symphysis-fundal height measurement
in pregnancy. Cochrane Database Syst Rev.
2000;(2):CD000944
21. Oppermann MLR, Duncan BB, Mengue SS, Ramos JGL, Serruya SJ, Schmidt MI. Distribuição da altura uterina ao longo da gestação em uma coorte brasileira: comparação com a curva de referência do Centro
Latino-Americano de Perinatologia. Rev Bras Ginecol
Obstet. 2006;28(9):513-22.
DOI:10.1590/S0100-72032006000900003
22. Owen P, Farrell T, Hardwick JC, Khan KS. Relationship between customised birth weight centiles and neonatal
anthropometric features of growth restriction. BJOG.
2002;109(6):658-62.
23. Villar J, Belizan JM. The evolution of the methods used in the diagnosis of intrauterine growth retardation.
Obstet Gynecol Survey. 1986;41(4):187-99. DOI:10.1097/00006254-198604000-00001
REFERENCES