Alex Antonio FlorindoI,II Pedro Curi HallalIII Erly Catarina de MouraII,IV Deborah Carvalho MaltaIV,V
I Escola de Artes, Ciências e Humanidades. Universidade de São Paulo (USP). São Paulo, SP, Brasil
II Núcleo de Pesquisas Epidemiológicas em Nutrição e Saúde. USP. São Paulo, SP, Brasil III Departamento de Ginástica e Saúde. Escola Superior de Educação Física. Universidade Federal de Pelotas. Pelotas, RS, Brasil IV Coordenação Geral de Doenças Crônicas
não Transmissíveis. Secretaria de Vigilância em Saúde. Ministério da Saúde, Brasília, DF, Brasil
V Departamento de Enfermagem Materno-Infantil e Saúde Pública. Escola de Enfermagem. Universidade Federal de Minas Gerais. Belo Horizonte, MG, Brasil Correspondence:
Alex Antonio Florindo
Escola de Artes, Ciências e Humanidades Universidade de São Paulo
R. Arlindo Béttio, 1.000 03828-000 São Paulo, SP, Brasil E-mail: afl [email protected] Received: 11/28/2008 Revised: 8/6/2009 Approved: 8/19/2009
Practice of physical activities
and associated factors in adults,
Brazil, 2006
ABSTRACT
OBJECTIVE: To estimate the prevalence of physical activity practice in adults and its association with sociodemographic and environmental factors.
METHODS: Data from the Sistema de Vigilância de Fatores de Risco e Proteção para Doenças Crônicas por Inquérito Telefônico (VIGITEL – Telephone-based Surveillance of Risk and Protective Factors for Chronic Diseases) were collected in 2006. All the 54,369 adults interviewed lived in households with a fi xed telephone line, in the Brazilian state capitals and Federal District. Physical activity practice was considered in the leisure-time, occupational, transportation and household domains. Variables studied included sociodemographic characteristics of individuals and environmental characteristics of cities. Association with physical activities was analyzed according to sex.
RESULTS: Proportions of active individuals were 14.8% for leisure time, 38.2% for occupation, 11.7% for transportation, and 48.5% for household chores. Indices above 60% of inactive individuals in the leisure-time domain were observed in ten capitals. Men were more active than women in all domains, except for household chores. The proportion of active individuals decreased with age. Level of education was directly associated with physical activity in leisure time. Active men in the transportation domain were more likely to be active in their leisure time, while inactive people in the occupational domain were more likely to be active in their leisure time. The existence of places to perform physical activities near the home was associated with physical activity in leisure time.
CONCLUSIONS: Results obtained are important to monitor physical activity levels in Brazil. Differences between men and women and those in age groups and levels of education must be considered to promote physical activities. Promotion of physical activities in the leisure and transportation domains and in places that are adequate for physical activity practice and near the home should be encouraged.
The new paradigms of relationships between physical activities and health show that the assessment practices in the leisure-time, occupational, transportation and household domains is fundamental. Pate et al (1995)18
summed up the strength of all the evidence published in the last 50 years and showed the importance of the practice of physical activities in these four domains to prevent diseases and improve people’s quality of life.
The practice of physical activities according to domains is little studied. Leisure is the most frequently studied domain, with higher frequency in epidemiological surveys, both in high-income countries1,3,5,12,13,17 and
middle- or low-income ones.2,11,14,19,22,23 However, other
types of physical activities, in addition to leisure-time ones, are important, especially in middle- and low-in-come countries, due to certain social characteristics.10
The aim of the present study was to describe the prac-tice of physical activities of adults in the leisure-time, occupational, transportation and household domains and its association with sociodemographic and envi-ronmental factors.
METHODS
Cross-sectional study using data collected from the Telephone-based Surveillance of Risk and Protective Factors of Chronic Diseases (VIGITEL),16
imple-mented in 2006 by the Ministry of Health. VIGITEL included the assessment of four domains in all Brazil-ian state capitals and the Federal District.
A total of 54,369 interviews were conducted by VIGI-TEL with adults (≥18 years) living in households with a
fi xed telephone line, in 26 state capitals and the Federal District, in 2006. The probability sample used in this study was based on records from fi xed telephone com-panies (minimum of two thousand adults per city).16
VIGITEL’s response rate was 71.1%, varying from 64.4% to 81.0%; the refusal rate was 9.1%, varying from 5.4% to 15.0%.
The entire 2006 VIGITEL sampling process detail-ing and data collection was described by Moura et al16 (2008).
The practice of physical activities was assessed ac-cording to the domains: leisure-time (practice of one category of sport/physical exercise, describing its in-tensity and type, as well as its weekly frequency and daily length), occupational (carrying weight or walk-ing for a long time), transportation (gowalk-ing to and com-ing back from work on foot or by bicycle) and house-hold chores (light or heavy househouse-hold cleaning). Indi-viduals were classifi ed as active in leisure time when INTRODUCTION
reporting physical activities of moderate intensity for at least 30 minutes, for fi ve or more days a week, or ac-tivities of vigorous intensity for at least 20 minutes, for three or more days a week. An activity is considered moderate intensity when it involves energy expendi-ture equivalent to three to six times the resting value, and vigorous intensity, when equivalent to at least six times the resting value. Individuals were considered active at work when they reported carrying weight or heavy load, or when walking for a long time at work.
For the transportation domain, active individuals were those who reported going to and coming back from work on foot or by bicycle for at least 30 minutes a day. For household chores, individuals were consid-ered active when they reported being responsible for most of the heavy household cleaning.
Reproducibility of VIGITEL questions about physical activity is high (kappa coeffi cient of 0.80 and 0.78 for active individuals in the leisure-time domain and inac-tive ones in the four domains, respecinac-tively).15
VIGI-TEL questionnaire validity, compared to 24-hour re-calls of physical activities, showed specifi city between 80.5% and 86.5% and sensitivity between 50.0% and 59.1% for active individuals in the leisure-time do-main and inactive ones in the four dodo-mains, respec-tively. Mean number of minutes per week of physical activities practiced in leisure time from the 24-hour recall method was higher in individuals considered active than in those considered inactive in leisure time from VIGITEL. Mean number of minutes per week of physical activities in the four domains (leisure-time, occupational, household and transportation), as mea-sured by the recall method, was lower in individuals considered inactive in the four domains than in the re-maining ones assessed by VIGITEL.15
Demographic and socioeconomic characteristics con-sidered were as follows: age, sex, marital status, skin color, level of education, number of people and rooms in the household, number of adults and number of
fi xed telephone lines in the household.
Environmental variables for physical activity practice were related to the presence of places to walk and practice physical exercises close to the home, such as public or private clubs, gyms, squares, streets, parks and schools.
Prevalence of active individuals in leisure time was as-sessed according to the presence and type of place for physical activity close to the home. Crude and adjusted prevalence ratios were calculated for level of educa-tion and age for active individuals in leisure time.
Weighting factors attributed to each individual in-terviewed by VIGITEL were considered for all esti-mates, according to Moura et al (2008).16 To achieve
this, the following were considered: the ratio of the number of adults and that of fi xed telephone lines in each household; the relative percentage of a certain category (sex, age and level of education) in relation to the 2000 census distribution; and the sampling frac-tion of adults studied from the total number of adults living in each city in the 2000 census.
SPSS 15.0 and Stata 9.0 were used in all analyses.
As interviews were conducted by telephone, the in-formed consent form was replaced by verbal consent obtained during telephone contacts with intervie-wees. VIGITEL was approved by the Comissão de Ética em Pesquisa em Seres Humanos do Ministério da Saúde (Ministry of Health Human Research Eth-ics Committee).
RESULTS
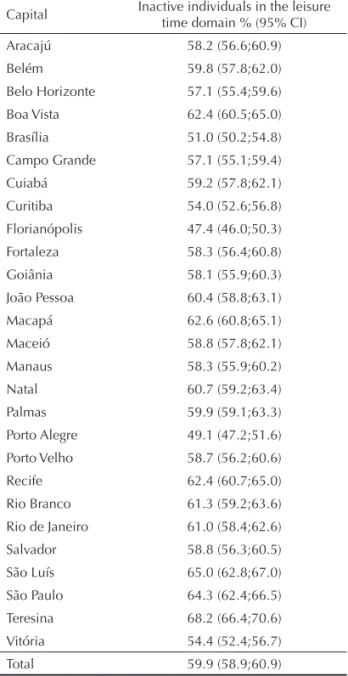
Prevalence of inactive individuals in leisure time was higher than 60% in ten cities (Table 1).
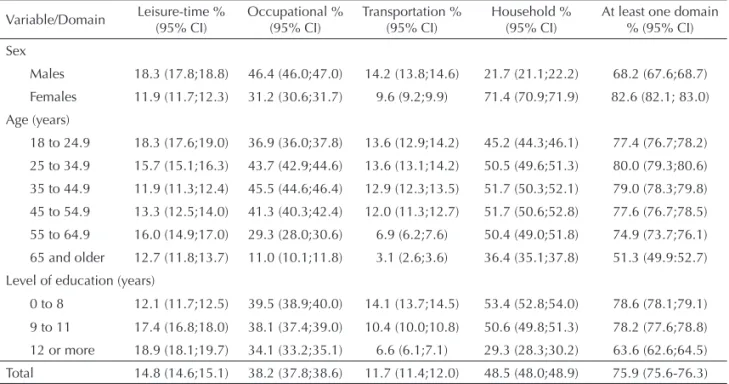
Table 2 shows the prevalence of active individuals ac-cording to the sex, age and level of education domains. Men were more active than women in the leisure-time, occupational and transportation domains, and women were more active in heavy household cleaning. Young adults aged between 18 and 24 years and adults be-tween 45 and 65 years were more active in leisure time than those aged between 25 and 44 years and those aged 65 years or older. Adults aged between 18 and 44 years practiced more physical activity at work. Physical activity practice in transportation was more frequent in adults aged up to 54 years, decreasing after this age. Household chore domain was more prevalent in adults aged between 25 and 64 years. Individuals with 12 or more years of schooling were more active in the leisure-time domain and less active at work, in transportation and in heavy household cleaning. In general, 76% of the adult population was active in at least one of the domains, and this percentage was higher in women, and lower in older individuals (≥ 65 years) and those with higher level of education (≥ 12 years of schooling). Of all active individuals, 61.1% are active in only one domain, 29.5% in two, 8.5% in three, and 0.8% in four domains.
Table 3 shows the prevalence of active individuals in leisure time, according to the practice of physical
activities in the other domains. Prevalence of active individuals in leisure time was more frequent in those active in transportation, whereas there was an inver-sion for the other physical activity domains.
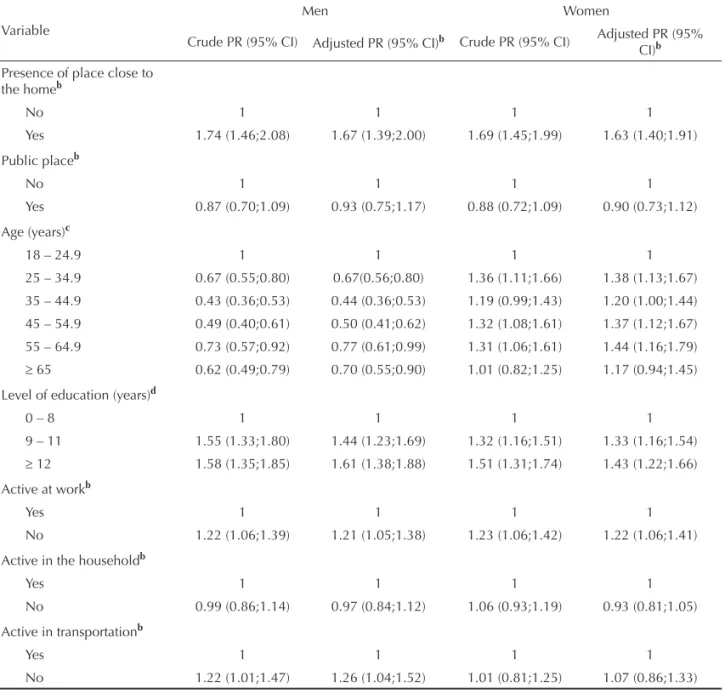
The presence of a place close to the home for leisure time activities increased this practice in both sexes, in all age groups and levels of education. The frequency of physical activity in leisure time was always higher in men, regardless of age and level of education (Table 4). After adjusting for age and level of education, the probability of being active in leisure time was approxi-mately 1.7 times higher in men and 1.6 times in women who live close to an adequate place for physical activ-ity, regardless of this being public or private (Table 5). Table 1. Frequencya of inactive individuals in the leisure-time
domain, according to Brazilian capitals, 2006.
Capital Inactive individuals in the leisure time domain % (95% CI) Aracajú 58.2 (56.6;60.9)
Belém 59.8 (57.8;62.0) Belo Horizonte 57.1 (55.4;59.6) Boa Vista 62.4 (60.5;65.0) Brasília 51.0 (50.2;54.8) Campo Grande 57.1 (55.1;59.4)
Cuiabá 59.2 (57.8;62.1) Curitiba 54.0 (52.6;56.8) Florianópolis 47.4 (46.0;50.3) Fortaleza 58.3 (56.4;60.8)
Goiânia 58.1 (55.9;60.3) João Pessoa 60.4 (58.8;63.1) Macapá 62.6 (60.8;65.1) Maceió 58.8 (57.8;62.1)
Manaus 58.3 (55.9;60.2) Natal 60.7 (59.2;63.4) Palmas 59.9 (59.1;63.3) Porto Alegre 49.1 (47.2;51.6) Porto Velho 58.7 (56.2;60.6)
Recife 62.4 (60.7;65.0) Rio Branco 61.3 (59.2;63.6) Rio de Janeiro 61.0 (58.4;62.6) Salvador 58.8 (56.3;60.5)
São Luís 65.0 (62.8;67.0) São Paulo 64.3 (62.4;66.5) Teresina 68.2 (66.4;70.6) Vitória 54.4 (52.4;56.7) Total 59.9 (58.9;60.9)
a Weighted values to adjust VIGITEL sample
Practice of physical activities in the occupational do-main was inversely associated with physical activ-ity in leisure time, whereas physical activities in the transportation domain were positively associated with physical activity in leisure time in men. After adjust-ment for age and level of education, the probability of being active in leisure time among those considered inactive at work was 1.2 times higher for men and women. For men who had been categorized as active in transportation, the probability of being active in lei-sure time was 1.3 times higher.
DISCUSSION
This is the fi rst population-based epidemiological study in Brazil that assessed different domains of physical activity separately. In addition, it is part of the baseline for future studies that monitor physical activity trends in Brazil by VIGITEL, which should be maintained in the next years.16
Men were more active in the leisure-time, occupation-al and transportation domains, whereas women were more active in heavy household cleaning. The older an individual is, especially from 55 years onwards, Table 2. Frequencya of physically active individuals and physical activity domains, according to sex, age and level of
education. Brazil, 2006.
Variable/Domain Leisure-time % (95% CI)
Occupational % (95% CI)
Transportation % (95% CI)
Household % (95% CI)
At least one domain % (95% CI) Sex
Males 18.3 (17.8;18.8) 46.4 (46.0;47.0) 14.2 (13.8;14.6) 21.7 (21.1;22.2) 68.2 (67.6;68.7) Females 11.9 (11.7;12.3) 31.2 (30.6;31.7) 9.6 (9.2;9.9) 71.4 (70.9;71.9) 82.6 (82.1; 83.0) Age (years)
18 to 24.9 18.3 (17.6;19.0) 36.9 (36.0;37.8) 13.6 (12.9;14.2) 45.2 (44.3;46.1) 77.4 (76.7;78.2) 25 to 34.9 15.7 (15.1;16.3) 43.7 (42.9;44.6) 13.6 (13.1;14.2) 50.5 (49.6;51.3) 80.0 (79.3;80.6)
35 to 44.9 11.9 (11.3;12.4) 45.5 (44.6;46.4) 12.9 (12.3;13.5) 51.7 (50.3;52.1) 79.0 (78.3;79.8) 45 to 54.9 13.3 (12.5;14.0) 41.3 (40.3;42.4) 12.0 (11.3;12.7) 51.7 (50.6;52.8) 77.6 (76.7;78.5) 55 to 64.9 16.0 (14.9;17.0) 29.3 (28.0;30.6) 6.9 (6.2;7.6) 50.4 (49.0;51.8) 74.9 (73.7;76.1) 65 and older 12.7 (11.8;13.7) 11.0 (10.1;11.8) 3.1 (2.6;3.6) 36.4 (35.1;37.8) 51.3 (49.9:52.7)
Level of education (years)
0 to 8 12.1 (11.7;12.5) 39.5 (38.9;40.0) 14.1 (13.7;14.5) 53.4 (52.8;54.0) 78.6 (78.1;79.1)
9 to 11 17.4 (16.8;18.0) 38.1 (37.4;39.0) 10.4 (10.0;10.8) 50.6 (49.8;51.3) 78.2 (77.6;78.8) 12 or more 18.9 (18.1;19.7) 34.1 (33.2;35.1) 6.6 (6.1;7.1) 29.3 (28.3;30.2) 63.6 (62.6;64.5) Total 14.8 (14.6;15.1) 38.2 (37.8;38.6) 11.7 (11.4;12.0) 48.5 (48.0;48.9) 75.9 (75.6-76.3)
a Weighted values to adjust VIGITEL sample sociodemographic distribution to the adult population distribution of each city in
the 2000 Demographic Census.
Table 3. Frequencya of active individuals in the leisure-time domain, according to physical activity level in the occupational, transportation and household domains. Brazil, 2006.
Physical activity domain Total sample Men Women % (95% CI) % (95% CI) % (95% CI) Occupational
No 15.6 (14.8;16.4) 19.9 (18.4;21.5) 12.7 (11.9;13.5) Yes 13.7 (12.5;14.9) 16.4 (14.5;18.2) 10.3 (8.9;11.6)
Transportation
No 14.5 (13.8;15.2) 17.7 (16.5;18.9) 11.9 (11.2;12.6) Yes 17.4 (14.9;19.8) 21.6 (17.8;25.3) 12.0 (9.6;14.5) Household
No 16.5 (15.6;17.5) 18.3 (16.9;19.6) 12.4 (11.2;13.6) Yes 13.1 (12.3;13.9) 18.4 (16.2;20.5) 11.7 (10.9;12.6)
a Weighted values to adjust VIGITEL sample sociodemographic distribution to the adult population distribution of each city in
the lower the physical activity levels in all domains are. People with a higher level of education were more active in leisure time and more inactive at work, transportation and heavy household cleaning. People who were inactive at work were more active in leisure time, while active men in transportation were more ac-tive in leisure time. The presence of an adequate place for physical activity close to the home was associated with physical activity practice in leisure time.
Prevalence of physical activity in the domains in-creased in the following order: transportation, leisure-time, occupational and household domains. A similar pattern was observed for adults in the city of São Pau-lo, Southeastern Brazil, based on the application of the International Physical Activity Questionnaire (long IPAQ version).6 The authors used the cut-off point of
150 minutes of physical activities in each domain and found prevalences of 8.3% of active individuals in transportation, 22.5% in leisure time, 31.1% at work, and 43.3% in household chores.
Surveys conducted in middle- and low-income coun-tries, such as Brazil, Peru, Mexico, Albania and Baltic countries, showed that, in the leisure-time domain, the frequency of insuffi ciently active adults is higher than 50%.2,11,14,19,22,23 In high-income countries, such as the
United States, Germany, England and Australia, prev-alences varied between 25% and 62%.1,3,5,6,12,17,21
A Behavioral Risk Factors Surveillance System (BRFSS) survey conducted in 2006, with a sample of 50 U.S. states, in addition to the District of Columbia,
Virgin Islands and Puerto Rico, showed prevalences of physical inactivity in leisure time between 14.2% and 41.2%;12 thus, lower than those found in all
Bra-zilian state capitals and the Federal District.
The differences observed between men and women in the leisure-time domain were similar to those ob-served by Monteiro et al (2003),14 in a representative
sample of the Southeast and Northeast regions, and by Dias-da-Costa et al (2005),2 in a sample of adults in
Southern Brazil. Most of the literature of high-income countries, such as the United States, Australia and England, and middle- and low-income countries, such as Peru and the Baltic countries, confi rmed that men are more active in leisure time than women.5,17,19,22
In the present study, men were also more active than women in transportation activities, although the fre-quency of active women in household chores was three times higher than that of men. Likewise, Flo-rindo et al (2009)6 showed that men were more active
in leisure time, at work and in transportation, while household chores signifi cantly increased the physical activity level in women.
The present study showed a reduction in physical ac-tivity practice in the occupational and transportation domains from the age of 55 years onwards, and in the leisure-time and heavy household cleaning domains from 65 years onwards. Studies in Brazil,2,14 Spain,3
Germany,21 Baltic countries19 and Australia17 showed
a reduction in physical activity practice in leisure Table 4. Frequencya of suffi ciently active individuals in the leisure-time domain, according to the presence of public place for
physical activity in leisure time close to the home, according to sex, age and level of education. Brazil, 2006.
Variable Presence of place Public place
Yes % (95% CI) No % (95% CI) Yes % (95% CI) No % (95% CI) Sex
Males 20.2 (19.7;20.8) 11.6 (10.8;12.5) 19.9 (19.3;20.5) 22.8 (21.0;24.6)
Females 13.3 (12.9;13.8) 7.9 (7.3;8.5) 13.1 (12.6;13.6) 14.8 (13.5;16.2) Age (years)
18 to 24.9 20.2 (19.4;21.1) 12.1 (10.9;13.3) 19.5 (18.6;20.4) 25.6 (23.0;28.1) 25 to 34.9 17.5 (16.8;18.2) 10.1 (9.1;11.2) 17.2 (16.4;17.9) 19.8 (17.7;22.0)
35 to 44.9 13.1 (12.4;13.8) 7.7 (6.7;8.7) 13.1 (12.4;13.9) 13.1 (11.1;15.2) 45 to 54.9 14.6 (13.7;15.4) 8.9 (7.6;10.2) 14.3 (13.4;15.2) 16.5 (13.7;19.3) 55 to 64.9 18.5 (17.2;19.8) 8.9 (7.3;10.5) 18.9 (17.5;20.2) 14.4 (10.6;18.3) 65 and more 14.8 (13.6;16.0) 7.8 (6.4;09.2) 15.2 (14.0;16.5) 11.1 (7.7;14.4)
Level of education (years)
0 to 8 13.5 (13.1;14.0) 8.5 (7.9;9.2) 13.3 (12.8;13.8) 15.5 (14.0;17.1) 9 to 11 19.3 (18.6;20.0) 11.0 (10.0;12.0) 19.1 (18.4;19.8) 20.8 (18.7;22.9) 12 or more 20.5 (19.6;21.4) 10.9 (9.4;12.5) 20.6 (19.6;21.6) 20.0 (17.8;22.2)
Total 16.6 (16.2;16.9) 9.5 (9.0;10.0) 16.4 (16.0;16.7) 18.3 (17.2;19.4)
a Weighted values to adjust VIGITEL sample sociodemographic distribution to the adult population distribution of each city in
time with age. The same pattern was found for physi-cal activity at work in Australia,20 Albania23 and the
United States,1 and for physical activity in the four
domains in Brazil,6 Colombia8 and other 51 middle-
and low-income countries.9
The positive association between level of education and physical activity practice in leisure time has been observed in Brazil2,14 and in countries such as Peru,22
Baltic countries,19 Mexico11 and in high-income
coun-tries as well.1,3,5,20 In the present study, activities
per-formed at work, in transportation and heavy house-hold cleaning were those that most contributed for the
physical activity level in individuals with lower level of education. In a study with North American women with low level of education, higher inactivity in lei-sure time and higher physical activity at work and in household chores were observed.24 In the city of São
Paulo, the higher the level of education, the more ac-tive individuals were in leisure time and the less acac-tive they were at work and in household chores.6 In the
city of Pelotas, Southern Brazil, Hallal et al (2003)10
showed a linear trend of protection against complete physical inactivity as economic conditions decreased, i.e. poorer individuals were more protected against complete physical inactivity.
Table 5. Crude and adjusted prevalence ratioa for the practice of physical activities recommended in leisure time, according
to the presence of place close to the home, type of place, age group, level of education and other physical activity domains. Brazil, 2006.
Variable
Men Women
Crude PR (95% CI) Adjusted PR (95% CI)b Crude PR (95% CI) Adjusted PR (95% CI)b Presence of place close to
the homeb
No 1 1 1 1
Yes 1.74 (1.46;2.08) 1.67 (1.39;2.00) 1.69 (1.45;1.99) 1.63 (1.40;1.91)
Public placeb
No 1 1 1 1
Yes 0.87 (0.70;1.09) 0.93 (0.75;1.17) 0.88 (0.72;1.09) 0.90 (0.73;1.12)
Age (years)c
18 – 24.9 1 1 1 1
25 – 34.9 0.67 (0.55;0.80) 0.67(0.56;0.80) 1.36 (1.11;1.66) 1.38 (1.13;1.67) 35 – 44.9 0.43 (0.36;0.53) 0.44 (0.36;0.53) 1.19 (0.99;1.43) 1.20 (1.00;1.44) 45 – 54.9 0.49 (0.40;0.61) 0.50 (0.41;0.62) 1.32 (1.08;1.61) 1.37 (1.12;1.67) 55 – 64.9 0.73 (0.57;0.92) 0.77 (0.61;0.99) 1.31 (1.06;1.61) 1.44 (1.16;1.79) ≥ 65 0.62 (0.49;0.79) 0.70 (0.55;0.90) 1.01 (0.82;1.25) 1.17 (0.94;1.45)
Level of education (years)d
0 – 8 1 1 1 1
9 – 11 1.55 (1.33;1.80) 1.44 (1.23;1.69) 1.32 (1.16;1.51) 1.33 (1.16;1.54) ≥ 12 1.58 (1.35;1.85) 1.61 (1.38;1.88) 1.51 (1.31;1.74) 1.43 (1.22;1.66)
Active at workb
Yes 1 1 1 1
No 1.22 (1.06;1.39) 1.21 (1.05;1.38) 1.23 (1.06;1.42) 1.22 (1.06;1.41)
Active in the householdb
Yes 1 1 1 1
No 0.99 (0.86;1.14) 0.97 (0.84;1.12) 1.06 (0.93;1.19) 0.93 (0.81;1.05)
Active in transportationb
Yes 1 1 1 1
No 1.22 (1.01;1.47) 1.26 (1.04;1.52) 1.01 (0.81;1.25) 1.07 (0.86;1.33)
a Weighted values to adjust VIGITEL sample sociodemographic distribution to the adult population distribution of each city in
the 2000 Demographic Census.
The relationship between physical activities in leisure time and other types of physical activity is still contro-versial. In the present study, higher prevalence of ac-tive individuals in leisure time was found in men who were active in transportation. Inverse association was found between active individuals at work and practice of physical activities in leisure time in both sexes. A study with North American adults (National Health and Nutrition Examination Survey – NHANES, 1999-2000)25 showed positive association between
physi-cal activities at work and in leisure time, especially among men.
In a study with young adults aged between 18 and 29 years in Colombia,7 it was observed that the practices
of both walking and cycling as a way of transportation were associated with the practice of physical activities in leisure time, results which were confi rmed in the present study. Such positive association is relevant for public health, once the joint promotion of these two domains is feasible to establish future interventions.
From the point of view of public policies, observing that places suitable for the practice of physical ac-tivities close to the home signifi cantly contribute to this practice is an important fi nding to subsidize the planning of actions that encourage these practices in leisure time. In a meta-analysis study on perceived environment and physical activity, there was a
posi-tive association between the presence of facilities for physical activities and their practice.4 Another study
with adults showed that places for recreation which are up to 1,500 meters away from homes are positive-ly associated with the practice of physical activities in leisure time.13
The main limitation to this study is similar to that to the entire telephone-based surveillance system and refers to the exclusion of individuals who reside in households without a fi xed telephone line. According to Moura et al (2008),16 although having increased in
the last years, fi xed telephone network coverage is not universal; it can be low in less developed cities and in strata with lower socioeconomic level.
Results from the present study are important to monitor physical activity levels in Brazil from 2006 onwards and to understand the behavior of different physical activity domains, according to sociodemographic and environmental characteristics. Interventions to pro-mote physical activities deserve to be prioritized in public health in Brazil. More than 300 cities include physical activity promotion interventions and healthy diet promotion by the Ministry of Health. Such initia-tive, in addition to large-scale interventions existing in this country, can contribute to promote healthier life-styles for the Brazilian population.
1. Crespo CJ, Smit E, Andersen RE, Carter-Pokras O, Ainsworth BE. Race/ethnicity, social class and their relation to physical inactivity during leisure time: results from the Third National Health and Nutrition Examination Survey, 1988-1994. Am J Prev Med. 2000;18(1):46-53. DOI:10.1016/S0749-3797(99)00105-1
2. Dias-da-Costa JS, Hallal PC, Wells JCK, Daltoé T, Fuchs SC, Menezes AM, et al. Epidemiology of leisure-time physical activity: a population-based study in southern Brazil. Cad Saude Publica. 2005;21(1):275-82. DOI:10.1590/S0102-311X2005000100030
3. Domínguez-Berjón MF, Borrell C, Nebot M, Plasència A. Leisure time physical activity and its association with demographic variables and other behaviors related with health. Gac Sanit. 1998;12(3):100-9.
4. Duncan MJ, Spence JC, Mummery WK. Perceived environment and physical activity: a meta-analysis of selected environmental characteristics. Int J Behav Nutr Phys Act. 2005;2:11. DOI:10.1186/1479-5868-2-11
5. Eaton CB, Reynes J, Assaf AR, Feldman H, Lasater T, Carleton RA. Predicting physical activity change in men and women in two New England communities. Am J Prev Med. 1993;9(4):209-19.
6. Florindo AA, Guimarães VV, Cesar CLG, Barros MBA, Alves MCGP, Goldbaum M, et al. Epidemiology of leisure, transportation, occupational and household
physical activity: prevalence and associated factors. J Phys Act Health. 2009;6:625-32.
7. Gómez LF, Sarmiento OL, Lucumí DI, Espinosa G, Forero R, Bauman A. Prevalence and factors associated with walking and bicycling for transport among young adults in two low-income localities of Bogotá, Colombia. J Phys Act Health. 2005;2(4):445-59.
8. Gómez LF, Duperly J, Lucumí DI, Gámez R, Venegas AS. Physical activity levels in adults living in Bogota (Colombia): prevalence and associated factors. Gac Sanit. 2005;19(3):206-13. DOI:10.1157/13075953
9. Guthold R, Ono T, Strong KL, Chatterji S, Morabia A. Worldwide variability in physical inactivity a 51-country survey. Am J Prev Med. 2008;34(6):486-94. DOI:10.1016/j.amepre.2008.02.013
10. Hallal PC, Victora CG, Wells JC, Lima RC. Physical inactivity: prevalence and associated variables in Brazilian adults. Med Sci Sports Exerc. 2003;35(11):1894-900. DOI:10.1249/01. MSS.0000093615.33774.0E
11. Hernández B, de Haene J, Barquera S, Monterrubio E, Rivera J, Shamah T, et al. Factors associated with physical activity among Mexican women of childbearing age. Rev Panam Salud Publica. 2003;14(4):235-45.
Areas - Behavioral Risk Factor Surveillance System (BRFSS), United States, 2006. MMWR Surveill Summ. 2008;57(7):1-188.
13. McCormack GR, Giles-Corti B, Bulsara M. The relationship between destination proximity, destination mix and physical activity behaviors. Prev Med. 2008;46(1):33-40. DOI:10.1016/j.ypmed.2007.01.013 14. Monteiro CA, Conde WL, Matsudo SM, Matsudo VR,
Bonsenõr IM, Lotufo PA. A descriptive epidemiology of leisure-time physical activity in Brazil, 1996-1997. Rev Panam Salud Publica. 2003;14(4):246-54. DOI:10.1590/S1020-49892003000900005
15. Monteiro CA, Florindo AA, Claro R, Moura EC. Validade de indicadores de atividade física e sedentarismo obtidos por inquérito telefônico. Rev Saude Publica 2008;42(4):575-81. DOI:10.1590/ S0034-89102008000400001
16. Moura EC, Morais Neto OL, Malta DC, Moura L, Silva NN, Bernal R; Claro RM, Monteiro CA. Vigilância de fatores de risco para doenças crônicas por inquérito telefônico nas capitais dos 26 estados brasileiros e no Distrito Federal (2006). Rev Bras Epidemiol. 2008:11(supl.1):20-37. DOI:10.1590/S1415-790X2008000500003
17. Owen N, Bauman A. The descriptive epidemiology of a sedentary lifestyle in adult Australians. Int J Epidemiol. 1992;21(2):305-10. DOI:10.1093/ije/21.2.305
18. Pate RR, Pratt M, Blair SN, Haskell WL, Macera CA, Bouchard C, et al. Physical activity and public health. A recommendation from the Centers for Disease Control and Prevention and the American College of Sports Medicine. Jama. 1995;273(5):402-7. DOI:10.1001/jama.273.5.402
19. Pomerleau J, McKee M, Robertson A, Vaasc S, Kadziauskiene K, Abaravicius A, et al. Physical inactivity in the Baltic countries. Prev Med. 2000;31(6):665-72. DOI:10.1006/pmed.2000.0761
20. Salmon J, Owen N, Bauman A, Schmitz MK, Booth M. Leisure-time, occupational, and household physical activity among professional, skilled, and less-skilled workers and homemakers. Prev Med. 2000;30(3):191-9. DOI:10.1006/pmed.1999.0619
21. Schneider S, Becker S. Prevalence of physical activity among the working population and correlation with work-related factors: results from the fi rst German National Health Survey. J Occup Health. 2005;47(5):414-23. DOI:10.1539/joh.47.414
22. Seclén-Palacín JA, Jacoby ER. Sociodemographic and environmental factors associated with sports physical activity in the urban population of Peru. Rev Panam Salud Publica. 2003;14(4):255-64.
23. Shapo L, Pomerleau J, McKee M. Physical inactivity in a country in transition: a population-based survey in Tirana City, Albania. Scand J Public Health. 2004;32(1):60-7. DOI:10.1080/14034940310011801
24. Sternfeld B, Ainsworth BE, Quesenberry CP. Physical activity patterns in a diverse population of women. Prev Med. 1999;28(3):313-23. DOI:10.1006/ pmed.1998.0470
25. Wolin KY, Bennett GG. Interrelations of socioeconomic position and occupational and leisure-time physical activity in the National Health and Nutrition Examination Survey. J Phys Act Health. 2008;5(2):229-41.
This article underwent the peer review process adopted for any other manuscript submitted to this journal, with anonymity guaranteed for both authors and reviewers. Editors and reviewers declare that there are no confl icts of interest that could affect their judgment with respect to this article.