Socioeconomic inequalities
in the access to and quality of
health care services
Desigualdades socioeconômicas no
acesso e qualidade da atenção nos
serviços de saúde
I Programa de Pós-Graduação em Epidemiologia. Universidade Federal de Pelotas. Pelotas, RS, Brasil
II Programa de Pós-Graduação em Enfermagem. Universidade Federal de Pelotas. Pelotas, RS, Brasil
Correspondence:
Bruno Pereira Nunes
Av. Duque de Caxias, 250 3º andar 96030-002 Pelotas, RS, Brasil E-mail: [email protected] Received: 2/18/2014 Approved: 7/1/2014
Article available from: www.scielo.br/rsp
ABSTRACT
OBJECTIVE: To assess the inequalities in access, utilization, and quality of health care services according to the socioeconomic status.
METHODS: This population-based cross-sectional study evaluated 2,927 individuals aged ≥ 20 years living in Pelotas, RS, Southern Brazil, in 2012. The associations between socioeconomic indicators and the following outcomes were evaluated: lack of access to health services, utilization of services, waiting period (in days) for assistance, and waiting time (in hours) in lines. We used Poisson regression for the crude and adjusted analyses.
RESULTS: The lack of access to health services was reported by 6.5% of the individuals who sought health care. The prevalence of use of health care services in the 30 days prior to the interview was 29.3%. Of these, 26.4% waited ive days or more to receive care and 32.1% waited at least an hour in lines. Approximately 50.0% of the health care services were funded through the Uniied Health System. The use of health care services was similar across socioeconomic groups. The lack of access to health care services and waiting time in lines were higher among individuals of lower economic status, even after adjusting for health care needs. The waiting period to receive care was higher among those with higher socioeconomic status.
CONCLUSIONS: Although no differences were observed in the use of health care services across socioeconomic groups, inequalities were evident in the access to and quality of these services.
DESCRIPTORS: Health Services Accessibility. Quality of Health Care. Waiting Lists. Socioeconomic Factors. Equity in Access. Health Inequalities. Primary Health Care. Cross-Sectional Studies.
Bruno Pereira NunesI
Elaine ThuméII
Elaine TomasiI
Suele Manjourany Silva DuroI
The assessment of socioeconomic inequalities in the access to and the quality of health care services is an important strategy for evaluating the performance of health care systems.8,11,20 In Brazil, the Brazilian Uniied Health System(SUS) has made much prog-ress after its establishment in 1988. However, the access of the population to health care services remains unequal and needs to be monitored.21 Population surveys on the factors associated with the use of health care services have indicated social inequalities13 with a small decrease in horizontal inequalities.12 However, evaluating the differences between the socioeconomic groups only by use of health care services may present limitations, consid-ering that the relation between health services and the population involves many factors that go beyond meeting the demand for these services.
Information about individuals who failed to receive health care services (deined as lack of access) and the waiting period to receive health care are indicators of the quality of health care systems that are less frequently
RESUMO
OBJETIVO:Avaliar desigualdades no acesso, utilização e qualidade da atenção à saúde associadas a características socioeconômicas.
MÉTODOS: Estudo transversal de base populacional que realizou inquérito domiciliar com 2.927 indivíduos de 20 anos ou mais, em Pelotas, RS, em 2012. Variáveis de classiicação econômica e escolaridade foram utilizadas para estimar associação com os desfechos: falta de acesso, utilização dos serviços de saúde, dias de espera para atendimento e tempo na ila de espera. Utilizou-se regressão de Poisson para as análises bruta e ajustada.
RESULTADOS: A falta de acesso foi referida por 6,5% dos indivíduos que buscaram atendimento. A prevalência de utilização de serviços de saúde nos 30 dias anteriores à entrevista foi de 29,3%. Destes, 26,4% esperaram cinco dias ou mais para o atendimento, 32,1% esperaram uma hora ou mais na ila. Aproximadamente metade dos atendimentos foi realizada nos serviços do Sistema Único de Saúde. O uso de serviços de saúde foi semelhante entre os estratos dos indicadores socioeconômicos. A falta de acesso e o tempo na ila de espera foram maiores entre os indivíduos de piores posições socioeconômicas, mesmo após ajuste para necessidades em saúde. O número de dias de espera para atendimento foi maior entre aqueles com melhor poder aquisitivo.
CONCLUSÕES: Embora não tenham sido observadas diferenças socioeconômicas no uso de serviços de saúde, foram evidenciadas desigualdades no acesso e na qualidade da atenção à saúde.
DESCRITORES: Acesso aos Serviços de Saúde. Qualidade da Assistência à Saúde. Listas de Espera. Fatores Socioeconômicos. Equidade no Acesso. Desigualdades em Saúde. Atenção Primária à Saúde. Estudos Transversais.
INTRODUCTION
evaluated in the literature,3 especially in studies with population representation.
The aim of this study was to assess inequalities in access, utilization, and quality of health care services according to the socioeconomic status.
METHODS
This population-based cross-sectional study evaluated 2,927 individuals aged ≥ 20 years living in urban areas of Pelotas, RS, Southern Brazil, in 2012, and analyzed the data previously recorded in a health survey called the research consortium.
and the other accessed via health care plans), one public Centro de Especialidades (CE – specialty center), seven Centros de Atenção Psicossocial (CAPS – psychoso-cial care centers), ive general hospitals, one psychiatric hospital, and approximately 600 private medical clinics.
The study sample was randomly and systematically selected in two stages. The irst stage involved the selection of census sectors from the 2010 censusa and the second stage involved the selection of house-holds. Of the 495 census sectors from urban areas, 130 were selected. Of these, 1,722 households were located, respecting the strategy of systematic sampling proportional to the sector size. In each selected house-hold, all individuals aged > 10 years were invited to participate. The exclusion criteria were: patients who were institutionalized and those with severe mental or emotional disabilities that precluded the completion of the survey. This analysis was restricted to individuals aged ≥ 20 years.
Before the interviews, all selected households were visited by ield supervisors, who delivered an invita -tional letter to residents with an invitation to partici-pate. After acceptance, a visit with an interviewer was scheduled. Interviews were handled by trained staff. Interviews that were not performed after three attempts on different days and times, with one of these attempts being made by a study supervisor, were considered losses and refusals. Quality control was ensured using different data collection strategies, e.g., checking for database inconsistencies. After the interviews, a new visit was made randomly to 10.0% of the study sample. Quality control was ensured by using a short question-naire containing 14 queries.
Data were collected between February and June 2012. The structured electronic questionnaires containing precoded questions were administered using netbooks.
The outcomes assessed were the use of health care services, lack of access to services, waiting period (days) for health care, and waiting time (minutes) in lines. The use of health care services was assessed with the question: “Since <day of the last month>, did you use any health care service?”. The question was preceded by an introduction explaining the health care services available in the city so that respondents would not disregard any type of health care service. The type of health care service used and funding of the last service received in the previous month were assessed.
The lack of access to health care services was assessed by the analysis of afirmative answers to two questions: “Although not having used health care services, did you request any of them since <day of the last month>?” and
“Did you sought any health care service since <day of the month>?”. These questions were asked only to indi-viduals who reported not using any health care service in the last month. The lack of access was assessed as the ratio between the number of individuals pursuing health care facilities (denominator) and those who were not assisted in the same period (numerator). In addi-tion, the type of health care service provided and the reason for the lack of access in the irst service sought in the previous month were assessed.
The waiting period (days) for assistance was measured by analyzing the answers to the following question: “How long did you wait before availing the service?”. The variable was dichotomized at 5 days of receiving treatment,9 and this value represented the 75th percen-tile of distribution. For this parameter, the denominator was the total number of individuals who used health care services.
The waiting time (minutes) in lines was measured by analyzing the answers to the following question: “After you arrived at the health care unit, how long did you wait in lines before receiving the service?”. The variable was dichotomized at 1 h of waiting to receive treatment, and this value represented the 75th distribution percen-tile. For this parameter, the denominator was the total number of individuals who used health care services, excluding those who were hospitalized.
With the exception of the period in lines, the remaining outcomes were analyzed according to the model proposed by another national survey.16
The two main independent variables considered indica-tors of socioeconomic status were the economic clas-siication, which was categorized by the Associação Brasileira de Empresas de Pesquisa (ABEP – Brazilian Association of Survey Companiesb) (A and B, C, D and E), and the level of education in years (≤ 4, 5-8, ≥ 9 years).10 The variables used to adjust for confounding factors and/or mediators were gender (male/female), age (20-29, 30-39, 40-49, 50-59, ≥ 60 years), self-reported ethnicity (Caucasian, Black, Brown, Eastern, and Indigenous), marital status (with a partner/without a partner), self-reported medical diagnosis of morbidities (yes/no) – hypertension, diabetes, heart disease, asthma, or some other health problem in the last month – and the type of health care service used (medical clinic, basic health care unit, emergency care unit, outpatient unit, specialized center, psychosocial care centers, health care services in another city, and hospital). The legal nature of the services was also characterized (SUS, health care plan, and out-of-pocket health expenditure) for further analysis.
A descriptive analysis involving the calculation of prevalence and its respective conidence intervals was executed. We used Poisson regression to obtain the crude and adjusted prevalence rates2 and respec-tive p-values. For the adjusted analysis, three models were used. The irst model examined the association between outcomes and socioeconomic indicators (economic status and level of education), adjusted for the following variables: gender, age, ethnicity, marital status, and either level of education or economic status, to remove the effect of possible confounders. Model 2 included model 1 and the self-reported morbidities to control the effect of the health needs. Model 3 included model 2 and the type of health care service sought. This model was developed to indicate the mediator role of health care services in the association between outcomes, economic status, and level of education, considering that the type of health care service is a determinant of the quality of care and represents a proxy for the urgency/emer-gency of health care services. Associations with p < 0.05 were considered signiicant. Statistical analyses were performed using Stata 12.1 software and the syv command was used to consider the sampling process of the study.
This study was approved by the Research Ethics Committee of the Faculdade de Medicina da Universidade Federal de Pelotas (Protocol 77/11 of December 1, 2011). All participants signed an informed consent form.
RESULTS
A total of 2,927 adults aged ≥ 20 years were inter-viewed. The study had 13.4% of losses and refusals. Among the losses, 43.6% were female with a mean age of 45.8 years.
Among the sample study, 58.9% were female. The overall mean age of the population was 45.7 years (SD = 16.6 years). Caucasian was the most common (80.1%) ethnicity, followed by Black ethnicity (12.1%). Individuals with partners represented 59.4% of the sample. In addition, 54.1% of the individuals had > 9 years of study and 18.0% had ≤ 4 years of study. The predominant economic status was A/B (46.4%), followed by C (43.4%), and D/E (10.2%). Among the morbidities, hypertension was reported by 32.7% of the respondents, followed by heart disease (11.5%), diabetes (7.9%), and asthma (6.0%). In addition, approximately 22.8% of the respondents reported some health problems in the last month (Table 1).
The prevalence of use of health care services in the month prior to the interview was 29.3% (95%CI 27.6;31.0). Among the individuals who sought health care services, 6.5% (95%CI 4.6;8.3) reported lack of
access, particularly for not having a health care card (42.4%) and lack of doctors (30.5%). Of the adults who used health care services, 26.4% (95%CI 22.7;30.1) waited ≥ 5 days to receive care. The time in lines was ≥ 1 h for 32.1% (95%CI 28.4;35.7) of the subjects who used health services (Table 1).
Table 1. Demographic and socioeconomic characteristics and distribution of morbidity, lack of access, health care service utilization, and quality of health care. Pelotas, RS, Southern Brazil, 2012.
Variable n %
Gender (N = 2,927)
Male 1,203 41.1
Female 1,724 58.9
Age (in years) (N = 2,927)
20 to 29 612 20.9
30 to 39 540 18.4
40 to 49 595 20.3
50 to 59 514 17.6
≥ 60 666 22.8
Ethnicity (N = 2,926)
Caucasian 2,345 80.1
Black 354 12.1
Brown/East Asian/Indigenous 227 7.8
Marital status (N = 2,923)
With partner 1,736 59.4 Without partner 1,187 40.6 Education (in years) (N = 2,924)
≤ 4 526 18.0
5 to 8 817 27.9
≥ 9 1,581 54.1
Economic status (N = 2,905)
A/B 1,349 46.4
C 1,261 43.4
D/E 295 10.2
Self-reported morbidity
Hypertension (N = 2,926) 958 32.7
Diabetes (N = 2927) 230 7.9 Heart disease (N = 2,927) 336 11.5 Asthma (N = 2,927) 175 6.0 Health problem in the last month
(N = 2,925)
666 22.8
Outcomes
Use of health care services (N = 2,925) 856 29.3 Lack of access (N = 915) 59 6.5
Waiting period for assistance ≥ 5 days (N = 853)
225 26.4
With regard to the type of service used, 12.6% of the adults used medical clinics, 7.4% used basic health units, 5.1% used emergency care units, and 3.5% used outpatient clinics, specialized centers, psychosocial care centers, or health care services from other municipalities, and 0.7% were hospitalized. In total, SUS funded 45.7% of the health care services whereas health care plan and out-of-pocket health expenditure inanced 41.2% and 13.1% of the services, respectively. The lower the economic status and level of education, the higher the rate of funding by SUS.
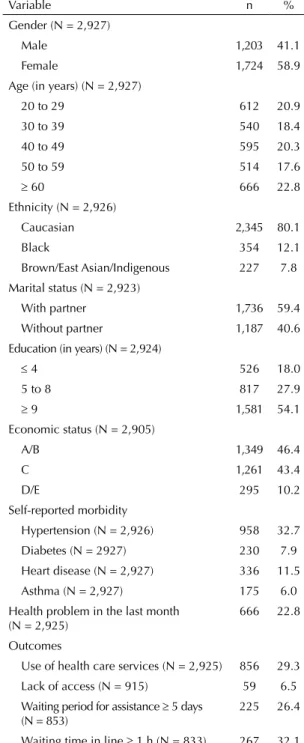
The highest prevalence of lack of access and waiting time in lines were observed among individuals with a lower economic status and a lower level of education. The higher the economic status and level of educa-tion, the longer the waiting period (in days) to receive treatment. The use of health care services was similar between individuals of economic groups and educa-tion levels (Table 2).
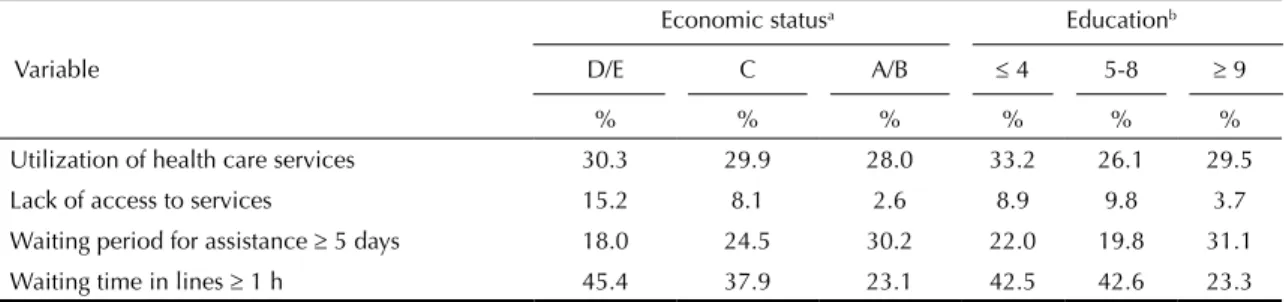
The highest prevalence of lack of access (16.7%) and waiting time of ≥ 1 h in lines (53.0%) were recorded for those who sought or used basic health care services (Figure).
Analyses of the unadjusted models showed a signiicant association with all outcomes, except the use of health care services and economic status. After adjustment for model 1 (sociodemographic variables) and model 2 (model 1 plus health care needs), associations remained similar. Individuals of economic class C and D/E showed greater lack of access and longer period in lines (≥ 60 min) than individuals from classes A and B. Adults with lower level of education (≤ 8 years) were less likely to wait ≥ 5 days to receive care compared with those with ≥ 9 years of education. In model 3 (models 1 and 2 plus the type of health care service sought), associations were not signiicant with exception of the waiting period of ≥ 5 days to receive care and level of education (Table 3).
Table 2. Prevalence of the outcomes according to the economic status and level of education. Pelotas, RS, Southern Brazil, 2012.
Variable
Economic statusa Educationb
D/E C A/B ≤ 4 5-8 ≥ 9
% % % % % %
Utilization of health care services 30.3 29.9 28.0 33.2 26.1 29.5 Lack of access to services 15.2 8.1 2.6 8.9 9.8 3.7 Waiting period for assistance ≥ 5 days 18.0 24.5 30.2 22.0 19.8 31.1 Waiting time in lines ≥ 1 h 45.4 37.9 23.1 42.5 42.6 23.3 a ABEP: Associação Brasileira de Empresas de Pesquisa. Classification A/B: higher economic status.
b Full years of study.
%
16.7
0 10
Lack of access
UBS Medical clinics Emergency care services Outpatient clinics/Speciality centers/Psychosocial care
Waiting period to receive care ≥ 5 days Waiting time in lines ≥ 1
20 30 40 50 60 70 80 90 100
1.3 0.5
8.2
17.3 35.9
1.4 43.6
53.0
15.6 30.9
48.5
UBS: Basic health care unit; CE: specialty center; CAPS: psychosocial care center; other city: health services provided in other municipalities
a All differences according to the type of health care service p < 0.001 (Chi-square of heterogeneity).
973
Variable
D/E C
pc
≤ 4 5-8
pc
Adjusted model PR 95%CI PR 95%CI PR 95%CI PR 95%CI
Use
Unadjusted model 1.08 0.89;1.31 1.07 0.93;1.22 0.559 1.12 0.98;1.29 0.88 0.77;1.01 0.008
Model 1 1.05 0.84;1.31 1.09 0.94;1.26 0.539 0.95 0.79;1.12 0.84 0.72;0.98 0.067
Model 2 0.97 0.79;1.18 1.09 0.96;1.24 0.237 0.88 0.75;1.03 0.84 0.74;0.96 0.030
Lack of access
Unadjusted model 5.91 2.73;12.82 3.12 1.59;6.13 < 0.001d 2.40 1.21;4.74 2.63 1.50;4.59 0.002d
Model 1 4.29 1.64;11.20 2.37 1.11;5.05 0.002d 1.41 0.63;3.14 1.87 1.00;3.50 0.147
Model 2 4.43 1.69;11.59 2.43 1.13;5.24 0.002d 1.60 0.70;3.67 1.92 1.02;3.59 0.127
Model 3 1.83 0.74;4.50 1.21 0.61;2.40 0.326 0.91 0.40;2.06 1.11 0.59;2.09 0.850
Waiting period for assistance ≥5 days
Unadjusted model 0.60 0.36;0.99 0.81 0.64;1.03 0.021d 0.71 0.51;0.97 0.64 0.46;0.88 0.008
Model 1 0.80 0.46;1.41 0.97 0.75;1.25 0.737 0.61 0.40;0.92 0.60 0.41;0.86 0.008d
Model 2 0.79 0.46;1.38 0.96 0.74;1.25 0.709 0.62 0.41;0.95 0.60 0.42;0.87 0.011d
Model 3 0.92 0.52;1.62 1.02 0.79;1.34 0.886 0.69 0.48;1.00 0.67 0.47. 0.96 0.028d
Waiting time in line ≥ 1 h
Unadjusted model 1.96 1.39;2.78 1.64 1.28;2.11 < 0.001d 1.83 1.40;2.38 1.83 1.43;2.34 < 0.001d
Model 1 1.59 1.12;2.23 1.38 1.08;1.76 0.003d 1.54 1.13;2.11 1.60 1.25;2.06 0.002d
Model 2 1.60 1.14;2.25 1.37 1.07;1.76 0.002d 1.57 1.14;2.17 1.62 1.26;2.08 0.002d
Model 3 1.08 0.77;1.52 1.03 0.81;1.31 0.907 1.21 0.90;1.63 1.31 1.04;1.66 0.079
Model 1: Adjusted for gender, age, ethnicity, marital status, and education (ABEP, association with schooling).
Model 2: Model 1 + self-reported health problems (hypertension, diabetes, heart disease, asthma, and health problems in the last month). Model 3: Model 2 + health care service sought.
a Reference: A/B. b Reference: ≥ 9.
DISCUSSION
The similarity observed between the different socio-economic groups in the use of health care services may indicate improvements in the public health care system.15 Nevertheless, socioeconomic inequalities were observed with respect to the access to and quality of care for individuals with a lower economic status and those with a lower level of education, even after adjusting for health needs.
The access to and use of health care services have been extensively studied, resulting in the creation of models that attempt to elucidate their characteristics.1,7 Most models consider the access to health care services either as an indicator of the use of health care services or deines access to health care services as a variable that contemplates several characteristics associated with the relationship of the population with these services, considering individual aspects (needs and demographic characteristics) and aspects related to the organization of health care services. The use of health care services indicates the implementation of access to health care services and it is also an indicator of the performance of the health care system. However, its application as an indicator to health access may present distortions in health assessment because it ignores the individuals who sought but failed to receive care. The identiication of the lack of access should also be prioritized for the evaluation of health care services and inequalities.4,14,17
The lack of access to health care services was more prevalent among individuals with lower socioeconomic status. The similarity observed in the use of health care services did not express the variability observed in the lack of access to these services. This result serves as a warning to the conceptual and operational differences between use of and access to health care services.19
The percentage of individuals without access to health care services was similar to that found in Canada23 and also in Brazilian studies of national representativeness.15 The prevalence of lack of access is relatively low but the expected prevalence is zero considering that this access is a citizen’s right and responsibility of the State.c Furthermore, during the recall period, many individuals may have expe-rienced lack of access but may have received treatment in the last month. Of note, the queries with regard to the lack of access were provided only to individuals who reported not using any health care service. Therefore, the method used for assessing the outcomes may have minimized the magnitude of the problem.
The city of Pelotas has 51 basic health care units (38 of which are in urban areas), which is enough to provide
suficient care services to the population. However, the higher prevalence of lack of access in these units points out the kind of interventions that need to be made in this situation. The failure to receive care hinders the estab-lishment of primary care as the organizer and coordi-nator of the health network.d Following the guidelines proposed to meet the spontaneous demand,e the adop-tion of risk stratiicaadop-tion and assessment of vulnera-bilities should be contemplated. This would avoid the main route of entry into the health system becoming an obstacle for individuals attempting to receive treatment, leading to inappropriate use of emergency services.5
The number of days before receiving care was the only indicator that showed inequality favoring individuals of a lower socioeconomic status. Although its associa-tion with economic status was not maintained in the adjusted analyses, individuals with a lower level of education received health care services faster, even after adjusting for health needs. However, this result should be treated with caution, considering the complexity of this characteristic. The funding of healthcare utiliza-tion may have signiicantly inluenced this inding. The shortest period (in days) to receive care in basic health care units depends, to some extent, on the persistence of the population to receive treatment, even facing long lines starting very early in the morning.6
The longer waiting time in lines among individuals with a lower level of education indicates impor-tant barriers in the organization of public health care services. In municipalities in the state of Rio de Janeiro, Southeastern Brazil, health care services provided through SUS demanded longer waiting time in lines than services not provided through SUS.18 Actions taken to shorten lines in Salvador, BA, Northeastern Brazil, resulted in a signiicant reduction of the waiting time.22 The study indings indicate that health care services can decrease economic inequalities in the access and quality of care. The effect of economic class in the occurrence of lack of access and time spent in lines was mediated by health services, relecting their importance as a social determinant of health.
Some limitations in our study should be considered. First, losses and refusals were different by gender, which may cause bias in the prevalence of outcomes. However, it is unlikely that the effect measures have been affected, considering that, in principle, there is no reason to suspect that the losses were different in the association between outcomes and socioeconomic variables. Furthermore, gender was used in the adjust-ment models to avoid distortions in the effect measures. Second, the external validity of the indings is dificult
c Brasil. Constituição da República Federativa do Brasil. Brasília (DF); 1998. Artigo 196.
to assess because of the characteristics related to the socioeconomic status and health care in the city of Pelotas. Third, the evaluation of different health care services reported herein complicates the speciicity of some discussions but provides information at the popu-lation level, indicating possible topics to be evaluated in detail in future studies, e.g., the limited access to primary health care services.
The indings of this study reveal problems in health care services, especially among the population that uses basic health care services in the urban area of Pelotas. The lack of access and the longer period in lines were more frequent among those with lower socioeco-nomic status, indicating potential inequalities that can be avoided in the scope of a more effective primary health care system.
1. Andersen RM. Revisiting the behavioral model and access to medical care: does it matter? J Health Soc Behav. 1995;36(1):1-10. DOI:10.2307/2137284
2. Barros AJ, Hirakata VN. Alternatives for logistic regression in cross-sectional studies: an empirical comparison of models that directly estimate the prevalence ratio. BMC Med Res Methodol. 2003;3:21. DOI:10.1186/1471-2288-3-21
3. Campbell SM, Roland MO, Buetow SA. Defining quality of care. Soc Sci Med. 2000;51(11):1611-25. DOI:10.1016/S0277-9536(00)00057-5
4. Capilheira MF, Santos IS. Fatores individuais associados à utilização de consultas médicas por adultos. Rev Saude Publica. 2006;40(3):436-43. DOI:10.1590/S0034-89102006000300011
5. Carret ML, Fassa AC, Domingues MR. Inappropriate use of emergency services: a systematic review of prevalence and associated factors. Cad Saude Publica. 2009;25(1):7-28. DOI:10.1590/S0102-311X2009000100002
6. Cunha ABO, Vieira-da-Silva LM. Acessibilidade aos serviços de saúde em um município do Estado da Bahia, Brasil, em gestão plena do sistema. Cad Saude Publica. 2010;26(4):725-37. DOI:10.1590/S0102-311X2010000400015
7. Donabedian A. The effectiveness of quality assurance. Int J Qual Health Care. 1996;8(4):401-7. DOI:10.1093/intqhc/8.4.401
8. Facchini LA, Piccini RX, Tomasi E, Thumé E, Silveira DS, Siqueira FV, et al. Desempenho do PSF no Sul e no Nordeste do Brasil: avaliação institucional e epidemiológica da Atenção Básica à Saúde. Cienc Saude Coletiva. 2006;11(3):669-81. DOI:10.1590/S1413-81232006000300015
9. Forrest CB, Starfield B. Entry into primary care and continuity: the effects of access. Am J Public Health.
1998;88(9):1330-6. DOI:10.2105/AJPH.88.9.1330
10. Galobardes B, Shaw M, Lawlor DA, Lynch JW, Smith GD. Indicators of socioeconomic position (part 1).
J Epidemiol Community Health. 2006;60(1):7-12. DOI:10.1136/jech.2004.023531
11. Macinko J, Starfield B. Annotated bibliography on equity in health, 1980-2001. Int J Equity Health.
2002;1(1):1. DOI:10.1186/1475-9276-1-1
12. Macinko J, Lima-Costa M. Horizontal equity in health care utilization in Brazil, 1998-2008. Int J Equity Health.
2012;11(1):33. DOI:10.1186/1475-9276-11-33
13. Mendoza-Sassi R, Béria JU. Utilización de los servicios de salud: una revisión sistemática sobre los factores relacionados. Cad Saude Publica. 2001;17(4):819-32. DOI:10.1590/S0102-311X2001000400016
14. Oliver A, Mossialos E. Equity of access to health care: outlining the foundations for action. J Epidemiol Community Health. 2004;58(8):655-8. DOI:10.1136/jech.2003.017731
15. Paim J, Travassos C, Almeida C, Bahia L, Macinko J. The Brazilian health system: history, advances, and challenges. Lancet. 2011;377(9779):1778-97. DOI:10.1016/S0140-6736(11)60054-8
16. Piccini RX, Facchini LA, Tomasi E, Siqueira FV, Silveira DS, Thumé E, et al. Promoção, prevenção e cuidado da hipertensão arterial no Brasil. Rev Saude Publica. 2012;46(3):543-50. DOI:10.1590/S0034-89102012005000027
17. Ribeiro MCSA, Barata RB, Almeida MF, Silva ZP. Perfil sociodemográfico e padrão de utilização de serviços de saúde para usuários e não-usuários do SUS - PNAD 2003. Cienc Saude Coletiva. 2006;11(4):1011-22. DOI:10.1590/S1413-81232006000400022
18. Szwarcwald CL, Mendonça MHM, Andrade CLT. Indicadores de atenção básica em quatro municípios do Estado do Rio de Janeiro, 2005: resultados de inquérito domiciliar de base populacional.
Cienc Saude Coletiva. 2006;11(3):643-55. DOI:10.1590/S1413-81232006000300013
19. Travassos C, Martins M. Uma revisão sobre os conceitos de acesso e utilização de serviços de saúde. Cad Saude Publica. 2004;20 Suppl 2:190-8. DOI:10.1590/S0102-311X2004000800014
20. Viacava F, Ugá MAD, Porto S, Laguardia J, Moreira RS. Avaliação de Desempenho de Sistemas de Saúde: um modelo de análise.
Cienc Saude Coletiva. 2012;17(4):921-34. DOI:10.1590/S1413-81232012000400014
21. Victora CG, Barreto ML, do Carmo Leal M, Monteiro CA, Schmidt MI, Paim J, et al. Health conditions and health-policy innovations in Brazil: the way forward. Lancet. 2011;377(9782):2042-53. DOI:10.1016/S0140-6736(11)60055-X
22. Vieira-da-Silva LM, Chaves SC, Esperidiao MA, Lopes-Martinho RM. Accessibility to primary healthcare in the capital city of a northeastern state of Brazil: an evaluation of the results of a programme. J Epidemiol Community Health. 2010;64(12):1100-5. DOI:10.1136/jech.2009.097220
Research supported by the Coordenação de Aperfeiçoamento de Pessoal de Nível Superior (CAPES – Process PROEX 337/2010), through the provision of a M.S. scholarship.
Based on the dissertation of Nunes BP, titled: “Acesso aos serviços de saúde em adolescentes e adultos na cidade de Pelotas-RS”, presented to the Graduate Program in Epidemiology at the Faculdade de Medicina da Universidade Federal de Pelotas, in 2012. Authors declare no conflict of interest.
23. Wilson K, Rosenberg MW. Accessibility and the Canadian health care system: squaring perceptions
and realities. Health Policy. 2004;67(2):137-48. DOI:http://dx.doi.org/10.1016/S0168-8510(03)00101-5
HIGHLIGHTS
This population-based study evaluated the use of, lack of access to, and waiting period for health care services. Moreover, it evaluates the socioeconomic inequalities associated with these factors.
This assessment will help elucidate the occurrence and factors that inluence the availability, lack of access, and quality of health care services and will outperform the more traditional studies that address only the use of health care services. Data were obtained from a representative sample of the adult population (≥ 20 years) in Pelotas, a medium-sized city in Southern Brazil.
The results indicated socioeconomic equality in the use of health care services, which is attributable to the progress in the SUS during recent years, since inequalities were observed in most previous studies. However, among indi-viduals who sought health care services, 6.5% were not eligible for health care services in the past month, which corresponds to approximately 4,500 adults (extrapolated to the target population) in Pelotas. The lack of access was greater among those with lower economic status and who sought primary health care services. The lack of doctors and prompt medical assistance for service were the main reasons reported.
The availability of human resources in primary health care, changes in both the organization of the care services provided and in the labor processes of the medical teams are all essential measures to promote an improved orga-nization and coordination of the health care network for the population assisted by this care health system.