Spatial distribution of M.
tuberculosis/HIV coinfection
in São Paulo State, Brazil,
1991-2001
ABSTRACT
OBJECTIVE: To assess the spatial pattern of tuberculosis incidence in relation to
the AIDS epidemic, with the aim of investigating the geographical influence on causality.
METHODS: All AIDS cases from State of São Paulo, notified to the Brazilian
Ministry of Health between 1991 and 2001, were included. The cases were stratified by municipality, by administrative health regions, AIDS transmission categories, gender and years since diagnosis. A Gaussian geostatistical model was used to construct a thematic risk map, utilizing the tuberculosis incidence among AIDS cases as the response variable.
RESULTS: Exploratory analysis showed two patterns of AIDS incidence: one for
the state capital, and another, with increasing risk, for the other municipalities. The more populous regions presented higher risk of tuberculosis transmission, with a pattern that matched the land occupation pattern, from east to west. The health regions with the highest AIDS incidence coefficients (per 10,000 inhabitants) were Santos (53.5), São José do Rio Preto (43.1), Ribeirão Preto (42.4) and São Paulo (40.3). The health regions with greatest tuberculosis incidence among AIDS cases were Santos (44.9%), Franco da Rocha (39.9%), Osasco (39.6%) and São Paulo (38.9%).
CONCLUSIONS: The results allow the conclusion that geographical coordinates
presented an association with tuberculosis risk, but not with AIDS risk.
KEYWORDS: AIDS-related opportunistic infections, epidemiology. Tuberculosis, epidemiology. Acquired Immunodeficiency Syndrome, epidemiology. Epidemiologic surveillance. Residence characteristics. Incidence.
Antonio L Rodrigues-JrI
Antonio Ruffino-NettoI
Euclides Ayres de CastilhoII
I Departamento de Medicina Social.
Faculdade de Medicina de Ribeirão Preto. Universidade de São Paulo (USP). Ribeirão Preto, SP, Brasil
I I Departamento de Medicina Preventiva.
Faculdade de Medicina. USP. São Paulo, SP, Brasil
Correspondence:
Antonio Luiz Rodrigues-Jr Departamento de Medicina Social Av. Bandeirantes, 3900
14049-900 Ribeirão Preto, SP, Brasil E-mail: [email protected]
INTRODUCTION
The acquired immunodeficiency syndrome (AIDS) has altered the recent epidemiological history of tu-berculosis, affecting people of all socioeconomic classes.13 Individuals infected by HIV (HIV+) are 25 times more susceptible to tuberculosis than those who are not infected (HIV-),7 and patients with coinfection of HIV and Mycobacterium tuberculosis present twice the risk of death presented by HIV+ patients without tuberculosis.9
Between 1980 and August 1995, 71,000 AIDS cases were notified in Brazil. Over the same period, the estimated incidence of tuberculosis was 80,000 to 90,000 cases per year. It has been estimated that, out of a total of around 400,000 people infected with HIV, 30% were coinfected with M. tuberculosis.7 Kritski & Dalcomo8 (1993) reported an increase in the incidence of tuberculosis in Brazil among people infected with HIV from 8% in 1984 to 20% in 1994. Another Brazilian study, in the state of Ceará in 1997, found that 30.6% of the AIDS cases also had tubercu-losis, and that this increased to 76.8% one year later.7 Recent studies on the AIDS epidemic have shown increased incidence among people in lower socio-economic classes, which makes them more vulner-able to opportunistic diseases. Corbett et al2 (2003) reported that there were 114,000 cases of tuberculo-sis in Brazil in 2000, and estimated the prevalence of HIV+ individuals as 3.3% (3,762 cases).
The World Health Organization (WHO) recommends epidemiological monitoring and intensification of the early detection of AIDS as tuberculosis control strategies, through giving priority to active searches among people with persistent coughs and fever. Such a strategy depends on integration among health pro-grams and among the health information systems.14 Lima et al10 (1997) found that 43% of their AIDS cases had tuberculosis (217 out of 505 cases), and that this had not been registered by the tuberculosis informa-tion system in state of São Paulo in 1993.
The present study had the objective of studying the tuberculosis incidence among AIDS cases by using a geostatistical approach to assess the spatial distribu-tion pattern.
METHODS
This study was of retrospective type, using second-ary data. The population of each municipality was considered to be a dynamic cohort in which the mem-bers (residents) were, on average, exposed to the same causal factors for tuberculosis and AIDS over the
course of time. The tuberculosis incidence among AIDS cases (comorbidity), and the hypothesis that the spatial location would be associated with it, were observed4. The information on AIDS cases notified to the Ministry of Health between 1991 and 2001 was utilized, and the political-administrative divisions of municipalities produced by the Instituto Brasileiro de Geografia e Estatística (Brazilian Institute for Ge-ography and Statistics - IBGE) were adopted, for defining the observational units for the study.5
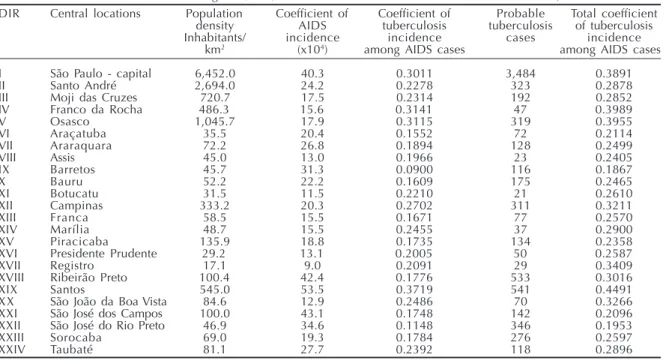
Over the whole country, 224,003 AIDS cases were notified. Among these, 7,800 cases were excluded because these individuals were less than 13 years old, given that diagnosing tuberculosis is more complex. Among the remaining 216,203 adult cases, 22.4% presented tuberculosis. The municipalities of São Paulo presented 100,494 AIDS cases, which corre-sponded to 44.9% of the epidemic in Brazil. After excluding the 3,203 children aged less than 13 years, it was found there were 25,147 adult cases of tuber-culosis. Because São Paulo is the most populous state and has the highest economic production in the coun-try, its municipalities were stratified into 24 adminis-trative health regions (DIR). This stratification re-spects the historical and geographical characteristics of the human occupation, thus resulting in a den-dritic network based on central locations, in accord-ance with Christaller’s theory.3 This theory states that some municipalities are more productive than oth-ers, and that there is a regionalized structure for the consumption of goods and services. The main regional centers for each stratum, as represented by main of-fices of the DIRs, were adopted as the central loca-tions and are shown in Table 1.
sys-tem, using the SAD-69 ellipsoid and the Córrego Alegre datum. The digital geographical base for the municipalities of São Paulo state was obtained from the Instituto Nacional de Pesquisas Espaciais (Na-tional Institute for Space Research - INPE). The inci-dence coefficients for each municipality took into consideration the sizes of their populations in 1996, thus representing the population at the halfway point of their follow-up. These figures were obtained from IBGE. The central coordinates of the localities were utilized for estimating the risk, by means of a spatial stochastic process of Gaussian, stationary, hetero-scedastic and anisotropic nature.4
The coefficients of tuberculosis incidence among AIDS cases, from the central location theory, were analyzed using the geostatistical model. A model of spatial continuity of the event was adopted, in which a semivariogram function translated the distribution of the dependencies between the observation units, thus serving as evidence for an association between the physical space and the incidence of the disease.4 The estimation of the risk of tuberculosis among AIDS cases was done using the generalized weighted least-squares method (“conventional kriging”). In this model, the distances from each municipality to the central locations acted as weights. The free software “R” was used in the geostatistical calculations.5,6,11
RESULTS
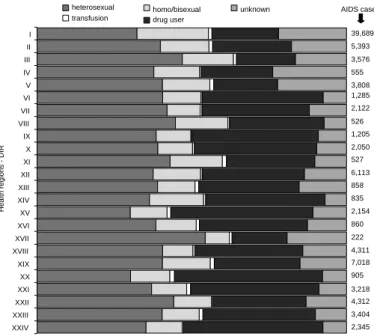
Table 1 presents the epidemiological and demographic measurements, and Figure 1 shows the proportional
distribution of the AIDS transmission categories for each DIR. It was observed that there was high inci-dence of AIDS cases with unknown transmission cat-egory, in the heavily populated DIRs (regions I, II, III, V and XII). Regions I, II, III and IV are grouped adja-cent to each other, covering an area in which more than 17 million people share the space, with innumerable contacts between them. The large numbers of AIDS cases with unknown transmission category in these regions may reflect a deficiency in the capacity of the epidemiological surveillance system to identify the HIV transmission category. DIR-I (the state capital) and DIR-II represented the municipalities with the highest population concentrations and highest incidence of tuberculosis among notified AIDS cases.
AIDS cases in São Paulo state were 2.6 times more frequent among males than among females. Among such cases with tuberculosis, the proportion was 3.4 times greater for males. Likewise, among the prob-able tuberculosis cases, the proportion was 3.1 times greater. Among the 25,147 AIDS cases with tubercu-losis the transmission category of injectable drug users was reported in 37.0%, the heterosexual egory in 31.9% and the unknown transmission cat-egory in 13.9%. If the probable tuberculosis cases were confirmed, the total number of AIDS cases with tuberculosis would be 32,711, made up of 35.7% in the transmission category of injectable drug users, 31.2% in the heterosexual category and 14.9% in the unknown category.
Table 2 presents the coefficients of tuberculosis
Table 1 - Characteristics of the health regions (DIRs) in relation to tuberculosis and AIDS. São Paulo state, 1991 to 2001.
DIR Central locations Population Coefficient of Coefficient of Probable Total coefficient density AIDS tuberculosis tuberculosis of tuberculosis
Inhabitants/ incidence incidence cases incidence
km2 (x104) among AIDS cases among AIDS cases
I São Paulo - capital 6,452.0 40.3 0.3011 3,484 0.3891
II Santo André 2,694.0 24.2 0.2278 323 0.2878
III Moji das Cruzes 720.7 17.5 0.2314 192 0.2852
IV Franco da Rocha 486.3 15.6 0.3141 47 0.3989
V Osasco 1,045.7 17.9 0.3115 319 0.3955
VI Araçatuba 35.5 20.4 0.1552 72 0.2114
VII Araraquara 72.2 26.8 0.1894 128 0.2499
VIII Assis 45.0 13.0 0.1966 23 0.2405
IX Barretos 45.7 31.3 0.0900 116 0.1867
X Bauru 52.2 22.2 0.1609 175 0.2465
XI Botucatu 31.5 11.5 0.2210 21 0.2610
XII Campinas 333.2 20.3 0.2702 311 0.3211
XIII Franca 58.5 15.5 0.1671 77 0.2570
XIV Marília 48.7 15.5 0.2455 37 0.2900
XV Piracicaba 135.9 18.8 0.1735 134 0.2358
XVI Presidente Prudente 29.2 13.1 0.2005 50 0.2587
XVII Registro 17.1 9.0 0.2091 29 0.3409
XVIII Ribeirão Preto 100.4 42.4 0.1776 533 0.3016
XIX Santos 545.0 53.5 0.3719 541 0.4491
XX São João da Boa Vista 84.6 12.9 0.2486 70 0.3266
XXI São José dos Campos 100.0 43.1 0.1748 142 0.2096
XXII São José do Rio Preto 46.9 34.6 0.1148 346 0.1953
XXIII Sorocaba 69.0 19.3 0.1784 276 0.2597
XXIV Taubaté 81.1 27.7 0.2392 118 0.2896
incidence among AIDS cases, for DIR-I and for the other DIRs, considering the male and female popu-lations. The corrected incidence coefficient of the comorbidity per 10,000 inhabitants was 15.7 for the state capital (DIR-I) and 7.1 for the other DIRs. The results showed that the injectable drug users of male gender living in the capital presented the highest incidence of the comorbidity (7.8x10⁴). In the corrected incidence of the comorbidity (25,147 notified cases and 7,564 probable cases), 77.1% were males. These were stratified as 30.2% with injectable drug use, 17.1% with heterosexual trans-mission, 17.0% with homosexual transtrans-mission, 11.8% with unknown transmission and 1% with vertical transmission. Among the women who pre-sented tuberculosis (33.1%), the most frequent
transmission category was heterosexual (14.0%).
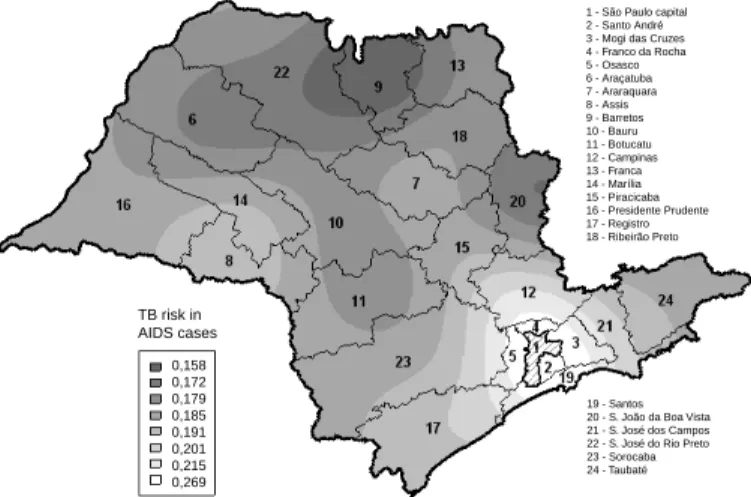
Figure 2a shows the annual series of AIDS incidence coefficients for DIR-I, from 1991 to 2001. Figure 2b shows the same time se-ries for the other DIRs together. Different epidemiological patterns for AIDS incidence can be seen: one for the capital, which shows stability with a tendency towards decreas-ing incidence, and another for the remain-ing municipalities, which shows a trend of increasing incidence. For both patterns, the incidence of the comorbidity decreased over this period, since the AIDS diagnosis was formerly based on the Caracas criteria and is now made via laboratory tests. Moreover, it can be seen that the numbers of probable cases that did not present a diagnosis of tu-berculosis decreased with time, both for DIR-I and for the other DDIR-IRs. The thematic map of Figure 3 shows the estimated spatial dis-tribution of the risk of tuberculosis among AIDS cases, in São Paulo state.
DISCUSSION
Around half of the AIDS notifications in Brazil come from São Paulo state, which represented close to one fifth of the population of Brazil in 1996. Thus, this is a high incidence coefficient. Two epidemiological patterns can be seen in the state: one pattern for the capital, which presents incidence that is apparently stable or slightly declining, and another for the other municipalities, which is clearly increasing. The pat-tern in the capital may be the result from the impact of prevention programs and from the participation of NGOs in combating the epidemic. For the state capi-tal, the IBGE estimated a population concentration
Table 2 - Coefficient of tuberculosis incidence among AIDS cases, considering the state capital (DIR-I) and the other health
regions (DIRs) according to AIDS transmission categories and gender. São Paulo state, 1991 to 2001.
Gender Transmission DIR-I Other DIR Corrected
category Notified Probable Notified Probable incid. coeffic.* Male
Heterosexual 4.03 0.99 2.13 0.53 3.33
Homo/Bisexual 5.05 2.04 1.39 0.46 3.32
Transfusion 0.20 0.07 0.10 0.03 0.16
Drug user5 6.40 1.39 4.06 1.09 5.90
Unknown 3.73 1.10 0.87 0.44 2.30
Subtotal 19.41 5.59 8.54 2.56 15.01
Female
Heterosexual 3.24 0.99 1.54 0.46 2.65
Homo/Bisexual — — — — —
Transfusion 0.06 0.04 0.03 0.02 0.07
Drug user 1.27 0.30 0.60 0.20 1.03
Unknown 0.84 0.32 0.20 0.13 0.58
Subtotal 5.41 1.65 2.37 0.81 4.33
Total 12.13 3.54 5.44 1.68 9.59
Corrected incidence coefficient* 15.67 7.13 9.59
*For the corrected coefficient, the notified and probable tuberculosis incidence among AIDS cases were considered
Figure 1 - Proportional distribution of AIDS cases according to transmission
categories and Health Regions (DIR). São Paulo state, 1991 to 2001.
XXIV XXIII XXII XXI XX XIX XVIII XVII XVI XV XIV XIII XII XI X IX VIII VII VI V IV III II I
Health regions - DIR
heterosexual homo/bisexual
transfusion drug user
unknown
39,689
5,393
3,576
555 3,808 1,285 2,122
526
1,205 2,050
527
6,113
858
835
2,154
860
222
4,311 7,018
905
3,218 4,312
3,404
of 6,451.8 inhabitants/km2 in the population count of 1996. The city of São Paulo is where the AIDS epidemic began in 1981. For the other DIRs, i.e. for the other municipalities in the state, a population concentration of 156.6 inhabitants/km2 was estimated.
This division does not reflect a realistic partition of the risks, since the AIDS transmission mechanisms are not circumscribed to the physical limits of the municipalities. However, it helps in evaluating the human dynamics in these spaces as determinants for AIDS and tuberculosis. This partition allows the state capital to be considered to be an important link for the propagation of transmittable diseases like AIDS and tuberculosis. Despite these trends for the AIDS epidemic, the tuberculosis incidence coefficients have decreased because of the progressive introduc-tion of laboratory tests for detecting HIV, in replace-ment for the Caracas/Rio de Janeiro criteria. How-ever, the real prevalence of M. tuberculosis and HIV coinfection is unknown, since the national program for sexually transmitted diseases (STD) and AIDS only records the opportunistic diseases present at the time when AIDS is diagnosed. HIV+ individuals present 25 times greater risk of having
tu-berculosis. Intensified attention needs to be given to individuals with persistent cough-ing and fever, by means of actively search-ing among the notified AIDS cases, and also communication needs to be stimulated be-tween the local tuberculosis and AIDS con-trol programs.
The highest AIDS incidence coefficients per 10,000 inhabitants were found in the regions DIR-XIX (53.5), DIR-XXI (43.1), DIR-XVIII (42.4) and DIR-I (40.3). The Santos and Ribeirão Preto health regions presented very similar proportions, although in Santos there was a greater percentage of cases in the ho-mosexual/bisexual transmission category and a lower percentage in the injectable drug user category. These differences are caused
by the migratory flow of formal and infor-mal market activities, and by the trade out-flow route towards the coast and abroad. The greatest total tuberculosis incidence among AIDS cases was found in DIR-XIX (44.9%), DIR-IV (39.9%) and DIR-V (39.6%). The municipality of Santos presented the high-est incidence coefficients, both for AIDS and for tuberculosis in AIDS cases, while DIR-I and DIR-XVIII presented 38.9% and 30.2% tuberculosis incidence among AIDS cases, putting them in fourth and eighth places, respectively. These figures give the idea that tuberculosis is an important disease in the regions with high population concentrations, as can be seen in Table 1.
The geostatistical method with adaptation to the central location theory showed coherence, by means of the semivariogram function, which showed an in-creasing trend only in the direction of 0º, thus indi-cating that the spatial autocorrelation occurred in the easterly direction. This is coherent with the land occupation pattern, which is from east to west. This pattern was not observed with the semivariogram for the AIDS incidence coefficient data, thus show-ing that there is no association between the value observed and the geographical location. These re-sults confirm the theoretical pattern for AIDS, since there is no transmission caused by physical proxim-ity (very close or adjacent neighbors). HIV is trans-mitted by people’s attitudes, which are reflected in their social behavior and not by proximity to the carrier of the agent. On the other hand, M. tubercu-losis is indeed transmitted by proximity to individu-als carrying the bacillus. These analogies enable it to be considered that the geostatistical model
Figure 2 - Historical series of AIDS incidence coefficients and the impact
of tuberculosis (TB) among AIDS cases, for the state capital (a) and other Health Regions (DIRs) outside of the state capital (b). São Paulo state, 1991 to 2001.
DIR-I (state capital) 0.0 0.5 1.0 1.5 2.0 2.5 3.0 3.5 4.0 4.5
1991 1992 1993 1994 1995 1996 1997 1998 1999 2000 2001
Cases per 10.000 inhabitants
(a)
Other DIR (outside of state capital) 0.0 0.5 1.0 1.5 2.0 2.5 3.0 3.5 4.0 4.5
1991 1992 1993 1994 1995 1996 1997 1998 1999 2000 2001
AIDS Notified TB Total TB
(b)
Figure 3 - Thematic map of the spatial distribution of the estimated
tuberculosis (TB) incidence risk in AIDS cases, considering the central localities structure (main offices of the Health Regions (DIRs)). São Paulo state, 1991 to 2001.
TB risk in AIDS cases
1 - São Paulo capital 2 - Santo André 3 - Mogi das Cruzes 4 - Franco da Rocha 5 - Osasco 6 - Araçatuba 7 - Araraquara 8 - Assis 9 - Barretos 10 - Bauru 11 - Botucatu 12 - Campinas 13 - Franca 14 - Marília 15 - Piracicaba 16 - Presidente Prudente 17 - Registro 18 - Ribeirão Preto
19 - Santos 20 - S. João da Boa Vista 21 - S. José dos Campos 22 - S. José do Rio Preto 23 - Sorocaba 24 - Taubaté
adopted does not lead to ecological fallacies, when structured with central locations. It showed multi-disciplinary coherence between geostatistics, human geography and epidemiology.
According to Corrêa3 (1996), the central locations can easily be determined, since they form part of the hierarchical structure of power, i.e. the administrative apparatus of the state, thus forming a network of den-dritic type, through which public policies are imple-mented. In the present study, the main offices of the DIRs were adopted as sample in a continuous process across the physical space. Therefore, the geostatistical model assumed that the distances from each munici-pality to the central locations would define a system of regional influences that would be concordant with the lines of reasoning of human geography. This re-sulted in the numerical model for the spatial
distribu-REFERENCES
1. Atomiya AN, Uip DE, Leite OHM. Evaluation of disease patterns, treatment and prognosis of tuberculosis in aids patients. Braz J Infect Dis. 2002;6(1):29-39.
2. Corbett EL, Watt CJ, Walker N, Maher D, Williams BG, Raviglione MC, et al. The growing burden of
tuberculosis: global trends and interactions with the HIV epidemic. Arch Intern Med. 2003;163(9):1009-21. 3. Corrêa RL. Trajetórias geográficas. Rio de Janeiro:
Bertrand Brasil; 1996.
4. Elliot P, Wakefield JC, Best NG, Briggs DJ. Spatial epidemiology: methods and applications. New York (NY): Oxford University Press; 2004.
5. Esteve J, Benhamou E, Raymond L. Descriptive epidemiology. Lyon: IARC Scientific Publications; 1994. 6. Isaaks EH, Srivastava RM. An introduction to applied
geostatistics. Oxford: Oxford University Press; 1989. 7. Kerr-Pontes LRS, Oliveira FAS, Freire CAM.
Tubercu-lose associada à aids: situação de região do nordeste brasileiro. Rev Saúde Pública. 1997;31(4):323-9.
8. Kritski AL, Dalcomo MP. Tuberculose e infecção pelo HIV no Brasil. J Pneumol. 1993;19(2):67-72.
9. Lagrange PH, Wargnier A, Herrmann JL.
Mycobacteriosis in the compromised host. Mem Inst Oswaldo Cruz. 2000;95 Suppl 1:163-70.
10. Lima MM, Belluomini M, Almeida MMMB, Arantes GR. Co-infecção HIV/tuberculose: necessidade de uma vigilância mais efetiva. Rev Saúde Pública. 1997;31(3):217-20.
11. Lourenço RW, Landim PMB. Mapeamento de áreas de risco à saúde pública por meio de métodos
geoestatísticos. Cad Saúde Pública. 2005;21(1):150-60. 12. Rodrigues-Júnior AL, Castilho EA. A epidemia de aids
no Brasil, 1991-2000: descrição espaço-temporal. Rev Soc Bras Med Trop. 2004;37(4):312-7.
13. Ruffino-Netto A. Tuberculose: a calamidade negligen-ciada. Rev Soc Bras Med Trop. 2002;35(1):51-8. 14. Souza WV, Albuquerque MFM, Barcellos CC,
Ximenes RAA, Carvalho MS. Tuberculose no Brasil: construção de um sistema de vigilância de base territorial. Rev Saúde Pública. 2005;39(1):82-9.
tion of the risk of tuberculosis in AIDS cases in São Paulo state.
An individual with AIDS will only become infected
by M. tuberculosis if there is exposure to the