Dementia & Neuropsychologia 2008;2(1):9-12
Raicher I, et al. qEEG spectral peak in Alzheimer’s disease 9
qEEG spectral peak in Alzheimer’s disease
A possible tool for treatment follow-up
Irina Raicher, Daniel Yasumasa Takahashi, Paulo Afonso Medeiros Kanda,
Ricardo Nitrini, Renato Anghinah
Abstract – qEEG spectral analysis has been considered highly sensitive to cortical functional changes and agrees strongly with the clinical diagnosis of AD. The sensitivity of spectral analysis has ranged from 71% to 81% in several studies.1-3. Objective: The aim of this study was to retrospectively evaluate whether alpha qEEG spectral
peak can supplement clinical examination by constituting an independent tool tomonitor treatment and fol-low-up of dementia progression in Alzheimer’s disease (AD). In addition, we examined the demographic data and alpha power spectra distribution of patients and elderly normal controls. Methods: qEEGs were selected from 2 groups of patients: normal controls (n=30), and patients who fulfilled criteria for mild probable AD diagnosis (n=41). The alpha qEEG spectral analysis and MMSE were performed once or twice a year. Results:
In our groups, MMSE scores and qEEG alpha spectral peak were unchanged (no statistical differences) after anticholinesterase use where qEEG spectral peak was never lower than 8 Hz in the control group. Conclusion:
This study supports two important concepts. First, 8 Hz alpha appears to be the lowest awake spectral peak compatible with normality. And finally, in a clinical context, qEEG is a valuable diagnostic tool that could prove useful for Dementia follow-up.
Key words: quantitative electroencephalography, spectral analysis, dementia, Alzheimer’s disease, memory com-plaint, cognition, qEEG.
Pico do espectro do EEG quantitativo na doença de Alzheimer: uma possível ferramenta para acompanha-mento do trataacompanha-mento.
Resumo – A análise espectral do EEG tem sido considerada muito sensível para mudanças da função cortical e compatível com o diagnóstico clínico da Doença de Alzheimer (DA). A sensibilidade da análise espectral varia de 71% a 81% em alguns estudos.1-3Objetivo: A proposta deste estudo foi uma avaliação retrospectiva sobre a
possibilidade do pico espectral do alfa no EEG quantitativo (EEGq) complementar o exame clínico fornecendo uma ferramenta independente para monitorizar o tratamento e para seguimento da progressão da demência na DA. Além disso, foram examinados dados demográficos e a distribuição do espectro da potência alfa de pacientes e controles da mesma idade. Métodos: EEGq foram selecionados de dois grupos de pacientes: os controles sem alterações e queixas de memória (n=30) e os pacientes com critérios preenchidos para DA provável (n=41). A análise do pico espectral do alfa no EEGq e o Mini-Exame do Estado Mental foram realizados uma ou duas vezes no ano. Resultados: Neste grupo estudado, o Mini-Exame do Estado Mental e o pico espectral do alfa no EEGq não foram estatisticamente diferentes depois do uso de anticolinesterásicos e o pico espectral do EEGq não foi menor do que 8 Hz em todos indivíduos do grupo controle.Conclusão: Este estudo sustenta dois con-ceitos importantes. Primeiro, 8 Hz de pico espectral de alfa, em vigília, aparenta ser o menor valor compatível com normalidade. E finalmente, em contexto clínico, EEGq é uma ferramenta que pode ser útil no seguimento da de Demência.
Palavras-chave: eletroencefalografia quantitative, análise espectral, demência, doença de Alzheimer, queixa de memória, cognição, EEGq.
10 qEEG spectral peak in Alzheimer’s disease Raicher I, et al.
Dement Neuropsychol 2008;2(1):9-12
As the aging population continues to grow at a vigorous pace, the prevalence of neurodegenerative diseases is ris-ing worldwide. Alzheimer’s disease (AD) is the most com-mon neurodegenerative disorder and its treatment requires early detection of cognitive decline. Nevertheless, there is no consensus on methods to estimate and measure the di-agnosis and progression of patients with AD. The advance in quantitative electroencephalography (qEEG) plays a sig-nificant role in EEG-based clinical diagnosis and studies of brain function, revealing new possibilities for clinical application in cognitive and behavioral areas. Quantitative EEG techniques include the mathematical transformation of brain electrical activity data from the time domain into the frequency domain by the Fast Fourier Transform algo-rithm. Traditional EEG methods support the separation of the frequency data into four main frequency bands: delta (1–4 Hz), theta (4–8 Hz), alpha (8–13 Hz), and beta (13–30 Hz) (Kaplan and Sadock, 1998). According to a longitudi-nal study, the mean posterior dominant frequency declined by 0.08 Hz per year of age over 60 years (Wang and Busse, 1969). There is thus ample evidence in the literature to con-sider an average alpha frequency of less than 8.5 Hz as ab-normal, measured with the patient fully alert (Niedermeyer, E). Although posterior frequency decline is usually inespe-cific and cannot differentiate any particular disorder, it has been a common electroencephalographic sign described in many conditions evolving to cognitive alterations, and is frequently encountered in AD individuals. There is a good correlation between the degree of EEG abnormality and cognitive impairment in the literature. We proposed that qEEG spectral peak could represent an independent tool to perform Alzheimer’s disease follow-up after medication.
Objective
The aim of the study was to evaluate whether the qEEG can supplement the clinical examination by constituting an independent tool tomonitor treatment and dementia progression. We examined the distribution of qEEG alpha spectral peak in patients with Alzheimer’s disease (AD) and elderly normal controls, along with the impact of acetyl-cholinesterase inhibitor (AChEI) treatment on background qEEG activity.
Methods
ParticipantsIn a retrospective study, three hundred medical files of patients older than 60 years, from a private Neurology outpatient unit, were studied. Two groups of patients were selected with the following criteria: Group 1, cognitively healthy patients with no sustained memory loss complaints and normal routine activities were considered controls
(n=30); Group 2, patients who fulfilled criteria for mild and moderate probable AD diagnosis (n=41). A diagnosis of probable AD was made by an experienced consultant neurologist according to the NINCDS-ADRDA criteria.4 Patients presented mild to moderate symptoms, according to the DSM-III-R.5 Patients and controls were submitted to the Brazilian version of the Mini-Mental State Examination (MMSE)6,7, considering subsequent scores for the same in-dividual as evaluation of cognitive status. All patients and controls were screened for concomitant neurologic diag-noses and psychiatric history.
Materials and procedure
One hundred seventy qEEGs were retrieved from the files. They had been recorded during awake, resting con-ditions with eyes closed, by means of a computer-based system (EMSA) from 20 electrode locations using a stan-dard International 10-20 electrodes system8. The EEG was bandpass filtered for 1-30 Hz prior to digitalization, using a sampling rate of 200 Hz. Samples were selected by visual inspection, in order to obtain a minimum of 20 2-s epochs free of eye blink, drowsiness, muscle movements, or equip-ment-related artifacts. Frequency domain analysis was per-formed using the Fast Fourier Transform algorithm, with the calculation of the mean frequency and average electri-cal power in each frequency band of the spectrum. Power was divided into the four frequency bands delta (0.5–3.9 Hz), theta (4–7.9 Hz), alpha (8–13 Hz), and beta (14.5–30 Hz). The spectral analysis of further qEEG and the MMSE tests were performed once or twice a year in the control group and in AD patients before and after 6 months of acetylcholinesterase inhibitor (AChEl) treatment. The medications used were galantamine (21 patients), meman-tine plus rivastigmine (1 patient), tacrine (2 patients), and rivastigmine (16 patients), donepezil (1 patient) and were grouped altogether.
Data analysis
The Chi-square test was used to assess comparisons of sex and schooling. The two-sample t test was used to assess comparisons of age and the non-parametric Mann-Whit-ney test for awake qEEG prior to and during treatment. All statistical analyses were performed by the SPSS program.
Results
Demographic data
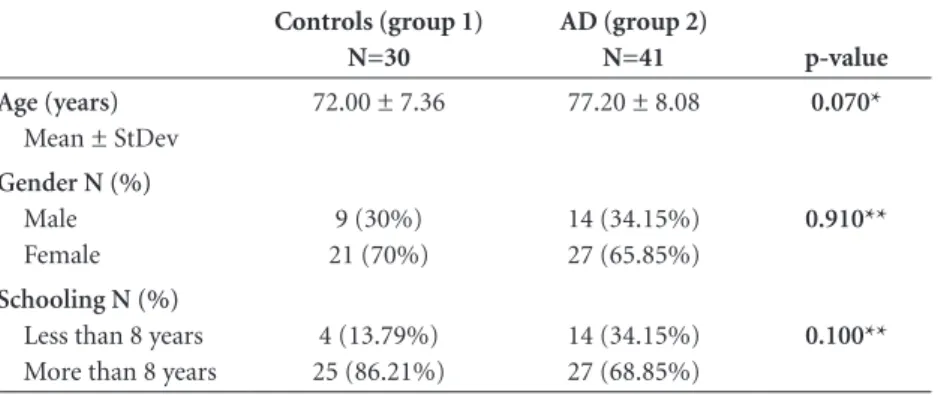
There were no significant differences between the groups in terms of sex, age and schooling (Table 1).
Raicher I, et al. qEEG spectral peak in Alzheimer’s disease 11 Dement Neuropsychol 2008;2(1):9-12
These results revealed that no control subjects had al-pha spectral peak lower than 8 Hz as depicted in Graph 1. A subgroup of 22 patients with AD diagnosis had spec-tral analysis of qEEG and Mini Mental State Examination (MMSE) performed twice, with a year interval before
treat-ment and after anticholinesterase use. The results of the non-parametric Mann-Whitney test are shown in Table 3.
There was no statistically significant difference in MMSE and alpha spectral peak before and after anticho-linesterase use.
Discussion
An important finding in this study was that none of the controls had spectral peak lower than 8 Hz (Graph 1). This points to 8 Hz as one milestone of normality where all values below this on qEEGs were from AD patients. Previous research has shown that low-cost computerized qEEG techniques are able to statistically predict MCI to Alzheimer’s disease conversion,12-14 and could be used for prognostic purposes in early stages15 and during monitor-ing of AD treatment.16-18
This study investigated mainly the alpha qEEG spec-tral peak pattern - before and after cholinesterase inhibi-tor treatment. The qEEG values, performed 6 months and 1 year after medication, agreed with AD patient MMSE scores. All patients selected had good response to
medica-Table 1. Features of 71 patients grouped according to diagnosis. Controls (group 1)
N=30
AD (group 2)
N=41 p-value
Age (years)
Mean ± StDev
72.00 ± 7.36 77.20 ± 8.08 0.070*
Gender N (%)
Male Female
9 (30%) 21 (70%)
14 (34.15%) 27 (65.85%)
0.910**
Schooling N (%)
Less than 8 years More than 8 years
4 (13.79%) 25 (86.21%)
14 (34.15%) 27 (68.85%)
0.100**
*Two-sample t test; **Chi-square test.
Table 2. Mann-Whitney test for alpha spectral peak EEG (group 1 vs group 2).
N Mean StDev Mann-Whitney U p-value
Group 1 30 9.387 0.674 318.5 0.001
Group 2 41 8.34 1.38
Table 3. Mann-Whitney test for cognitive performance and EEG spectral peak before and while undergoing AChEI treatment.
Before treatment Undergoing treatment Mann-Whitney U p-value MMSE
Mean (SD)
23.14 (3.34) 22.73 (4.01) 262.0 0.956
EEG spectral peak Mean (SD)
8.64 Hz (1.37) 8.66 Hz (1.23) 241.5 0.991
5 5.5 6 6.5 7 7.5 8 8.5 9 9.5 10 10.5 11 11.5 12
EEG spectral peak (Hz)
Controls AD
12 qEEG spectral peak in Alzheimer’s disease Raicher I, et al.
Dement Neuropsychol 2008;2(1):9-12
tion and their treatment was associated with no significant differences between the pre-and post-treatment alpha spec-tral peak (Table 3). We did not investigate whether these results were dependent on the medication used (galan-tamine, memantine, tacrine and rivastigmine) because our AD group was small. This limitation could be eliminated in future studies on larger samples.
Conclusions
This study supports two important concepts. First, 8 Hz alpha appears to be the lowest awake spectral peak com-patible with normality. And finally, in a clinical context, qEEG is a valuable diagnostic tool that could prove useful for Dementia follow-up. It can supplement the clinical ex-amination by providing an independent assessment of the response to medication in AD. Alpha spectral peak analy-sis may quantify and measure the therapeutic response to cholinergic drugs. However, definitive validation of this procedure requires study of a larger sample of patients, already underway at our Centre.
References
1. Loeches MM, Gil P, Jimenez F, et al. Topographic maps of brain electrical activity in primary degenerative dementia of Alzheimer type and multiinfarct dementia. Biol Psych 1991;29:211-223.
2. Dierks T, Perisic I, Frölich L, Ihl R, Maurer K. Topography of the qEEG in dementia of Alzheimer type: relation to severity of dementia. Psych Research 1991;40:181-194.
3. Leuchter AF, Cook IA, Newton TF, et al. Regional differences in brain electrical activity in dementia: use of spectral power and spectral ratio measures. Electroencephalogr clin Neuro-physiol 1993;87:385-393.
4. McKhann G, Drachman D, Folstein M, Katzman R, Price D, Stad-lan EM. Clinical diagnosis of AD: report of the NINCDS-ADRDA work group under the auspices of Department oh health and human services task force on AD. Neurology 1984;34:939-944. 5. Diagnostic and Statistical Manual (DSMIII R). 3rd ed.
Ameri-can Psychiatric Association, 1987.
6. Folstein MF, Folstein SE, McHugh PR. Mini-Mental State: a practical method for grading the cognitive state of patients for the clinician. J Psych Research 1975;12:189-198.
7. Brucki S, Nitrini R, Caramelli P, Bertolucci PHF, Okamoto IH. Suggestions for utilization of the Mini-Mental State Examina-tion in Brazil. Arq Neuropsiquiatr 2003;61:777-781. 8. Jasper HH. The ten-twenty electrode system of the
Inter-national Federation. Electroencephalogr. clin Neurophysiol 1958;10:371-373.
9. Hall KS, Gao S, Unverzagt FW, Hendrie HC. Low education and childhood rural residence - Risk for Alzheimer’s disease in African Americans. Neurology 2000; 54:95-99.
10. Roe CM, Xiong C, J. Miller P, Morris JC. Education and Al-zheimer disease without dementia. Support for the cognitive reserve hypothesis. Neurology 2007;68:223-228.
11. Babiloni C, Binetti G, Cassetta E, et al. Sources of cortical rhythms change as a function of cognitive impairment in pathological aging: a multicenter study. Clin Neurophysiol 2006;117:252-268.
12. Rossini PM, Del Percio C, Pasqualetti P, et al. Conversion from mild cognitive impairment to Alzheimer’s disease is predicted by sources and coherence of brain electroencephalography rhythms. Neuroscience 2006;143:793-803.
13. Henderson G, Ifeachor E, Hudson N, et al. Development and assessment of methods for detecting dementia using the human electroencephalogram. IEEE Trans Biomed Eng 2006;53:1557-1568.
14. Yoshimura M, Isotani T, Yagyu T, Irisawa S. Global approach to multichannel electroencephalogram analysis for diagnosis and clinical evaluation in mild Alzheimer´s disease. Neuro-psychobiology 2004;49:163-166.
15. Nobili F, Copello F, Vitali P, et al. Timing of disease progres-sion by quantitative EEG in Alzheimer’s patients. J Clin Neu-rophysiol 1999;16:566-573.
16. Sneddon R, Shankle WR, Hara J, Rodriquez A, Hoffman D, Saha U. QEEG monitoring of Alzheimer’s disease treatment: A preliminary report of three case studies. Clin EEG Neurosci. 2006;37:54-59.
17. Kogan EA, Korczyn AD, Virchovsky RG, Klimovizky SS, Treves TA, Neufeld MY. EEG changes during long-term treatment with donepezil in Alzheimer’s disease patients. M.Y. J Neural Transm 2001;108:1167-1173.