RESUMO.- [Sarcoma de aplicação felino: avaliação da densidade tomográfica e das dimensões tumorais por diferentes métodos.] O sarcoma de aplicação felino (SAF) é uma neoplasia maligna que geralmente apresenta proje-ções digitiformes para planos musculares adjacentes, difi -cilmente reconhecidos ao exame físico, o que pode compro -meter a real identificação das suas margens. Este estudo comparou as dimensões tumorais de 32 SAFs mensurados por diferentes métodos (exame físico e por imagens de to
-mografia computadorizada) e avaliou a densidade tomo -gráfica em unidades Hounsfield de 10 dessas neoplasias, com base em histogramas. As medidas no eixo cranio -caudal foram maiores quando obtidas após reconstrução multiplanar de imagens tomográficas, tanto na fases pré como após administração de meio de contraste (p=0,049 e p=0,041, respectivamente). As medições tomográficas no eixo dorsoventral obtidas na fase pós-contraste tam -bém foram maiores, quando comparadas com as imagens pré-contraste (p=0,010). Estimativas do volume tumoral foram maiores após a fase contrastada. Os histogramas das densidades tumorais tenderam a produzir dois picos: o primeiro no intervalo de valores de densidade gordura e o segundo no intervalo correspondente a tecidos moles. As imagens tomográficas pós-contraste com reconstrução multiplanar demarcaram com mais clareza as margens do tumor e definiram de forma mais criteriosa o seu tamanho. Uma tendência de perfil de atenuação comum para o SAF pôde ser descrita com esse estudo.
TERMOS DE INDEXAÇÃO: Sarcoma de aplicação felino, densidade tumoral, tomografia computadorizada, dimensões tumorais.
Feline injection site sarcoma: computed-tomographic density
and assessment of tumor dimensions by different methods
1Karen Maciel Zardo2*, Lucas Petri Damiani3, Julia Maria Matera4
and Ana Carolina B.C. Fonseca-Pinto5
ABSTRACT.- Zardo K.M., Damiani L.P., Matera J.M. & Fonseca-Pinto A.C.B.C. 2017. Feline injection site sarcoma: computed-tomographic density and assessment of tumor di-mensions by different methods. Pesquisa Veterinária Brasileira 37(10):1113-1118. De -partamento de Cirurgia, Faculdade de Medicina Veterinária e Zootecnia, Universidade de São Paulo, Cidade Universitária, Avenida Prof. Orlando Marques de Paiva 87, São Paulo, SP 05508-270, Brazil. E-mail: [email protected]
Feline injection site sarcoma is a malignant neoplasm with digitiform projections into muscular planes that are ill recognized during physical examination and may compromise tumor margin demarcation. This study compared tumoral size of 32 cats measured by diffe -rent methods, and evaluated the CT density of 10 tumoral tissues (Hounsfield unit) based on histograms. Tumor axes were measured by physical examination and CT images. Larger craniocaudal axis measurements were obtained following multiplanar reconstruction of pre- and post-contrast CT images (p=0.049 and p=0.041 respectively); dorsoventral axis me -asurements taken from post-contrast CT images were also larger (p=0.010). Tumor volume estimates increased following contrast-enhancement. Histograms tended to produce two pe -aks: one in the fat and another in the soft tissue attenuation range. Multiplanar reconstructed post-contrast CT images provided clearer definition of tumor margins and more judicious de -termination of tumor size. A tendency of common FISS attenuation profile could be described. INDEX TERMS: Feline injection-site sarcoma, tumoral density, computed tomographic, tumoral di -mension.
1 Received on October 13, 2015.
Accepted for publication on September 4, 2016.
2 Departamento de Cirurgia, Faculdade de Medicina Veterinária e Zoo
-tecnia (FMVZ), Universidade de São Paulo (USP), Av. Professor Orlando Marques de Paiva 87, São Paulo, SP 05508-270, Brazil. *Corresponding author: [email protected]
3 Departamento de Estatística, Instituto de Matemática e Estatística,
USP, Rua do Matão 1010, São Paulo, SP 05508-090, Brazil.
4 Departamento de Cirurgia, FMVZ-USP, Av. Professor Orlando Marques de Paiva 87, São Paulo, SP 05508-270, Brazil. E-mail: [email protected]
5 Departamento de Cirurgia, FMVZ-USP, Av. Professor Orlando Marques
INTRODUCTION
Feline injection site sarcoma (FISS) is a malignant, locally invasive subcutaneous neoplasm with high recurrence ra -tes (McEntee & Page 2001, Martano et al. 2011). The con -dition was first described in the 1990s when clinicians speculated that severe acute vaccine-associated inflamma -tory reactions progressed to sarcoma. Feline injection site sarcoma has attracted increasing attention in the scientific community ever since (Martano et al. 2011, Srivastav et al. 2012, Sparkes 2013).However, despite several research efforts over the last decades, the etiology of FISS remains undetermined (Woodward 2011, Sparkes 2013).Feline in-jection site sarcomas tend to form digitiform proin-jections that invade deeper muscular planes (Samii 2007, Martano et al. 2011, Carneiro 2012, Travetti et al. 2013) and are sel -dom recognized on physical examination; these projections prevent clear definition of surgical margins and adequate demarcation of radiotherapy fields (VAFSTF 2005). The hi -ghly invasive nature of even small-sized FISSs calls for mul -tidisciplinary diagnostic approaches. Cross-sectional ima -ging modalities such as computed tomography (CT) and magnetic resonance imaging (MRI) are recommended for effective treatment planning (VAFSTF 2005, North & Banks 2009, Martano et al. 2011).
Comparative studies of FISS volume based on CT ima -ges and clinical findings (McEntee & Samii 2000, McEntee & Page 2001, Carneiro 2006, Di Giancamillo et al. 2011, Carneiro 2012, Travetti et al. 2013, Zardo et al. 2013) have failed to reach a consensus. While CT yielded larger mean tumor volume estimates than physical examination in most articles, (McEntee & Samii 2000, McEntee & Page 2001, Carneiro 2006, Zardo et al. 2013) no significant differences were reported in others (Di Giancamillo et al. 2011, Car -neiro 2012). Significantly larger tumor volume estimates from post-contrast compared to pre-contrast CT images have also been reported (McEntee & Samii 2000), but were not confirmed in a later study (Zardo et al. 2013). Although studies investigating FISS CT density are scarce, mean va -lues fall within the soft tissue attenuation range have been reported (Carneiro 2012, Zardo et al. 2013).
This study was designed to: (1) compare the size of FISS lesions estimated by physical examination with correspon -ding CT measurements, and tumor volume estimated from pre- and post-contrast CT images; (2) determine density values and describe common attenuation patterns of FISS lesions based on histograms obtained from pre- and post--contrast CT images. Our hypotheses were that measure -ments made from post-contrast CT images would provide more judicious estimations of tumor size and volume, and that multiplanar reconstruction (MPR) would enable clea -rer definition of tumor margins; furthermore tumor histo -grams would provide additional data for CT characteriza -tion of FISS lesions.
MATERIALS AND METHODS
The information contained in this article was extracted from a Master’s thesis by the first author (Zardo 2014). All animal pro -cedures in this study were approved by the Animal Ethics Com -mittee of the Faculty of Veterinary Medicine and Animal Science
of the University of São Paulo (protocol number 2705/2013); all owners consented to the inclusion of their cats in the study.
This study comprised cats of variable gender, body weight and age. Patient selection was based on the presence of solid masses at injection sites and cytological and/or histological diagnosis of FISS (nonrecurrent and recurrent neoplasms).
The prospective phase included cats referred to the veterinary hospital in 2013 and submitted to physical examination and CT. Tumor size estimation was based on physical measurements of tumor length (craniocaudal axis, CC), width (laterolateral axis, LL) and height (dorsoventral axis, DV). Measurements (cm) were made using a caliper by a single veterinary radiologist (KMZ). CT images were acquired using a helical single-slice CT scanner (Xpress - GX Spiral; Toshiba America Medical Systems) with 120kVp, 150mA, tube rotation time 1.0s., matrix dimensions 512 x 512 and 3 mm slice thickness at 1.5 mm reconstruction intervals. Contrast --enhanced scans were performed 90 seconds after intravenous
bolus injection of iohexol (Omnipaque® 300, GE Healthcare).
The retrospective phase of the study was based on medical records and tomographic imaging of cats scanned at the veteri -nary hospital between 2005 and 2012. Tomographic imaging re -cords were analyzed by veterinary radiologist (KMZ) blinded to previous CT reports. Tumor size data (CC, LL and DV axes) made during physical examination using a caliper were extracted from medical records. CT images were acquired using either a helical single-slice CT scanner (Xpress - GX Spiral, Toshiba America Me -dical Systems, 4 cases) or an axial CT scanner (CT-Max 640, GE Healthcarem 27 cases). Tomographic images (120kVp, 150mA, tube rotation time 1.0s, matrix dimensions 512x512) were acqui -red with slice thickness and increments/reconstruction intervals between 2.5 and 10mm according to tumor size. Contrast-enhan -ced scans were performed immediately after intravenous bolus
injection of iohexol (Omnipaque® 300, GE Healthcare, 2 cases) or
meglumine amidotrizoate and sodium-ionic dimmer (Urografina 292®, Berlimed SA, 25 cases).
Contrast media were administered at 450mg I/kg doses. Images were reconstructed using soft tissue and bone algorithms. Trans -verse CT slices were planned to fully encompass the neoplastic area detected on topograms and extended approximately 3cm beyond perceptible margins, which is the minimal recommended surgical margins (Martano et al. 2011), with cats in sternal recumbency. All digital tomographic images were stored in the PACS (Synapse 4.0, Fujifilm Medical System, Valhalla, New York) and exported into a DICOM viewer (OsiriX Imaging Software 5.8.1 32 bit, Pixmeo).
Tomographic measurements of tumor axes were first taken from pre- and post-contrast transverse CT images, then following MPR of DICOM images in the OsiriX system. Measurements (cm) were standardized as follows. Without MPR: The longest LL and DV axes were subjectively identified in tomographic slices; measu -rements were then made using the “Length ROI” tool. The cursor was aligned according to the obliquity of each tumor. The CC axis was calculated by multiplication of the number of slices where the tumor was visible by the increment/reconstruction interval.
With MPR: The reference line for sagittal reconstruction was pla -ced parallel to the tumor axis in the transverse viewing window and the longest DV axis subjectively identified. The procedure was repeated in the dorsal reconstruction window for subjective iden -tification of the longest CC and LL axes. Measurements were then made using the “Length ROI” tool. Tumor volume (cm3) was esti -mated from pre- and post-contrast CT images using the standard OsiriX procedure with the “Brush ROI” tool.
could be recognized. The export ROIs plugin was then employed to create XML (eXtensible Markup Language) files containing the attenuation values (HU) of each tumor voxel. Files were imported into R® statistical software (R Development Core Team) for histo -gram generation (-300 HU and +300 HU cutoff points).
Statistical analyses were made using software (R®; R De
-velopment Core Team). The level of significance was set at 5%. Continuous variables were described using measures of position (mean, median, minimum and maximum values) and scale (stan -dard deviation - SD). The non-parametric Mann-Whitney test was used to compare continuous variables with two characteristics (the non-parametric test was used due to the small sample size). Repeated measurements (measurements taken from the same cat by different methods) were compared using the paired Mann --Whitney (2 characteristics) or the Friedman (3 or more charac -teristics) test. The paired comparisons were made just with CT images in DICOM format (n=10 cases).
RESULTS
Thirty-two cats were selected in this study. Selected cats were aged between 2 and 15 years (mean age, 10.06±3.63
years) and weighed between 3.4 and 8.8 kg (mean body weight, 5.19±1.2 kg). There were evaluated 16 female and 16 male cats; 5 Siamese and 27 mixed breed cats. A total of 37 CT scans (31 retrospective and 6 prospective) were analyzed. Five out of 37 CT scans corresponded to follow --up assessments. Four patients (retrospective study) were not submitted to contrast-enhanced CT due to chronic renal failure. CT images included in the retrospective study were stored in DICOM or JPEG file format, or printed on film (4, 16 and 11 images respectively). All images acquired in the prospective study were stored in DICOM file format (Fig.1). Most tumors had poorly defined margins (23/37, 62%), with clearer margin demarcation in post-contrast compa-red to pre-contrast CT images. A CT scout view of wide area coverage (about 3cm beyond perceptible tumor margins) was not enough to fully encompass the neoplastic area in 15 out of 37 FISS cases studied (40.5%) and mildly thicke -ned muscular tissues were left out.
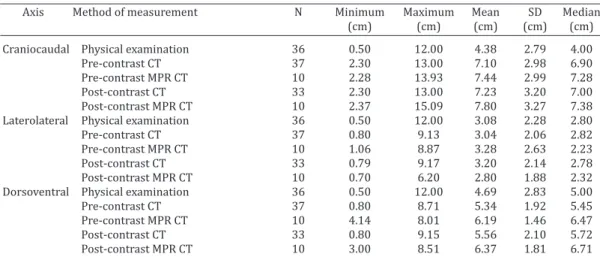
Tumors size according to axis and method of measure -ment is given in Table 1. Physical measure-ments of CC and DV axes differed significantly from corresponding pre- and post-contrast CT measurements (Table 2). This values were submitted to multiple comparisons and physical measure -ments tended to yield smaller tumor length estimates (CC axis) compared to pre- and post-contrast CT (p<0.001, Ta -ble 3). Conversely, post-contrast CT tended to yield larger tumor height estimates (DV axis) compared to pre-contrast CT (p=0.048, Table 3) and physical examination (p=0.041, Table 3). Tumor length (CC axis) was the most discrepant measurement between methods (p<0.001, Table 3). Pre and post-contrast CT measurements performed before and af-ter MPR were compared by Paired Mann-Whitney test (Ta -ble 4). Multiplanar reconstruction yielded larger estimates of tumor length (CC axis) on pre and post-contrast images
Table 1. Descriptive statistics of tumor size according to axis and method of measurement
Axis Method of measurement N Minimum Maximum Mean SD Median
(cm) (cm) (cm) (cm) (cm)
Craniocaudal Physical examination 36 0.50 12.00 4.38 2.79 4.00 Pre-contrast CT 37 2.30 13.00 7.10 2.98 6.90 Pre-contrast MPR CT 10 2.28 13.93 7.44 2.99 7.28 Post-contrast CT 33 2.30 13.00 7.23 3.20 7.00 Post-contrast MPR CT 10 2.37 15.09 7.80 3.27 7.38 Laterolateral Physical examination 36 0.50 12.00 3.08 2.28 2.80 Pre-contrast CT 37 0.80 9.13 3.04 2.06 2.82 Pre-contrast MPR CT 10 1.06 8.87 3.28 2.63 2.23 Post-contrast CT 33 0.79 9.17 3.20 2.14 2.78 Post-contrast MPR CT 10 0.70 6.20 2.80 1.88 2.32 Dorsoventral Physical examination 36 0.50 12.00 4.69 2.83 5.00 Pre-contrast CT 37 0.80 8.71 5.34 1.92 5.45 Pre-contrast MPR CT 10 4.14 8.01 6.19 1.46 6.47 Post-contrast CT 33 0.80 9.15 5.56 2.10 5.72 Post-contrast MPR CT 10 3.00 8.51 6.37 1.81 6.71
Table 2. comparisons of physical, pre- and post-contras ct measurements (cm) of tumor size
Axis Physical examination Pre-contrast CT Post-contrast CT P Value Median 1st quartile 3rd quartile Median 1st quartile 3rd quartile Median 1st quartile 3rd quartile CC 4 2.075 5.25 6.9 4.8 9 7 4.65 9.6 0.001 LL 2.8 1.5 4 2.82 1.5 3.9 2.78 1.52 4.02 0.297 DV 5 2.375 6 5.45 4.08 6.96 5.72 4.44 7.05 0.022 Friedman Test (n=2).
(Table 4, p=0.049; Table 5, p=0.014 respectively) and height (DV axis) on post-contrast images (Table 5, p=0.010). There was no statistical difference between the LL axis measured in this sample. Tumor volume estimates based on DICOM CT image files of 10 cats are given in Table 6. Tumor volu -me tended to be consistently larger when determined from post-contrast compared to pre-contrast CT images (mean difference 1.2cm3, p=0.004; ρ de Pearson = 0.999).
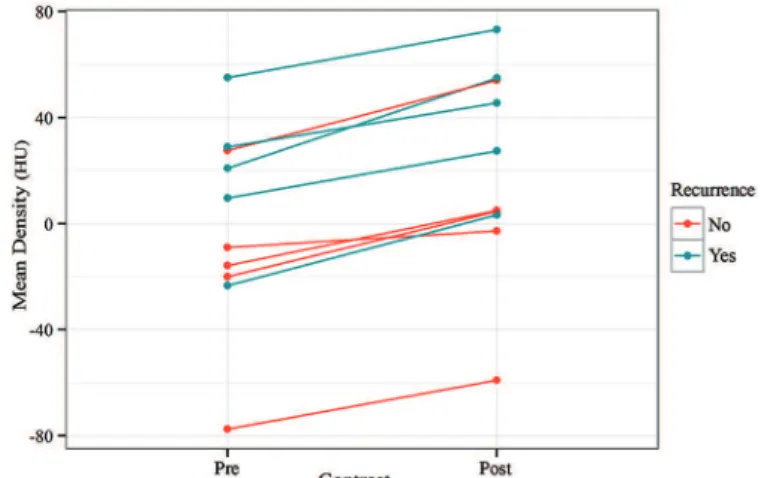
Tumor CT density was expressed as pre- and post --contrast attenuation values (Hounsfield Unit - HU) (Table 7). Significantly higher mean HU values were observed on post-contrast scans in all cases (p=0.002). These values were grouped according to recurrence or nonrecurrence of neo-plasms, and higher mean pre- and post-contrast attenuation values were documented in recurrent (23.29 and 47.66 HU
respectively) compared to nonrecurrent neoplasms (-14.5 and 4.04 HU respectively); however, differences were not statistically significant (p>0.05, Mann-Whitney test). Mean tumor density (HU - Hounsfield unit) in pre- and post-con -trast phases are displayed in Fig.2. Histograms revealed curves with two distinct peaks (Fig.3 and Fig.4): a lower,
Table 3. Multiple comparisons of significant Friedman Tests given in Table 2
Multiple Ccmparisons P value for CC P value for DV Pre-contrast CT x Physical examination <0.001 0.998 Post-contrast CT x Physical examination <0.001 0.041 Post-contrast CT x Pre-contrast CT 0.421 0.048
Table 4. Comparison of tumor axes (cm) measured on pre
--contrast and pre--contrast MPR CT images
Axis Pre-contrast CT Pre-contrast MPR CT P Median 1st quartile 3rd quartile Median 1st quartile 3rd quartile value CC 6.90 4.80 9.00 7.28 6.16 8.26 0.049 LL 2.82 1.50 3.90 2.23 1.55 4.67 0.193 DV 5.45 4.08 6.96 6.47 4.93 7.37 0.084 Paired Mann-Whitney Test (n=10).
Table 5. Comparisons of tumor axes (cm) measured on post
--contrast and post--contrast MPR CT images
Axis Post-contrast CT Post-contrast MPR CT P Median 1st quartile 3rd quartile Median 1st quartile 3rd quartile value CC 7.00 4.65 9.60 7.38 6.27 9.05 0.014 LL 2.78 1.52 4.02 2.32 1.52 3.45 0.554 DV 5.72 4.44 7.05 6.71 4.99 7.81 0.010 Paired Mann-Whitney Test (n=10).
Table 6. Descriptive statistics of tumor volume measured on pre- and post-contrast CT images of 10 cats (DICOM images)
Variable Confidence interval for means (95%) Minimum Maximum Mean SD Median Lower Upper
(cm3) (cm3) (cm3) (cm3) (cm3) (cm3) (cm3)
Pre-contrast volume 1.56 184 53.2 62.42 19.1 8.54 97.9 Post-contrast volume 1.17 187 54.4 63.13 20.1 9.23 99.5 Difference (post- -0.39 3 1.2a 0.99 1.3 0.48 1.9
contrast, pre-contrast)
P value = 0.004 (Paired Mann-Whitney Test).
Table 7. Descriptive statistics of FISS attenuation values (Hounsfield Unit) according to contrast phase
Variable Factor N Minimum Maximum Mean Standard P value* Contrast phase Post 10 -59.0 73.1 20.6 38.6 0,002 Pre 10 -77.5 55.1 -0.4 37.2
Total 20 -77,5 73.1 10.1 38.4 *Paired Mann-Whitney test.
Fig.2. Mean tumor density (HU - Hounsfield unit) in pre- and post-contrast phases. Increased attenuation (HU) in the post --contrast phase can be seen in recurrent and non-recurrent neoplasms.
Fig.3. Histogram showing the frequency of pre-contrast CT atten -uation values in 10 FISSs.
broader peak in the negative attenuation range (fat density; -120 to -80 HU) and a higher, narrower peak in the positive attenuation range (soft tissue density, 40 to 60 HU). Contrast enhancement shifted curves slightly to the right (Fig.4), par -ticularly the second peak, which also became broader and lo -wer. Relatively stable pre- and post-contrast attenuation va -lues in the 0-20 HU range (fluid density) were also observed.
DISCUSSION
In accordance with previous reports (Carneiro 2006, 2012, Sparkes 2013), cats affected with FISS in this study were generally adults and overweight, with no gender or breed predisposition.
The highly invasive computed tomographic appearance of even small FISS lesions support the significance of CT for accurate determination of tumor extension prior to treat-ment (McEntee & Page 2001). As in canine mast cell tumors (Lorigados et al. 2013), CT was a more accurate method of measurement than physical examination in this study, par -ticularly in cases where neoplasms projected into surroun -ding tissues.Moreover, CT recognition of blurring of fat pla -nes, that may represent highly inflamed and vascularized peritumoral tissues or neoplastic infiltration of the panni -culus (Webb 2000), that are seldom detected on physical examination plays an important role in effective surgical planning (Travetti et al. 2013). Tumors in this study appe -ared larger on CT than physical examination, particularly when measurements were taken from post-contrast MPR CT images. Largest discrepancies documented in CC axis measurements between methods may have reflected the inclusion of digitiform projections in tomographic estima-tes of tumor size, easily recognized on CT scans but not on physical examination. Results of the current study support recent CT data (Travetti et al. 2013) suggesting that FISS masses have longer CC and DV axes, in this order. Better understanding of FISS growth patterns and behavior is re -quired to clarify the significance of these findings.
Multiplanar reconstruction yielded larger CC (pre- and post-contrast tomograms) and DV (post-contrast tomogra -ms) axis length estimates in this trial. Three-dimensional CT measurement of neoplastic lesions, particularly those with ill-defined margins, may be challenging(Travetti et al. 2013). Contrast enhancement is recommended for accura -te tumor margin demarcation (Samii 2007) and proved hel -pful for tumor size determination in this study. Multiplanar reconstruction was also vital for accurate measurement of FISS lesions in the sample considered. Tumor length has been shown to be more easily measured in reconstructed CT images(Kinns et al. 2001). Better understanding of pe -ritumoral anatomy in the sagittal and dorsal planes (Kinns et al. 2001)further support the significance of MPR in the assessment of neoplastic lesions.Good quality reconstruc -ted CT images were obtained using 3 mm slices and 1.5 mm increments in this study, despite poorer resolution compa -red to transverse images. Thinner submillimeter slices can improve MPR and increase image spatial resolution in the sagittal and dorsal planes, particularly when multidetector CT scanners are used(Kinns et al. 2001).
Topograms with wide area coverage was not enough to fully encompass the neoplastic area in some FISS cases stu -died and mildly thickened muscular tissues were left out. Referring clinicians should be aware of this fact when plan -ning for surgery. Extension of the topogram 5 cm beyond palpable tumor margins, which is the maximal recommen-ded surgical margins (Martano et al. 2011), is therefore indicated in cases of FISS. Also, larger numbers of tomo -graphic slices should be considered upon recognition of suspected areas.
Highly discrepant mean FISS volumes have been re -ported elsewhere(McEntee & Samii 2000, Carneiro 2006, 2012, Travetti et al. 2013). Accordingly, tumor volume es -timates were highly variable in this study and may have reflected differences in time spans from onset of clinical manifestations to search for veterinary advice by cat ow -ners. Comparative data on mean FISS volume determined by different measurement methods are somewhat conflic -ting. While most studies documented larger mean tumor volume based on CT images compared to physical measu -rements (McEntee & Samii 2000, McEntee & Page 2001, Carneiro 2006), trials involving 33 (Carneiro 2012) and 200 (Di Giancamillo et al. 2011) FISS cases failed to re -port significant differences between methods. In the afo -rementioned studies, volume calculation was either based on common formulas used for geometry figures (e.g. ellip -soid) or not specified. Traditional geometric formulas are designed for regular-shaped figures and may not apply to irregularly shaped tumors such as those in this sample. Hence, tumor volume estimates based on tomographic and physical examination were not compared in this study and only tumor volume estimated by software (i.e. accounting for tumor margin irregularity) from pre- and post-contrast CT images were considered. As previously reported (McEn -tee & Samii 2000), consistently larger tumor volumes were documented in post- compared to pre-contrast CT scans in this study (mean difference, 1.2 cm³). These findings sup -port the value of contrast-enhanced CT in determination of tumor volume and accurate tumor margin demarcation.
Besides aiding in surgical planning, unidimensional and volumetric measurements of neoplasms are advocated for evaluation of clinical responses to chemo and radiotherapy. Despite limitations (e.g. increase in tumor size and volu -me in response to inflammation and positive response of necrotic areas to treatment), therapeutic response assess-ment is still largely based on measureassess-ments of tumor size, particularly in studies comparing new protocols and well --established methods of treatment (Stacchiotti et al. 2009, Lorigados et al. 2013).Magnetic resonance imaging is the gold standard for determination of size and extension of soft tissue sarcomas in humans (Knapp et al. 2005). Future studies including MRI-based measurements of FISS lesions are warranted.
-mented in this study; however, standard deviations were high given the prevailing heterogeneous density of FISS lesions. Highly discrepant minimum and maximum atte -nuation values within the same neoplasm have also been observed in canine mast cell tumor studies (Lorigados et al. 2013).
Higher mean HU in the post- compared to pre-contrast phase was documented in all cases in this sample (Fig.2). Most post-contrast image acquisitions were delayed; the -refore, increased HU may have reflected low contrast wa -shout, consistent with tumor malignancy (Slattery et al. 2006). Specific dynamic CT perfusion studies are required to investigate this hypothesis.
It was thought that non-recurrent neoplasms would have lower attenuation values compared to recurrent neoplasms due to surgical resection of tumor-associated adipose tissue components. Low statistical power (small sample size) precluded detection of such differences des -pite higher mean pre- and post-contrast attenuation va -lues in recurrent compared to non-recurrent neoplasms. Future studies with larger sample sizes are therefore war -ranted.
Patterns on the histograms in this study may have re -flected the combined effects of increased density in respon -se to the pre-sence of contrast medium in the tumor paren-chyma and resulting heterogeneous contrast enhancement. Areas with higher and lower blood vessel density were highlighted in the post-contrast phase; wider attenuation value ranges may have resulted, although with greater frequency variation compared to the pre-contrast phase. Constant values in the 0 to 20 HU range may have reflected areas of liquefactive intratumoral necrosis.
In cases where the time of image acquisition was not standardized (4 cases, retrospective study), curves with si -milar shape but slightly skewed to the left or right might have been expected. However, minor differences in image acquisition time between retrospective and prospectively analyzed tomograms had no significant impact on histo -gram curve shape.
FISS attenuation patterns may vary according to lesion site, histological type and degree of malignancy. Larger sample sizes, comparisons with other types of neoplasms and application of modern multi-detector technology for multiphase dynamic studies and tumor perfusion pattern analysis should be considered in future studies.
CONCLUSIONS
Based on the results of this study, MPR post-contrast CT images provide clearer definition of tumor margins and contributes to judicious determination of tumor size.
Histograms of tumor attenuation values provided a ge -neral overview of FISS tissue composition and a tendency of common FISS attenuation profile was demonstrated in this study.
Acknowledgements.- The authors would like to express their thanks to
National Council for Scientific and Technological Development - CNPq, process n° 301986 / 2013-4, and Dr. Carolina Scarpa Carneiro from the Fa
-culty of Veterinary Medicine and Animal Science, University of São Paulo, for the medical records employed in the retrospective phase of this study.
REFERENCES
Carneiro C.S. 2006. Clincal study of the effect doxorubicin in the feline injection-site sarcoma. MSc Dissertation, Faculty of Veterinary Medicine and Animal Science, University of São Paulo, São Paulo, SP.
Carneiro C.S. 2012. Characterization of patients with feline injection-site sarcoma as body condition score and as to the origin of its formation and their microenvironment. PhD Thesis, Faculty of Veterinary Medici
-ne and Animal Science, University of São Paulo, São Paulo, SP.
Di Giancamillo M., Travetti O., Stefanello D., Zecconi A., Ravasio G. & Grieco V. 2011. The relationship between tumor volume and local invasiveness in feline injection-site sarcoma: a retrospective CT study on 200 cases. Vet. Radiol. Ultrasound 52(2):215-236.
Kinns J., Malinowski R., McEvoy F., Schwarz T. & Ziwngenberger A. 2001. Special softwares applications, p.70-71. In: Schwarz T. & Saunders J. (Eds), Veterinary Computed Tomography. Wiley-Blackwell, West Sussex, UK. Knapp E.L., Kransdorf M.J. & Letson G.D. 2005. Diagnostic imaging update:
soft tissue sarcomas. Cancer Control J. 12(1):22-26.
Lorigados C.A.B., Matera J.M., Coppi A.A., MacEdo T.C., Ladd F.V.L., Sousa V.A.F. & Pinto A.C.B.C.F. 2013. Tomografia computadorizada de masto
-citomas em cães: avaliação pré- e pós-tratamento quimioterápico. Pesq. Vet. Bras. 33(11):1349-1356.
Martano M., Morello E. & Buracco P. 2011. Feline injection-site sarcoma: past, present and future perspectives. Vet. J. 188(2):136-141.
McEntee M.C. & Page R.L. 2001. Feline vaccine-associated sarcomas. J. Vet. Intern. Med. 15(3):176-182.
McEntee M.C. & Samii V.F. 2000. The utility of contrast enhanced tomog
-raphy in feline vaccine associated sarcomas: 35 cases. Vet. Radiol. Ultra
-sound 41(6):575.
North S. & Banks T. 2009. Sarcomas of the skin and subcutaneous tissue: feline sarcomas, p.173-182. In: North S. & Banks T. (Eds), Small Animal Oncology: an introduction. Saunders Elsevier, Philadelphia.
Samii V.F. 2007. The thoracic wall, p.519-524. In: Thrall D.E. (Ed.), Textbook of Veterinary Diagnostic Radiology. 5th ed. Saunders Elsevier, St Louis. Slattery J.M., Blake M.A., Kalra M.K., Misdraji J., Sweenwy A.T., Copeland
P.M., Muelles P.R. & Boland G.W. 2006. Adrenocortical carcinoma: con
-trast washout characteristics on CT. Am. J. Roentgenol. 187(1):W21-24. Sparkes A. 2013. Current thinking on feline injection site sarcomas. 2nd
chance info. Available from <http://www.2ndchance.info/fibrosarco
-ma-Sparkes2013.pdf> Last accessed Sept. 3, 2015.
Srivastav A., Kass P.H., McGill L.D., Farver T.B. & Kent M.S. 2012. Compara
-tive vaccine-specific and other injectable-specific risks of injection-site sarcomas in cats. J. Am. Vet. Med. Assoc. 241(5):595-602.
Stacchiotti S., Collini P., Messina A., Morosi C., Barisella M. & Bertulli R. 2009. High grade soft tissue sarcomas: tumor response assessment: pilot study to assess the correlation between radiology and pathologic response by using RECIST and Choi criteria. Radiology 25(2):447-456. Travetti O., Di Giancamillo M., Stefanello D., Ferrari R., Giuduce C., Grieco
V. & Saunders J.H. 2013. Computed tomography characteristics of fibro
-sarcoma: a histological subtype of feline injection-site sarcoma. J. Feline Med. Surg. 15(6):488-493.
VAFSTF 2005. Vaccine-Associated Feline Sarcoma Task Force, roundtable discussion; the current understanding and management of vaccine-as
-sociated sarcomas in cats. J. Am. Vet. Med. Assoc. 226(11):1821-1842. Zardo K.M., Fonseca-Pinto A.C.B.C., Carneiro C.S., Matera J.M., Sendyk
--Grunkraut A. & Lorigados C.B. 2013. Aspectos tomográficos do sarcoma de aplicação felino. Arch. Vet. Sci. 18(2):34.
Zardo K.M. 2014. Ultrasonographic and tomographic characterization of feline injection site sarcoma. MSc Dissertation, Faculty of Veterinary Medicine and Animal Science, University of São Paulo, São Paulo, SDP. Webb W.R. 2000. Mediastino: anormalidades linfonodais e massas tumo
-rais, p.34-60. In: Webb W.R., Brant W.E. & Helms C.A. (Eds), Fundamen
-tos de Tomografia Computadorizada do Corpo. 2ª ed. Guanabara Koo
-gan, Rio de Janeiro.