DEPARTAMENTO DE ENGENHARIA GEOGRÁFICA, GEOFÍSICA E ENERGIA
High Power PV Pumping Systems:
Two Case Studies in Spain
Isaac Afonso Barata Carrêlo
Dissertação
Mestrado Integrado em Engenharia da Energia e do Ambiente
UNIVERSIDADE DE LISBOA
FACULDADE DE CIÊNCIAS
DEPARTAMENTO DE ENGENHARIA GEOGRÁFICA, GEOFÍSICA E ENERGIA
High Power PV Pumping Systems:
Two Case Studies in Spain
Isaac Afonso Barata Carrêlo
Dissertação de Mestrado em Engenharia da Energia e do Ambiente
Trabalho realizado sob a supervisão de
Luis Narvarte Fernández (IES-UPM)
Miguel Centeno Brito (FCUL)
“Living is a constant process of deciding what we are going to do” José Ortega y Gasset
ABSTRACT
Nowadays there is an energy revolution, the electricity price is increasing and fossil fuels are depleting. These facts are leading to an investment in renewable energies. In agriculture there is a huge necessity to change the electricity source as well as using a more efficient way to pump water. This Master thesis pretends to demonstrate economic viability and technical feasibility of incorporating Photovoltaics (PV) to cover these needs. The aim of this study is to create a way to simulate photovoltaic pumping systems with IESPRO, a tool developed by the Institute of Solar Energy. To do this simulation, the pump model describes the dynamic evolution of the output variable, the water flow rate, as a function of the input variables such as the head, the power and the efficiency. The present work looks at two different case-studies, for two types of irrigation: pumping to water pools and pumping to the grid at constant pressure, Villena and Zújar’s cases, respectively. In addition to the PV sizing, an economic study was done to understand the viability of these systems. In this study different PV systems penetration rates were represented in order to comprehend the real impact of the investment on it. For this it was created an economic tool that optimizes the power fee according to the real consumption as well as the use of PV.
The analysis showed that these two types of water pumping are not only technically available, but also economically. Relatively to the first case, the more profitable is a 100% PV penetration. On the other hand, for the second case (Zújar) the substitution of one or two motor-pump systems is the choice that provides more savings. In this case, more PV penetration is not also advisable, since the application is at constant pressure and PV alone cannot provide that, as well as the fact that this community only irrigates in a few months of the year and because of that the investment in PV systems is more difficult of being amortized.
Relatively to the last chapter of this work, it will be developed a tool (in Matlab) to find the relationship between the additional energy needed to irrigate at constant pressure and the resource variability. The results from this study show us that it is not needed a huge additional capacity to maintain the constant production if were used the threshold strategy.
Keywords: PV Pump, Communities of Irrigation, IESPRO, economic study, energy, PV
Resumo
Hoje em dia assiste-se a uma revolução energética, o preço da eletricidade tem vindo a aumentar e os combustíveis fósseis estão a esgotar-se. Estes factos levam a um investimento em energias renováveis. Na agricultura há uma grande necessidade de alterar a fonte de energia e de utilizar uma maneira mais eficiente para bombear água. Esta dissertação de mestrado pretende demostrar a viabilidade económica e técnica de incorporar energia fotovoltaica (PV) para cobrir estas necessidades. O objetivo deste estudo é criar uma metodologia de simulação de sistemas de bombagem fotovoltaica com o IESPRO, uma ferramenta desenvolvida pelo Instituto de Energia Solar. Para realizar esta simulação, o modelo de bombagem descreve a evolução dinâmica da variável de saída, o caudal, em função das variáveis de entrada como a queda, a potência e a eficiência. O presente trabalho inclui dois casos de estudo, para dois tipos de irrigação: bombagem para reservatórios de água e bombagem para a rede a pressão constante, Villena e Zújar, respetivamente. Para além do dimensionamento fotovoltaico, um estudo económico foi feito para se entender a viabilidade destes sistemas. Neste estudo diferentes taxas de penetração de sistemas fotovoltaicos foram consideradas para compreender o impacto real deste investimento. Com este objetivo foi criada uma ferramenta económica que otimiza a tarifa de potência de acordo com o consumo real e o uso do PV.
A análise demonstrou que os dois tipos de bombagem de água são viáveis dos pontos de vista técnico e económico. Relativamente ao primeiro caso, o mais rentável é uma penetração de PV de 100%. No segundo caso, a substituição de um ou dois sistemas motor-bomba é a escolha que gera maiores poupanças. Neste caso, uma maior penetração de PV não é aconselhável porque a aplicação é a pressão constante e o PV sozinho não consegue garantir isto, para além de que esta comunidade apenas irriga em poucos meses do ano o que faz com que o investimento em sistemas PV seja mais difícil de amortizar.
Relativamente ao último capítulo deste trabalho, uma ferramenta (em Matlab) foi desenvolvida para descobrir a relação entre a energia adicional necessária para irrigar a pressão constante e a variabilidade do recurso. Os resultados deste estudo mostram que não é necessário uma grande capacidade adicional para manter constante a produção se for usada a estratégia da definição de um limite.
Palavras-chave: bombagem fotovoltaica, comunidades de regantes, IESPRO, estudo
Index
ABSTRACT ... i
Resumo... ii
List of acronyms ... v
List of tables ...vi
List of figures ...vii
ACKNOWLEDGEMENTS ...ix
CHAPTER 1. INTRODUCTION ... 1
1.1. Water Pumping ... 1
1.2. PV Water Pumping ... 3
1.3. PV Water Pumping System ... 4
CHAPTER 2. IRRIGATION ... 9
2.1. Irrigation in Europe ... 9
2.2. Electricity cost for irrigation ... 11
2.3. European Market ... 14 CHAPTER 3. METHODOLOGY ... 16 3.1. Technical Analysis ... 16 3.1.1. Input ... 17 3.1.2. Output ... 22 3.2. Economic Study ... 22
3.2.1. PV Water Pumping System cost ... 22
3.2.2. Cost of grid electricity for irrigation ... 23
3.2.3. Electricity Price considering the total or partial replacement with PV ... 23
3.2.4. Economical tool ... 24
3.2.5. Return of the Investment ... 24
CHAPTER 4. Study Cases ... 27
4.1. Villena... 27
4.1.1. Site location and characterization ... 27
4.1.2. Technical simulation for a singular well ... 30
4.1.3. Technical Results ... 35
4.1.4. Land Occupation ... 40
4.1.5. Economical Results... 42
4.2. Zújar... 47
4.2.1. Site location and characterization ... 47
4.2.3. Land Occupation ... 52
4.2.4. Economic/Financial Study ... 53
4.2.4.1. Current consumption scenario ... 53
4.2.4.2. Use of 100% of PV production ... 54
CHAPTER 5. SOLUTIONS FOR STABLE PV PUMPING AT CONSTANT PRESSURE ... 56
5.1. Analysis of the additional energy for constant pressure PV pumping ... 56
5.2.1. Study Case: static generator ... 57
5.2.2. Study Case: 2 axis tracker ... 61
CONCLUSIONS ... 64
List of acronyms
DR Discount Rate
Eff Efficiency
FL Friction Losses
GVA Gross Value Added
H Head
HDT Dynamic Head
HST Static Head
I Investment
IES Solar Energy Institute
IR Interest Rate
IRR Internal Rate of Return
NCY Number of Credit Years
NOCT Nominal Operation Cell Temperature
NPV Net Present Value
NSH Number of Sun Hours
Ρ Density
P2 Mechanical Power
PV Photovoltaic
Q Water Flow Rate
REL Lifting
SPi Sized Power Installed
TCC Total Cost Considered
VAT Value-added tax
Vw Water Volume
Wp Watt-Peak
Y Year
List of tables
Table 1 – Irrigable and irrigated areas by country and irrigated areas finally used for
compilation of the EIM in 2006 [16] ... 9
Table 2 - General Distribution of Land by type of culture (2005) [18] ... 10
Table 3 – Options of Simulation and Typical value ... 18
Table 4 – Characteristics of the pumping system ... 19
Table 5 - IESPRO Menu ... 22
Table 6 – Costs per Wp installed for all water pumping system components... 23
Table 7 – Maximum and minimum temperatures and Irradiation parameters for this local ... 27
Table 8 - Technical characteristics of this field ... 28
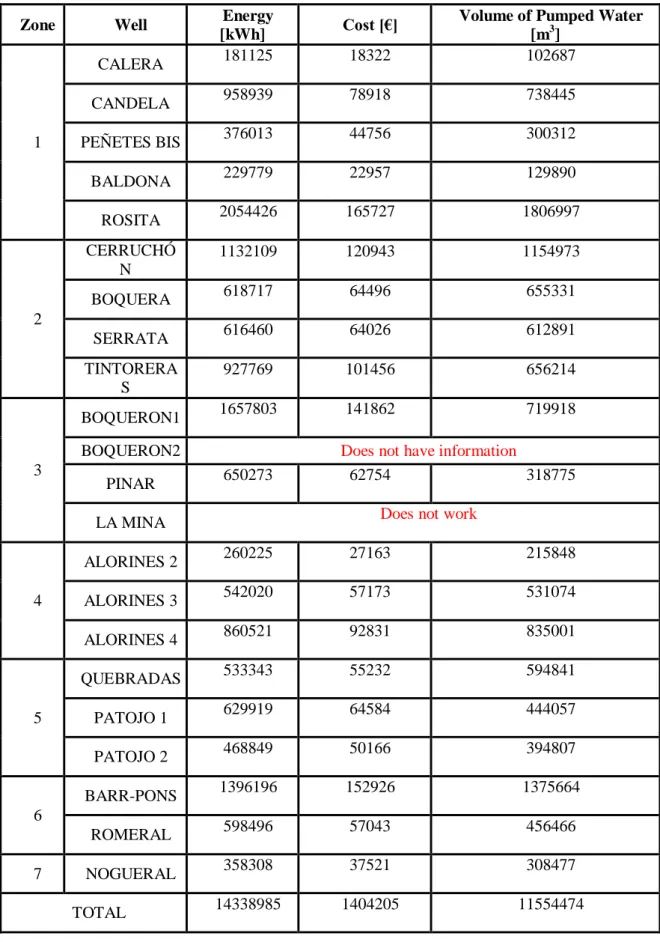
Table 9 – Yearly Consumed Energy, the Volume of Pumped Water and the Cost for each well in 2012 ... 29
Table 10 – Characteristics of the Pump System ... 30
Table 11 –Parameters related with Irradiation and production... 31
Table 12 – Daily energy and hydraulic production, as well as the volume of pumped water ... 33
Table 13 - Characteristics of the PV Water Pumping system for all station of Villena ... 36
Table 14 - Volume of Water Pumped [m3] for each month ... 39
Table 15 - Occupation Land for each well ... 42
Table 16 – Initial Villena’s case parameters ... 42
Table 17 – The investment in PV Water systems needed ... 43
Table 18 – Economical Input Data ... 44
Table 19 – PV Cost and Grid Cost and its investment ... 44
Table 20 – Mean Leveled Cost of Energy as well as the same but represented in m3 pumped for the all 25 years ... 45
Table 21 - Economical Input Data ... 45
Table 22 – Cost of energy if the all 25 years ... 46
Table 23 – Maximum and minimum temperatures and Irradiation parameters for this local ... 47
Table 24 – Station Data ... 48
Table 25 – Considered terms for the considered fee [25] ... 48
Table 26 - Technical Characteristics ... 49
Table 27 – Irradiation and production characteristics ... 50
Table 28 – Daily energy and hydraulic production and the volume of water pumped ... 52
Table 29 – Occupied area in function of the PV penetration... 52
Table 30 – Economical characteristics ... 53
Table 31 – IRR and NPV to the Current consumption scenario ... 53
Table 32 - Penetration profile of PV electricity consumption ... 54
Table 33 - IRR and NPV to the Use of 100% of PV production ... 54
Table 34 - Produced Energy, the Additional Energy and Stored Energy by kW PV power installed for a static PV generator ... 58
Table 35 - Produced Energy, the Additional Energy and Stored Energy by kW PV power installed for a static PV generator ... 60
Table 36 - Produced Energy, the Additional Energy and Stored Energy by kW PV power installed for a static PV generator ... 61
Table 37 - Produced Energy, the Additional Energy and Stored Energy by kW PV power installed for a static PV generator ... 62
List of figures
Figure 1 – Shadoof ... 1
Figure 2 - Archimedes' screw ... 2
Figure 3 - Hydraulic Wheel ... 2
Figure 4 - Electric pump... 3
Figure 5 - PV Water Pumping System ... 5
Figure 6 - Vertical Pump [10]... 5
Figure 7 – Scheme of Pump Operation ... 6
Figure 8 - Water PV Pumping System [13] ... 7
Figure 9 - Matrix with the three payment periods throughout the day (from left to right) and for each month (from top to bottom). Should also be noted that the last line is referred to Saturday, Sunday and national holidays, Model 3.1 ... 12
Figure 10 - Matrix with the six payment periods throughout the day (from left to right) and from the top to the bottom with following order (January; February; March; April; May; 1stFortnight of June; 2ndFortnight of July; August, Saturday, Sunday and National Holidays; September; October; November and December, Model 6.1 ... 12
Figure 11 - Evolution of the Active Energy and the Power fees for 3.1A [15] ... 13
Figure 12 - Evolution of the Active Energy and the Power fees for 6.1. [15] ... 13
Figure 13 - IESPRO Diagram oriented for PV Water Pumping ... 16
Figure 14 - A typical QH-curve for a centrifugal pump: low flow results in high head and high flow results in low head ... 17
Figure 15 - The power consumption curve of a typical centrifugal pump ... 17
Figure 16 - Water PV Pumping System [13] ... 20
Figure 17 - IPUMP general menu ... 20
Figure 18 – IPUMP duty point menu ... 21
Figure 19 – List of motor-pumps for an example ... 21
Figure 20 – Example of Head, NPSH, Efficiency, Shaft Power curves in function of the flow rate ... 21
Figure 21 – Summary of the optimization tool. The first group is the optimized by the program, the second is the actual that they have and the third will be the considered one ... 24
Figure 22 – Characteristics curves to the selected Pump System ... 31
Figure 23 - Sankey Diagram... 32
Figure 24 - Curves of Irradiance, Water flow rat, Efficiency of the Pump and Work Frequency for a typical August day. The horizontal axis represents an entire day where each value represents 10 minutes. ... 34
Figure 25 - Curves of Irradiance, Water flow rate, Efficiency of the Pump and Work Frequency for a typical December day. The horizontal axis represents an entire day where each value represents 10 minutes. ... 35
Figure 26 - Accumulated water along a year ... 40
Figure 27 – Example of a possible scheme of a generator ... 41
Figure 28 - Occupied area in function of PV penetration ... 41
Figure 29 - The Savings, when compared with the actual case ... 44
Figure 30 - Evolution of the energy cost (€/kWh) in 25 years, where grid corresponds to the actual scenario of only grid and the percentages correspond to the different PV penetrations ... 45
Figure 31 - Evolution of the energy cost (€/kWh) in 25 years, where grid corresponds to the actual scenario of only grid and the percentages correspond to the different PV penetrations ... 46
Figure 33 - Possible Configuration for the case 3.2 [26] ... 49 Figure 34 - Sankey Diagram... 51 Figure 35 - Simulation of the cost in 25 years, for the case 3.1 and 3.2, the blue is the 10 years credit and the red, the 25 years credit ... 53 Figure 36 - Simulation of the cost in 25 years, for the case 3.1 and 3.2, the blue is the 10 years credit and the red, the 25 years credit ... 54 Figure 37 - Orange is the power for a pressure and a water flow rate constant, red the threshold and black the limits considered by the threshold ... 57 Figure 38 - Irradiance to a random day (13th May) for a PV Generator in a fixed structure, in Italy ... 57 Figure 39 - Curve of the percentage of energy stored in function of the parameter threshold in Italy for a static PV generator ... 59 Figure 40 - Specific fuel consumption of a 20 kW Diesel generator [27] ... 59 Figure 41 - Curve of the percentage of energy stored in function of the parameter threshold in Italy for a static PV generator ... 60 Figure 42 - Curve of the percentage of energy stored in function of the parameter threshold in Spain for a PV generator with a 2 axis tracker ... 62 Figure 43 - Curve of the percentage of energy stored in function of the parameter threshold in Spain for a PV generator with a 2 axis tracker ... 63
ACKNOWLEDGEMENTS
I am dedicating this chapter to give value and demonstrate my gratitude to all the people, who helped me, motivated me and supported me, in the best way, in this academic life and all that led to it.
First, I want to thank my parents and grandmother Maria, for all the support they gave me in the emotional point of view and the values they passed me throughout my life. It is important to emphasize that, I could not do this thesis without them because, in fact, they were also the people who sponsored me in this adventure.
Secondly, I would like to thank to my two mentors. The first one, more when I was a child, António Sousa, who made me a curious guy that wanted to know everything. And the other, Paulo Santos, that mentored me in the last 8 years and explained me whatever I want, repetitively. Thank you for everything to both of you.
Then I would like to express my gratitude to the people of the Solar Energy Institute (IES). I would like to express a special thanks to two people who marked me and inspired me. First, Professor Luis Narvarte, that from day one, placed enormous confidence in me and supported me and guiding me throughout my experience in Spain. I also have to mention the fact that he included me in every important meetings that the group had and more important taught me the way to organize my ideas. The other person would be Professor Eduardo Lorenzo, for his friendship and his way of seeing the world. The lessons I had (inside the classroom and outside of it), that inspired me and made me want to transmit in Portugal, or in any part of the world, all his teachings as a professor and as person. Both of you are an inspiration to me.
Even in the Institute of Solar Energy is important to refer Ana Peral. Despite not working directly with her, she was the one that advised me to speak firstly with Professor Luis, and I could not be happier with that decision. I also have to thank to Luis Miguel Carrasco, who accompanied me during the thesis, José who also showed great friendship not only inside but also outside the work environment, as well as Rodri, that was always available, Aitor that was beside me in the office and always had a friendly word, Jonathan and Fran for their knowledge. Loreto and Alberto I also would like to thank you. Marcelo and Aimé, I also would like to express my gratitude to you because it is great to share space with people that speak the same language, as well as the fact that you were always there when I need it, since the key to open the door until some programming difficulties that I had. Finally, I would like to thank Remedios that was always nice to me and presented me to all of the group investigators. I also have to mention that I will never forget the way that you all receive Rita! ;).
Also in the Institute I would like to show gratitude to Mariale that with her smile made this year smoother, and to Juan Carlos, that despite knowing him, only for 6 months I could say that I had a friend for life.
Next, I would like to express my gratitude to Rodrigo Silva that accompanied me in this adventure in Madrid for his friendship and loyalty throughout this year.
To Rodrigo, Diana,Vera, Filipa, Rui and Sara my huge thankfulness for making my life richer and for being always there when I need it.
To Carlos, João Bravo, Daniel and João Silva, with whom I spent the last 5 years, I would like to thank you for all the discussions that we had and all the things that we passed together.
From my Faculty I would also like to highlight 3 people. The first should be Ivo Costa, that since the FCUL he was always ready to help me out in everything. And as I always said, it existed an Erasmus pre-Ivo (), with Ivo () and post-Ivo (). Then I would like to express my gratitude to Professor Jorge Maia Alves to whom there is no dream that cannot be truth. Finally, to Professor Miguel Brito that since my second year I considered him as a friend when he gave of his time to talk to me and gave me the strength that I needed. I also have to thank him to get me the opportunity to come to Madrid and to always cheer me up when it was necessary.
And finally, everything that we do in this life must start in an amazing way and finish in the same way. That is why I will finish the chapter of acknowledgments with Rita. Rita was the first person I met in the university. She was and she is everything to me. She was my “study guide”, my best friend, my confident, my love, my everything. If I am here is because of you. You are the one! Thank you! I love you.
CHAPTER 1. INTRODUCTION
The aim of this thesis is to prove the viability of incorporating PV at existing grid-connected pumping systems and to demonstrate their technical and economic competitiveness with the partial or complete substitution of the grid. It will be presented two study cases that represent the major types of irrigation, to a pool and at constant pressure, Villena and Zujar’s cases, respectively. Another fact that will be discussed in this thesis is the relationship between the additional and the stored energy needed to irrigate at constant pressure, and the variability of the solar resource.
1.1. Water Pumping
Water pumping has a long history. As far as man knows, since 2000 BC1 [1], when the Egyptians invented the shadoof2 to raise water (Figure 1), different ways to pump water have been developed. This first system consists of a long pole balanced on a plank placed over a meter above the ground. It has a basin and a counterweight, which helps reaching the water. It is a comfortable invention to minimize human effort, particularly when the needed water amount is small. Today the shadoof still can be seen in many places, mainly in the African continent.
Figure 1 – Shadoof3
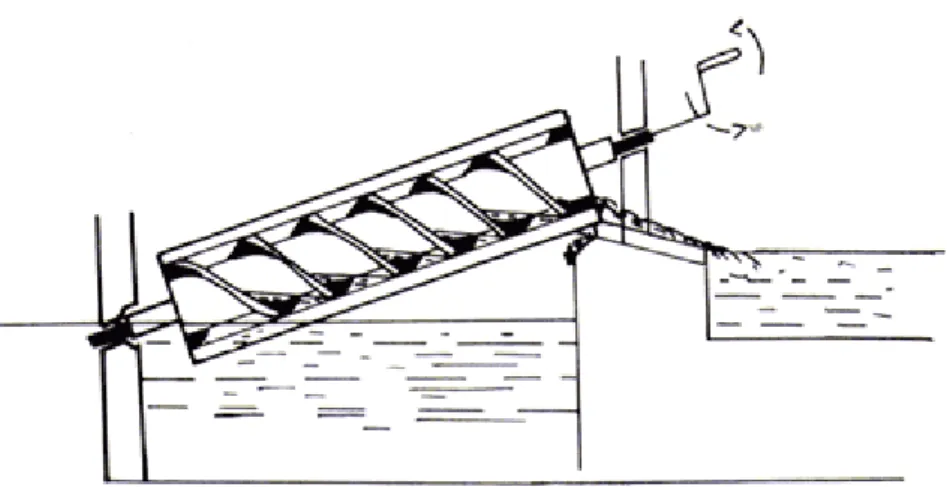
In the third century BC, the use of the Archimedes’ screw was widespread (Figure 2). It is essentially a screw inserted in a hollow cylinder. The bottom of the cylinder is placed in water and the screw rotates. This movement will slide up the water along the screw until it comes out from the upper end of the cylinder. Even today it is quite common to see this type of pump in wastewater treatment plants [2].
1 Before Christ 2 Irrigation tool 3 http://www.fao.org/docrep/010/ah810e/AH810E05.htm
Figure 2 - Archimedes' screw4
Although the wheels and hydraulic wheels (Figure 3) were invented in the third century BC, their usage only arised in the eleventh century AD5. The system consists on wheels that took advantage of the strength of men or animals to draw water [2].
Figure 3 - Hydraulic Wheel6
At the end of the nineteenth century AD all pumps were powered by steam. In the middle of 20th century these pumps were replaced by electric pumps (Figure 4) [2].
4
http://fineartamerica.com/featured/archimedes-screw-granger.html 5
Anno Domini, After Christ 6
Figure 4 - Electric pump7
The shadoof, the Arquimedes’ screw and the hydraulic wheel are still in use. However, today´s pumps, the electric ones, are more efficient and some of them are also “environment friendly” if powered by solar or wind energy instead of fossil fuels [2]. The present work is about solar photovoltaic water pumping, which will be thoroughly analyzed in the next subchapter.
1.2. PV Water Pumping
The water pumping powered by photovoltaic (PV) energy is in progress since 1978 [3]. Firstly, it was considered as stand alone systems and it has been used to provide drinking water. Since the price of the electricity soared, as well as the price of the oil, PV solutions are increasingly competitive not only for drinking water supply in isolated areas but also to livestock watering and irrigation/agriculture.
According to Kyocera Solar [4], there are issues besides the cost of energy that also contribute to this development such as the low maintenance, the reliable long life, the fact that this kind of projects are easy to install, the low recurrent costs and its modular characteristic (as they have the possibility to increment the system power by adding more modules).
The PV water pumps are used mainly in regions with good levels of solar irradiation and where the transport of fuel or the grid connection is too expensive. However, this work shows that these criteria are not so strict. The South European countries can be part of this development due to its high irradiation levels and to the growth of electricity and oil prices.
To understand the importance of this kind of systems in photovoltaic industry, according to literature [5], in 1994, 70MWp had been sold, from which 17% were to be used in PV Pump
application [6]. As already mentioned, this kind of system appeared as standalone applications. Most of this deployment was the result of many investments programs. There were two relevant cases where the Institute of Solar Energy took apart, one of them as a partner, the PRS [7][8], and the other as director, in one MEDA project [7][8].
The PRS (SRP or Sahel Regional Program, in English) [7][8] was a program supported by the European Union that had the goal to install 600 PV pumps (1.2MW), between 1990 and 1998, in the Sahel8. In this the responsibility of the Institute was the development of technical
7
http://www.caprari.it/en/_products/products.jsp?idType=89 8
The Sahel is the ecoclimatic and biogeographic zone of transition in Africa between the Sahara desert to the north and the Sudanian Savanna to the south.
specifications to guarantee the quality of the PV pumps [7][8]. All the others responsibilities, such as supply and installation were done by a regional group. The related hydraulic infrastructure was to be provided by each country, which delegated to the local authorities. The problem here was that they did not have any experience with this kind of projects, and for that reason later evaluations demonstrated that important defects were found in two thirds of the pumps [8][7].
The MEDA program (MEsures D'Accompagnement, French meaning for accompanying measures) was coordinated by the Institute of Solar Energy. This program [7][8] consisted in the sizing and installation of 52 PV Water pumping systems, in a total of 256kW, distributed in Algeria (10 systems/59kW), Morocco (29 systems/138.7kW) and Tunisia (13 systems/58.3 kW). In this case, the installation of the water pumps was done by Isofotón and executed by local teams. The hydraulic infrastructure was responsibility of the local authorities [8][7].
Other relevant examples include Mali (40 systems, in 1990), India (500 systems, in 1995 and 3320, in 2000) and Filipinas (150 systems) [3].
According to Murdoch University, there are more than 10000 solar powered water pumps in use in the world today[9]. In developing countries they are used extensively to pump water from wells and rivers to villages for domestic consumption and irrigation of crops. Nowadays, companies such as Lorentz, Grundfos or Caprari, for example, are able to commercialize PV water pumping solutions. Because of this, this kind of systems are now scattered throughout the world. However, It was not possible to get real numbers in the principal institutions, such as the Euro – Mediterranean Irrigators Community, the International Commision on Irrigation and Drainage, the Food and Agriculture Organization, the International fund for Agricultural Development and the World Water Partnership.
In order to fully understand the PV water pumping is essential to know their components and main features.
1.3. PV Water Pumping System
A photovoltaic pump system is constituted by the photovoltaic arrays, with or without tracking, the motor and the pump, the water storage - that is often elevated - and the water point (Figure 5).
Figure 5 - PV Water Pumping System
The pump normally used to agriculture applications is the centrifugal pump, because of its robustness, effectiveness, the fact that it is well-described and it is produced in any part of the world at an inexpensive cost. Technically, the capacity of pumping at low water flow rates (2 or 3m3/h) and high rates (5700 m3/h) and total heads in maximum around the 300 m made them perfect to this kind of application. In this family of pumps, it is used the vertical turbine pumps, because it saves floor space [10].
Figure 6 - Vertical Pump [10]
The principle of these machines [11] consists in the increase of pressure by mechanical energy produced by the motor to the water over the rotor. The water falls from the center of the rotor to their blades, which leads to a fluid velocity increases by the centrifugal effect. This kinetic energy is converted in pressure, which will raise the water.
Figure 7 – Scheme of Pump Operation9
Besides the centrifugal pumps, it also exists the positive displacement pumps, which have an expanding cavity on the suction side and a decreasing cavity on the discharge side. Liquid flows into the pumps on the suction side that expands and the liquid flows out of the discharge and the cavity collapses, for this reason, the volume is constant. However this kind of pump must not be operated against a closed valve on the discharge side of the pump because it has not a shut-off head like centrifugal pumps, and for that reason it will continue to flow water until the pressure in the discharge line are increased until the pump is severely damaged. A relief or safety valve on the discharge side of the positive displacement pump is therefore absolute necessary. The problem of these pumps is the range of water flow rate, the maximum is around 200 m3/h [10], that is not enough to this kind of applications that will be analyzed.
Normally, these systems work in alternating current (AC), so the PV arrays that work in direct current (DC) have to use a frequency converter, which invert the tension from DC to AC and vary the frequency.
The PV generator [8] is formed by a set of PV modules electrically connected to inject the power that was sized in direct current coupled with a support structure. The PV generator can have a tracking device or being fixed. For the PV Water Pumping systems that I will study the type of tracker considered is a single axis (North-South) that tracks the sun from East to West. This is considered because its production curve is the one that better fullfil the irrigator’s community needs. The solution of a dual axis tracker allows tracking along both axis, not only East-West but also North-South, however the investment cost is higher and it will produce more than the need[12].
The third part that has to exist is the motor. This is an induction electrical motor that will be connected with the pump.
It is important to know the daily required water volume, which is related not only to the pump or the water pool but also to the water supply. It is important to take into consideration the
9
http://ffden-2.phys.uaf.edu/212_spring2011.web.dir/Crockett_ColeT/Physics%20of%20Fireground%20Hydraulics%2 0Pump%20Construction.html
rebound effect. As there is more water available, the people’s water use changes and it is therefore necessary to pay attention to the possible consumption increase that could contribute to an unexpected water restriction.
Relatively to the well [8], it is necessary to know the static water level (HST) which is the
water level without pumping. Another value that is important to size (or to know) is the dynamic water level (HD), related to the level of water decreased with the consumption, as can
be seen in Figure 8. According to literature [8], this decrease of the water level could also be related to the permeability of the soil, the percolation of the well or the length of the aquifer.
Figure 8 - Water PV Pumping System [13]
According to M. Alonso Abella [14] there are 3 types of PV Water Pumping, systems, classified according to the range of power:
1. Low power systems (50-400Wp), that use a DC motor connected to a positive
displacement pump. Between the photovoltaic generator and the motor a DC/DC converter to improve their coupling is inserted.
2. Medium power systems (400-1500Wp) may use a centrifugal pump connected to a
frequency converter or can be based on a brushless motor.
3. High power systems (>1500Wp), using frequency converters. These systems are
particularly suitable for irrigation.
This thesis will be about this third group. The use of frequency converters allows the utilization of standard motor pumps and thus the use of high power pumps. But other challenges arise, such as the compatibility between high power and the variability of the sun irradiation, which results in instability in the control and thus low system efficiency. Problems in the
hydraulic system (such as water hammer10) and the impossibility of using these converters for constant pressure irrigation applications are also unresolved issues.
The use of large PV pumping systems for irrigation requires mitigating or even eliminating its variability and, also, the adaptation of the control of standard frequency converters to the specific requirements of PV without the need of extra devices.
The elimination of this variability of PV generation is being addressed for other applications, e.g. grid-connected PV plants to avoid disturbances to the grid using converters [15], or through the integration of batteries, but this solution is still too expensive for market solutions.
According to [15], these converters use transistors that permit to increase the power by switching frequency in order to extract more energy and fulfill the connecting standards. These converters must have a PID11 control that able to detect situations and take the appropriate measures in order to protect persons and equipment.
UPM has proposed an alternative approach developing a small scale prototype (20 kW PV) pump with a frequency converter like the ones refered before that was validated in a real borehole of 250 m pumping to a 50,000 m3 pool.
However another propose of this master thesis is to verify the relationship between the additional and the stored energy needed to irrigate at constant pressure, with the variability of the solar resource. Until now, it is referred that this source variability is a huge problem in this kind of application, however it is important to quantify this. This will be done in the last chapter of this work.
10
Pressure variations due to flow variations caused by some disturbance, voluntary or involuntary, which is imposed to the flow of liquids in pipes, such as opening transactions or closing valves, mechanical failure of devices protection and control [29]
11
A proportional-integral-derivative controller (PID controller) is acontrol loopfeedback mechanism(controller)
CHAPTER 2. IRRIGATION
2.1. Irrigation in Europe
Agriculture is considered the principle responsible for water consumption. In Europe, water demand for agriculture depends essentially on the climatic conditions of the country and the type of crop. In the European Union, in 2003, the total area equipped for irrigation was 16 million ha on a total of 182 million ha of agricultural land [16]. It is important to notice that the Mediterranean countries (Portugal, Spain, France, Italy and Greece) account for 75% of the first value, 12 million ha (Table 1), with a corresponding yearly energy demand of about 24000 GWh[17] . In these countries, irrigation is an essential element of agricultural production but it could lead to exceed the natural limit of the availability of the water resources.
Table 1 – Irrigable and irrigated areas by country and irrigated areas finally used for compilation of the EIM in 2006 [16] Country Country Irrigable Area (ha) 2000 Irrigated Area (ha) 2000 Irrigable Area (ha) 2003 Irrigated Area (ha) 2003 Irrigated Area (ha) EIM AWA (%) AT Austria 95240 90420 34230 35900 2.7 BE Belgium 31970 21110 1610 1610 0.1 BG Bulgaria 124480 79370 79370 19.6 CH Switzerland 43820* 74.5 CY Cyprus 44930 35410 35410 0.8 CZ Czech Republik 39380 16450 16850 26.4 DE Germany 234587* 2.9 DK Denmark 446930 448810 201460 201460 2.2 EE Estonia 0 14.9 ES Spain 3475560 3233020 3135930 2849830 3233020 0.5 FI Finland 88140 100480 0 0 87.8 FR France 2633350 1575520 2233110 1656780 1575520 3.9 GR Greece 1321340 1161000 1487210 1278950 1161000 13.7 HU Hungary 308110 67080 242160 148680 67080 - IE Ireland 0 0 0 0 0 18.3 IT Italy 3855960 2453440 2902000 1746990 2453440 1.9 LT Lithuania 250 0 0.3 LU Luxemburg 0 0 0 0 0 - LV Latvia 450 0 450 0 0 0.8 MT Malta 2000 1850 1850 9.7 NL Netherlands 498280 350560 62150 62150 80.1 PL Poland 98450 46920 46920 11.8 PT Portugal 792000 674820 229910 229912 7.8 RO Romania 1510830 400420 400420 2.1 SE Sweden 136730 188440 53450 53450 64.9 SI Slovenia 2230 1880 1880 1880 5.6 SK Slovakia 225310 110670 209060 104540 110670 UK United Kingdom 950 (1) 96120(1) 96120(1) 148019* - (1)
Statistics were complete * National sources
For the particular case of Spain, the area that is used for agriculture is 248000 km2 (Table 2) which corresponds to 49% of the total territorial area. In this farming land, 13% of the agricultural production of all member states of the European Union is produced [18].
Table 2 - General Distribution of Land by type of culture (2005) [18]
Spain
Culture type Area [ha] Culture type Area [ha]
Cereal grain 6 840 985 Citrus fruit 306 557
Legumes 410 730 No citrus fruit 1 062 142
Tubercle 72 420 Vineyard 1 149 749
Industrial 728 898 Olives 2 456 719
Fodder 852 630 Other Woody crops 59 940
Vegetables 199 668 Greenhouses 16 218
Flowers and plants 1 707
Total arable crops 7 107 038 Total Woody crops 5 051 325
Fallow 3 319 193 Surface greenhouse 65 218
Kitchen gardens 100 904
Other farmland 3 319 193 Other farmland 166 122
Total arable land 12 426 231 Total cropland 17 643 678
Grassland 7 329 335
Surface wooded forest 11 546 276
Other surfaces 13 968 521
Geographic area 50 487 836
According to the National Irrigation Plan, Horizon 2008, published by the Ministry of Agriculture, Fisheries and Food in 2001, the number of existing Irrigation Communities in Spain stood at 7196.
2.2. Electricity cost for irrigation
“Energy is essential for Europe to function, but the days of cheap energy for Europe seem to be over. The challenges of climate change, increasing import dependency and higher prices are faced by all EU members” [19].
Irrigation is more and more dependent on energy, due to the modernized irrigation systems [20] that exist in the present. More specifically in Spain, there were things that contributed to this dependence, such as, the abolition of the special electricity of high and low voltage for irrigation (2008), as well as the liberalization of the Spanish electricity market (2007)[20]. Accordingly to literature [21], the energetic consumption had increased from 206 kWh/ha in 1950 to 1560 kWh/ha in 2007. And the energetic price since the liberalization of electricity has increased 80% [22].
The user, as in every electricity contract, has to pay two major fees: the power fee and the active energy fee. There are two major types of tariffs that the communities of irrigators in Spain can contract, one is the model 3.1 (Figure 9) and the other, the 6.1 (Figure 10). The first digit corresponds to the number of periods that it has. These ones correspond to the divisions that the day has and each one has a different price.
The active energy fee that the user will pay is the product between the energy that was consumed (measured by the electricity meter) and its price for the correspondent period.
The power fee is the fee that the user has to pay for having a guarantee of power, this is, to be sure that at any time of the day it is possible to access to a maximum amount of power. However, it is important to note that if they exceed the contracted power, the grid will give it, but paying a penalty. Finally, it is important to mention that the user can contract any power term as long as the last period is greater or equal than the previous one and that it is possible for the user to change these terms in a yearly basis. This can be calculated as the sum of product of the contracted power in each period.
Figure 9 - Matrix with the three payment periods throughout the day (from left to right) and for each month (from top to bottom). Should also be noted that the last line is referred to Saturday, Sunday and national holidays, Model 3.1
Figure 10 - Matrix with the six payment periods throughout the day (from left to right) and from the top to the bottom with following order (January; February; March; April; May; 1stFortnight of June; 2ndFortnight
of July; August, Saturday, Sunday and National Holidays; September; October; November and December, Model 6.1
For the particular case of irrigation, the price of energy (€/kWh) is increasing very fast: from 2008 to 2013 it increased 1250% in Spain, 226% in Portugal and 32% Italy [23]. This increase in the price of energy creates the conditions for change of behavior of irrigators.
Figure 11 and 12 present [15] the evolution of the price of the electricity in Spain for the most common two types of fee used to irrigation the term 3.1, in the Figure 11 and the 6.1 in Figure 12, for two irrigator’s communities.
Figure 11 - Evolution of the Active Energy and the Power fees for 3.1A [15]
More detailed, it is possible to verify that between 2007 and 2012, relatively to the Figure 11, an increasing of the power fee of 75.2% for all the periods and 224%, 207% and 112% for all the periods of the active energy fee.
Relatively to the Figure 12, it is possible to see the evolution of the both costs. Relatively to the power fee, this increment is around the 81% for all the periods and the 390.1%, 291.8%, 134.1%, 76.3%, 81.4% and 41.3%, to all the periods, respectively for P1, P2, P3, P4, P5 and P6 periods.
As it was referred before, these results are only for two irrigator’s communities but are expected to reflect a more general description of irrigation energy costs in Spain and perhaps in the others Mediterranean Countries.
On the other hand, it highlights the importance to the communities to consume the energy in the right time to pay less. It is in here that PV systems earn more importance because the hours of more solar production correspond to the periods that are more expensive (Power and Active Energy fees), for that it is possible to the communities to contract a power term in this period of a lower power.
To emphazise the impact of the irrigation communities, after ADIF (Administrador de Infraestructuras Ferroviarias in Spanish, or Railway Infrastructure Administrator, in English) they are the major consumers of electricity in Spain. In the irrigation, as time goes by, it is necessary more energy (in this case electricity) to pump the water because not only the necessities are increasing but also it is necessary to pump from deeper wells. This case brings us to the real importance of the energy.
2.3. European Market
As already known, the electricity price has dramatically increased year after year and, currently, the mean price paid for the electricity supplied by the grid is 100€/MWh. If this number is taking into account and as referred before, the consumption is about 24000GWh/year, irrigators spend about 2400M€ per year.
Take into account the annual consumption considered before, with the intention of satisfying this electrical demand, it would be needed to install 16 GW of PV pumps. Considering an estimated cost of 1.5€/Wp, this could represent a latent market in the South of Europe of
24000M€ in terms of high power PV pumps to supply this electrical need. Without considering the interest rates of the credits or the increase of the price of the electricity, in 10 years this investment was sold. It is important to refer that these systems are prepared to work for 25 years.
Instead, the water that is consumed year after year for irrigation is reducing, once the industry is modernizing the irrigation technologies. For example, in the last years in Spain the water consumption has reduced from 7000 m3/ha to 5000 m3/ha (28% of reduction). The price to pay for this modernization is the use of more energy as seen before. The lack of water, along with the need to maintain the agricultural activity, is forcing the need for the use of more efficient technologies for irrigation. The objective is, with low energy irrigation systems, to reach a mean figure of 3500 m3/ha. It is estimated that for this application the market is estimated in 800 M€/year during the next ten years in the South of Europe.
Moreover the fact that this work is about the previous case, the market for photovoltaic irrigation is not restricted to the South of Europe but also to many other regions in the world where the electrical grids are not extended or even in places that use diesel pumps, with a high cost, related not only with the increase of the cost of the oil, but also the transport of that to remote areas.
As referred previously, this work is about high power PV pumping. For instance, the Institute of Solar Energy in conjunction with the Polytechnic University of Madrid produced a small scale prototype with 20kW PV pump, financed by the Spanish Government able to pump 50000 m3 to a water pool or an amount of them. The problem related to PV power variability was solved and comparing the previous cost of pumping with the grid with the actual cost with the PV prototype, the kWh cost reduction was around 60%. According to that, the Institute of Solar Energy pretend to extrapolate the use of a system like this one, to others communities of irrigators, and be able to reduce their costs with electricity. The first study of this master thesis will have as basis this prototype.
CHAPTER 3. METHODOLOGY
3.1. Technical Analysis
The technical performance of PV pumping systems was developed using the IESPRO tool. This is a software tool developed in Matlab, which can analyze the energy produced by any photovoltaic system, of any technology, in any place in the world. In this software, factors as shadows or dust, or even spectral response in the modules, are taken into account.
In the last year, a new functionality was also developed by the Institute (see Figure 13) oriented to PV Water Pumping. It uses geographical and meteorological data, PV modules and generator characteristics and motor and pump characteristic curves as input to give the user the following information: energy production, water volume pumped, Sankey diagram and the intermediate parameters.
Figure 13 - IESPRO Diagram oriented for PV Water Pumping
The software works as follow:
1. It calculates the electrical power delivered by the generator assembly to the pump motor.
)
1
(
)]
(
1
[
)
,
(
C * RVN * C C* G,25* CAB_DC DCT
T
PER
G
G
P
P
T
G
P
(1)2. Where, P* is the nominal power of the generator, PRVN is the relationship between the
output power and the power for STC. G is the irradiance in the generator and G* is the 1000 W/m2. The γ is the coefficient that permits to calculate the power variation with the temperature. Tc is the current cell temperature and the Tc* is 25ºC. Finally, the
PERCAB_DC that represents the losses in the cables.
3. It uses information about solar radiation and ambient temperature of the place (provided, for example, by the PVGIS database); photovoltaic generator (rated power, coefficient of variation with temperature, Nominal Operation Cell Temperature
Input
•Geographical Data •Meteorological Data •PV Modules and Generator
Characteristics
•Motor and Pump Characteristics Curves
Process
•Simulation Options •CalculusOutput
•Produced Energy
•Volume of Water Pumped •Sankey Diagram
(NOCT), layout of bypass diodes, type of activity and geometry) and inverter (relationship between efficiency and power).
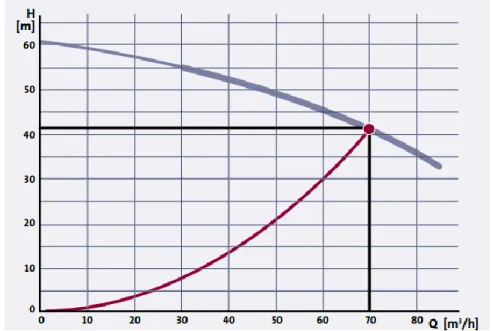
4. It calculates, for a given height, the relation between the electrical power delivered to the motor and the water flow to the pump outlet. It uses the information provided by the manufacturer of the pump on the H-Q curves (see Figure 14).
Figure 14 - A typical QH-curve for a centrifugal pump: low flow results in high head and high flow results in low head
Also from the manufacturer it is possible to get the P2-Q curve (see Figure 15) at rated speed and engine efficiency in terms of its mechanical output power that the user had introduced.
Figure 15 - The power consumption curve of a typical centrifugal pump
5. Through the results of the previous step, it can calculate the water flow. The water pumped in each month will correspond to the integral of that water flow during the period considered.
3.1.1. Input
In the IESPRO, there are inputs related to the whole system and others only related to the motor-pump system. First of all, the user has to define the geographical data, such as the
coordinates and its elevation. These data could be obtained, for example, through the PVGIS12 platform. Next, it is necessary to define the meteorological data for the area in question. From the Meteorological Agencies, or again from PVGIS, it is possible to get all the information needed, such as monthly average daily irradiance, monthly average maximum daily temperature, monthly average minimum daily temperature, link turbidity and wind speed. After this, the user has to parameterize the generator data, where all the standard test conditions have to be defined, as well as the efficiencies at different irradiances, and the technology. There is also a parameter for the losses that are divided in AC and DC components. It is possible for the user to get this data from the datasheet of every element or even using the predefined ones. Then the user has to define some simulation options that are available in the next table, Table 3.
Table 3 – Options of Simulation and Typical value
Option of Simulation Possible Values
Tracking Type Static Structure, Horizontal Axis, Azimuthal
Axis, 2 Axis
Degree of contamination of the PV
generator Degree of Contamination (0,2,3,8%)
Simulation of a static generator oriented to Equator and the optimal
slope
Yes, No
Time range to the calculation 15 minutes (it can be chosen any value)
Spectral Response Yes, No
Daily Correlation KD-KT Page, Erbs, Macgnan
Hourly Correlation KD-KT Orgill-Hollands, Erbs
Diffuse Model Isotropic, Anisotropic (Hay), Anisotropic
(Peréz)
Simulation for the average day, clear
day or input data Clear, Mean, Worst day
Simulation with wind data (PV
Concentration) Yes, No
Shading models Optimist, Pessimist, Classic, Martinéz et al
Day time change from summer to
winter Yes, No
Day time change from winter to
summer Yes, No
All these options of simulation have a variety of selections, for example in the first case, once the user choose the type of tracker, he or she will have to define other parameters related to that, such as the inclination, the distance between generator or even the maximum inclination.
Once all these parameters are defined it is necessary to specify the motor-pump system parameters. These parameters are described in Table 4. And their value depends from well to well.
12
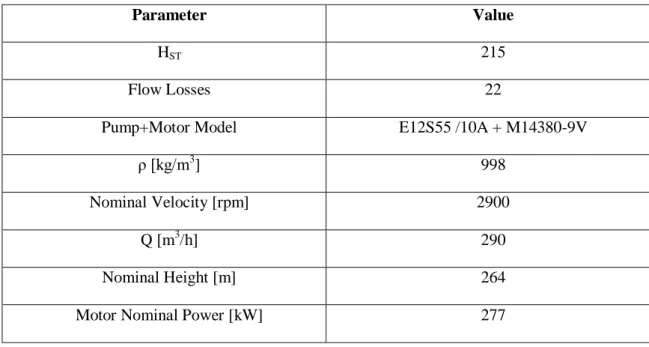
Table 4 – Characteristics of the pumping system Static height Friction losses Water density Nominal speed Water flow Nominal height Motor nominal power
Through the characteristic curve with variations of the water flow, height, power and motor efficiency, with six points of each parameter across the application range, the software does a polynomial fit to these data.
If not all parameters are known, by knowing the demand of water that the irrigator’s community wants to pump, it is possible to start the selection of the system. First it is necessary to define the mean flow rate (Q that is expressed in m3/h) of the application that is calculated with the following equation (Equation 1):
(2) where Vm (in m 3
) corresponds to the volume of water pumped in each month, and NSHm (in
hours) is the daily average number of sun hours, for every month. With this value, the total head (Ht), can be calculated as the sum of the Dynamic Head (HD, expressed in meters and the
Figure 16 - Water PV Pumping System [13]
HD+E (See 16) (2)
Then it is possible to choose the motor-pump system. This could be done by finding it in a catalogue or using a tool that many motor-pump system brands have on the internet. This tool is a graphical user interface that the user only has to fill some parameters. For this work, the internet tool of Caprari13, named as IPUMP, was used. Once the user has done registration in the IPUMP platform, it is necessary to choose the type of system that he or she wants. Figure 17 lists all the types of systems that it is possible to use. They are classified in submersible and vertical lineshaft, drainage and sewage pumps, monobloc and horizontal shaft pumps and flow accelerators and mixers.
Figure 17 - IPUMP general menu
Once the user chooses the most suitable type of system, a duty point menu (Figure 18) appears. Here, it is necessary to fill the flow rate (Volume of water pumped per hour), the total head and the static head. All the other parameters remain unchanged.
13
Caprari isa leading international manufacturer in the production of centrifugal and electric pumps and in the creation of advanced solutions for management of the integrated water cycle.
Figure 18 – IPUMP duty point menu
Since this is filled, all the motor-pumps systems that satisfy all the conditions that the user had decided will appear. An example of this can be seen in the next figure, Figure 19.
Figure 19 – List of motor-pumps for an example
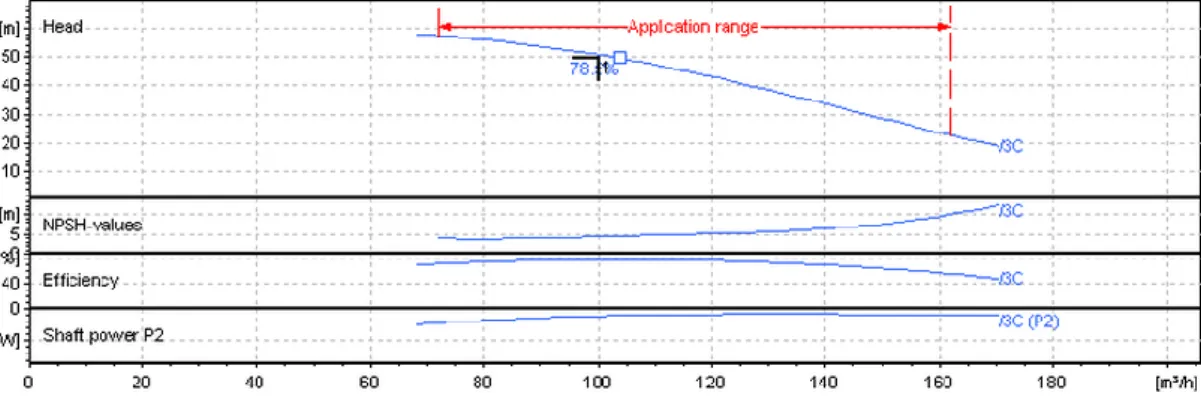
As there are plenty of motor-pumps systems for the same characteristics, it is required to analyze all of them, according to the specifications that the user (that in this case are the irrigation communities) want to their fields. Parameters such as the application range, the nominal power, the efficiency or even the motor characteristics will modify the curve [head-flow rate], shown in Figure 20. The idea is that the maximum and the minimum water [head-flow rate produced by the motor-pump system, from the available irrigator’s data, to be contained in the application range (marked in red in the Figure 20).
Figure 20 – Example of Head, NPSH, Efficiency, Shaft Power curves in function of the flow rate
The platform permits to the user to see all the points of the curve, and give the information of the water flow, the efficiency and the power. With six disperse points, as well as the nominal values, it is possible to fill all the inputs related with the Water Pumping System.
3.1.2. Output
Once you run the program in the Matlab platform, 4 options are available, as can be seen in the next table (Table 5).
Table 5 - IESPRO Menu
0 Exit
1 Report
2 Sankey Diagram 3 Characteristics Curves
Option 0 gives the user the possibility of using any array, any parameter or any variable calculated along the simulation and with that to output the water flow or to plot anything that the user desires. The principal parameters analyzed are the water flow rate, the frequency, the efficiency of the system, the produced energy and the irradiance.
Option 1 generates a report (as well as the diagrams and the curves).
Option 2 allows the user to have an idea whether the system is well sized. In the Sankey diagram, the user has access to the input and output of energy. It starts with the horizontal global irradiation and the production at reference conditions and the output is the produced AC energy, the hydraulic energy and the cubic meters pumped. There are also represented losses, divided in the pump, the motor, the cables, the inverter, the temperature, the power, the spectrum and finally the reflection.
Option 3 generates four different graphics. Two of them, are in function of the flow rate (Q), one represents the height (H-Q) and the other the mechanical power (P2-Q) at the output of the motor. The next one is the motor efficiency in function of the mechanical power (Eff-P2) and the last one is the flow rate in function of the electrical power (Q-P).
3.2. Economic Study
In addition to the technical study, another point of this work was to verify the economic viability of this kind of investment. Therefore, the return on investment as a result of total or partial replacement of the exclusive use of the grid by a photovoltaic system will be calculated.
To do that, it is necessary to know the cost of a PV Water Pumping system, the price of the electricity from the grid, if the community pumps exclusively with that and finally the electricity price that the user will pay if theyreplace partial or totally their current system by PV.
3.2.1. PV Water Pumping System cost
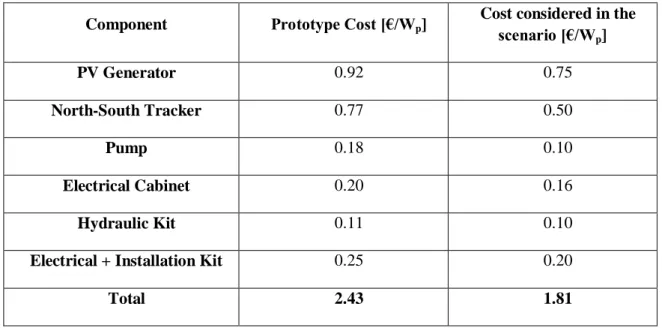
The IES tested a 20kWp system in Villena (nowadays it is working in Ouarzazate, in Morroco) and the costs that will be considered for the economic studies will be from this case study. It will be also considered an adjustment, to actualize the costs of all the components, related with a large scale production of all the elements. Table 6 shows the costs for Wp of all
Table 6 – Costs per Wp installed for all water pumping system components
Component Prototype Cost [€/Wp]
Cost considered in the
scenario [€/Wp] PV Generator 0.92 0.75 North-South Tracker 0.77 0.50 Pump 0.18 0.10 Electrical Cabinet 0.20 0.16 Hydraulic Kit 0.11 0.10
Electrical + Installation Kit 0.25 0.20
Total 2.43 1.81
As can be seen, the photovoltaic system represents 69% of the entire installation (41% for the PV array and 28% for tracking system). It should be noted that the investment in the pump only represents 5% of the total investment. And it must be referred that many pumps do not have to changed.
3.2.2. Cost of grid electricity for irrigation
Beside the initial investment, it is necessary to know the price of the energy from the grid for water pumping solutions.
One thing that is possible to note is that the hours of PV production correspond to the higher period cost. It means that the user could pay less for the energy and contract a low power guarantee in that period, for example. On the other hand, the periods where the price is cheaper, are the ones in which the PV does not produce.
The economical studies were done based on the two types of data considered, monthly bills, with the total value of energy consumed for each month, and bills with more detailed information, which include the hourly consumed energy.
For the first case the average of the values was considered, and it was considered a mean value for the active energy fee and the power fee, whereas for the second case the hourly consumption was used and because of that were calculated the cost considering the power fee and the energy fee for each period.
3.2.3. Electricity Price considering the total or partial replacement with PV
The economic study will be done according to the information provided by the community. If the information is only the monthly values (case A), the savings considered by using PV Water Pumping Systems result of the product from the mean value of the price of electricity in the year by the energy produced by the PV application. On the other hand, if the data provided by the community is more detailed (hour per hour or even 30 minutes in 30 minutes) it is possible to do a different study. To do this one it was developed an excel tool that permits to calculate the
savings by the optimization of the contracted power as well by the reduction of the energy consumed by the utilization of the PV.
3.2.4. Economical tool
In this tool once we had access to the consumed energy, as well as, the money that they have paid for it and the quantity in cubic meters of water that was pumped, for example in the previous year, it is possible to extract two important data for an economic test, the cost of energy (€/kWh) and the cost of water pumped (€/m3
). Furthermore, if the user enters the PV energy production, the tool can optimize the contracted power to minimize the grid electricity cost, and can calculate the cost of the electricity with the PV system, considering also penalties by surpassing the value of the contracted power. In the first sheet, called summary for optimization, the user has to insert the current contracted power on each term, P1, P2, among others, depending on the type of tariff (3, in the 3.1.fee and 6, in the 6.1), Figure 21.
Figure 21 – Summary of the optimization tool. The first group is the optimized by the program, the second is the actual that they have and the third will be the considered one
The first parameter (Potencia SIMULACION) is the contracted power that will be optimized. Whereas, the second parameter (Potencia ACTUAL) is the information provided, ie it is the power that the user hired in each stretch. As it is not possible to hire exactly the power that the user wants, the third menu (Potencia OPTIMIZADA) is the closest nominal power value which can be hired.
Afterwards, it is also necessary to input the actual energy consumed in one year, as well as the normalized PV production in terms of kWh/ kWp simulated by the IESPRO tool. Based on these
two data sets, this excel file subtracts the energy used and the energy from the PV. In the case of a photovoltaic generation is greater than the consumed electricity, and there is no capacity to store water, the excess is disregarded.
3.2.5. Return of the Investment
With the results provided from the last calculation, it is necessary to do an analysis of the return of the investment, this is, it is necessary to calculate the Net Present Value (NPV) as well as the Internal Rate of Return (IRR). The NPV is the difference between the present value of cash inflows and the present value of cash outflows. On the other hand, the IRR is the discount
rate that makes the net present value of all cash flows from a particular project equal to zero, and thus the higher a project's internal rate of return, the more desirable it is to undertake the project.
Communities of irrigators prefer to contract longterm loans (typically 25 years), in order to reduce the monthly expenses. To obtain these two parameters (NPV and IRR) it is necessary to calculate the investment (I), expressed in € (equation 3).
(3)
where the TCC is the total cost considered, in €/Wp, and the the Sized Power to be installed,
in W.
As it is not known how much the user is willing to invest, this study considered that the claim that would be asked for the bank would be the total amount. Assuming an interest rate (IR) charged by the bank expressed in percentage, it is possible to calculate how much the community will pay annually (Py), considering a number of years (Y) of payment, by using the
following equation:
(4)
where NCY is the number of years that they will have to pay the credit, in years, and the Y is the year that is analyzed.
However, the value of money today is not the same of tomorrow and therefore it was considered a discount rate (DR), which is expressed in percentage. Through the following equation the upgrade of the money can be verified.
(5)
To know whether the investment is viable or not, it is necessary to make a comparison with the cost of electricity from the grid. Considering an annual rate of increase in the price of electricity (YEIT) expressed in percentage, it is possible to simulate how much the community would pay for it during the years of credit. This increase in annual cost could be calculated by the following equation:
(6)
where the GCy is the cost expressed in € before the rate of increase and is that parameter
but after that consideration.
With all these data it is possible to calculate the net present value (NPV) and check the profitability of the project.
The NPV was calculated according to the following equation:
Through the NPV, and based on an excel tool that calculates the IRR, it is possible to get this value and finally, evaluating the profitability of the system.
CHAPTER 4. Study Cases
Until this chapter it has been presented the methodology used to make a study about a Water PV Pumping system. There will be analyzed two real cases, one in Villena (pumping to a water pool) and the other Zújar (pumping at constant pressure). These studies emerged following a request from the communities of irrigators who increasingly look for alternatives to their systems. For that reason, the Solar Energy Institute was requested to do them.
4.1.Villena
4.1.1. Site location and characterization
The site is located in the Irrigation Community of Villena, in Alto Vinalopó, in the province of Alicante (N38.36, W0.52 and altitude: 81m). This irrigation community pumps to water pools thanks to a big store capacity of 3.5 hm2. In Alto Vinalopó, according to data from the AEMET (Meteorological Agency, in Spanish), the mean monthly higher temperature varies between 30.6ºC, in August and 16.8ºC, in January. Minimum temperatures vary between 20.4ºC (August) and 6.2ºC (January). Table 7 lists monthly maximum and minimum temperature and horizontal irradiation.
Table 7 – Maximum and minimum temperatures14 and Irradiation15 parameters for this local
Month Maximum Temperature [ºC] Minimum Temperature [ºC] Mean Daily Horizontal Irradiation[Wh/m2] January 16.8 6.2 2430 February 17.8 7.0 3320 March 19.2 8.2 4530 April 20.9 10.1 5700 May 23.6 13.3 6610 June 27.2 17.1 7680 July 30.1 19.7 7770 August 30.6 20.4 6760 September 28.4 17.8 5110 October 24.4 13.7 3770 November 20.4 10.0 2610 December 17.6 7.3 2350
This irrigation community has 22 wells divided into 7 zones and it has a total a storage capacity of 3.5hm3, spread across several water pool (Table 8).
14
Data from the AEMET 15

![Table 1 – Irrigable and irrigated areas by country and irrigated areas finally used for compilation of the EIM in 2006 [16] Country Country Irrigable Area (ha) 2000 Irrigated Area (ha) 2000 Irrigable Area (ha) 2003 Irrigated Area](https://thumb-eu.123doks.com/thumbv2/123dok_br/19248797.974865/26.892.125.773.408.1125/irrigable-irrigated-irrigated-compilation-irrigable-irrigated-irrigable-irrigated.webp)
![Figure 12 - Evolution of the Active Energy and the Power fees for 6.1. [15]](https://thumb-eu.123doks.com/thumbv2/123dok_br/19248797.974865/30.892.150.455.744.1039/figure-evolution-active-energy-power-fees.webp)