Increasing sorption isotherms accuracy: Weibull
modelling and linear regression
M.A.P. Dinis1*, C.F. Rodrigues1and M.J. Lemos de Sousa1,2
1Fernando Pessoa University (UFP), UFP Energy, Environment and Health Research Unit (FP-ENAS), Energy, Environment and Environmental & Public Health Research Laboratories
(3ERL), Praça de 9 de Abril 349, Oporto 4249-004, Portugal
2Academia das Ciências de Lisboa, Rua da Academia das Ciências 19, Lisbon 1249-122, Portugal
*Corresponding author. E-mail: [email protected] (Received 11 February 2015; accepted 16 June 2015)
Abstract
Relying on an adequate mathematical approach, two different mathematical procedures can be applied to the huge database produced during gas sorption isotherm experiments in order to obtain accurate data to be used in the industrial practice. To treat data determined from gas sorption isotherms without a careful mathematical support will produce inaccurate results, because all the determinations will be dependent on human decision. The minimum error reported since the first stage of a sorption isotherm determination, which corresponds to volume calibrations of reference and sample cells performed through the use of helium, will produce enormous inaccuracies on sorption isotherm behavior. These inaccurate behaviors may sometimes invalidate any Coalbed Methane recovery and CO2injection programs. The study consisted on
investigating gas sorption isotherm accuracies determined during the first part of the sorption process, which is mainly conducted by monitoring the pressure decline with time, in the reference and the sample cells (when both cells are not in contact), until the stabilization stage is achieved. Three samples from two different coals were selected in order to study their gas sorption behavior, in terms of a clear mathematical approach, when submitted to three different gas compositions, viz. 99.999% methane (CH4); 99.999% carbon dioxide (CO2); and
a gas mixture containing 74.99% CH4+ 19.99% CO2+ 5.02% nitrogen (N2).
Sorption experiments allow to conclude that the three samples present the same mathematical response during the first part of the sorption process. However, all gas sorption data (adsorption and desorption) collected from reference cell have a better fitting to a Modified Weibull Model, and all gas sorption data (adsorption and desorption) collected from sample cell respond in a trustworthy way to a Linear Regression Model. Confidence bands and prediction intervals (or bands) were also computed.
Keywords: Sorption isotherms, Modified Weibull model, Linear regression model, Confidence bands, Prediction intervals
1. INTRODUCTION
CBM and CO2 Geological Sequestration Prospection/Exploration Projects require
performing several analyses in order to economically validate those programs (Carroll and Pashin, 2003; Cui et al., 2004; Gentzis, 2000; Grimston et al., 2001; Hamelinck
et al., 2002; Harpalani et al., 2006; Karacan et al., 2009; Ozdemir, 2009; Pashin and
Mclntyre, 2003; Wei et al., 2005; White et al., 2003; White et al., 2005; Yu et al., 2007). However, some different approaches were developed in terms of analyses and their priorities. The laboratory were the work has been done follows the basic and fundamental studies in CBM prospecting/exploring of Lemos de Sousa et al. (2003). This methodology comprises two sets of analyses: general analyses, such as: Total moisture and Moisture Holding Capacity analyses, Density, Proximate and Ultimate analyses, Petrographic analyses (Reflectance, Macerals, Microlithotypes, Carbominerites and Minerite), Mineral Matter content by low-temperature ashing, Chemical and mineralogical analyses of the mineral matter, Isotopic composition of produced gas, Palaeofacies of coal sedimentation; and specific analyses, such as: Gas content: Q1(lost gas), Q2(desorbed gas) and Q3(residual gas), Molar composition of
the produced gas, Gas sorption (adsorption + desorption) isotherms, Detailed study of the Cleat System (Rodrigues et al., 2014), Water produced with Coalbed Methane.
The present work deals with just one of the above mentioned analyses, gas sorption isotherms. In the past, this analytical technique focused only on measuring the maximum storage capacity of a coal seam. However, many experimental works were developed since then, and nowadays gas sorption isotherms act as a multidisciplinary technique in CBM and CO2Geological Sequestration Programs (Busch et al., 2006;
Gruszkiewicz et al., 2009; Karacan, 2007; Kelemen and Kwiatek, 2009; Mazumder and Wolf, 2008; Rodrigues et al., 2011; Rodrigues et al., 2013; Yu et al., 2008). In fact, more and more gas sorption isotherms can be used to study and to quantitatively measure several relevant parameters, in order to (Rodrigues et al., 2000): estimate the maximum gas storage capacity of a coal seam in situ; estimate the actual volume of gas in situ; estimate the gas saturation degree of a coal seam by the difference between the maximum gas storage capacity and the actual volume of gas; estimate the gas diffusion coefficients at different pressures; estimate the gas stored composition at different pressures; estimate the volume of gas that will be released from the coal seam as reservoir pressure decreases; estimate the critical desorption pressure; estimate the coal density; estimate the coal volume; estimate the gas formation volume factor at different pressures.
To compute all the above mentioned parameters and at the same time to minimize experimental errors, gas sorption isotherms must be carried out in accordance with high accuracy standards (Dinis, 2010; Dinis et al., 2010; Rodrigues, 2002; Rodrigues
et al., 2008a; 2008b). The present work deals with the gas sorption isotherms accuracy
through an explicit mathematical approach. Moreover, both databases of each pressure step collected from reference and sample cells were studied using two different mathematical models, i.e., on data generated through the re ference cell a Modified Weibull Model was applied, and on data produced through the sample cell data fit was accomplished using the Linear Regression Model. The application of both models was required due to the fact that values of the “gas content changes” (value of gas content
adsorbed and desorbed in each pressure step) have completely different behaviors in the reference cell and in the sample cell, and consequently the best curve fit corresponds to totally different shapes in each case.
2. SORPTION ISOTHERM
Sorption isotherms were conducted using a volumetric method, into a Boyle-Mariotte Law apparatus. This sorption isotherm apparatus was submitted to an isothermal bath equal to the real coal seam temperature. Data produced during all adsorption and desorption pressure steps, ranging from 0 up to 70 bar (1015 psi), were examined in detail. Our laboratory uses the Langmuir Model (equation 1), since it is considered the most accurate one for studying gas sorption process by coals.
(1)
where V is the gas content (scf/ton), P is the pressure (psi), VLis the Langmuir volume
(scf/ton), and PLis the Langmuir pressure (psi).
The experimental data accuracy depends on (Rodrigues, 2002): achieving the stabilization stage at each pressure step during the adsorption and desorption processes, i.e., the adsorbed phase and the free phase must be in dynamic equilibrium, at a given temperature and pressure after sufficient time (each pressure step will continue until pressure changes less than 0.1 psi (≅6.9x10⁻⁴MPa) over a 30 minutes
period); and calculating the gas formation volume factor at the above mentioned stabilized pressure steps, taking into account pure gases critical points and gas mixtures pseudocritical points.
To correctly understand the main gold of the present work it is pertinent to describe the sorption isotherm proceedings, consisting in the following 11 steps: (1) Placing the whole system into an isothermal bath; (2) Purging the whole system with helium; (3) Estimating reference cell and sample cell volumes by using helium; (4) Sealing the equilibrated moisture coal sample in the sample cell and introducing helium into the cells to determine the void volume in sample cell, the coal sample volume, and the coal density (this process is repeated four (six) times); (5) Purging the reference cell with the gas to be used in the test; (6) Charging the reference cell to a specific pressure; (7) Monitoring the pressure decline as a function of time, in reference and sample cells, until the stabilization stage is achieved (defined, in the present work, as the first part of the sorption isotherm test); (8) Opening the connection valve between the reference cell and the sample cell; (9) Monitoring the pressure decline as a function of time, in reference and sample cells, until the stabilization stage is achieved (defined, in the present work, as the second part of the sorption isotherm test); (10) Repeating the entire process for six (eight) times; (11) Performing the desorption process after the adsorption process is concluded by repeating the same 6, 7, 8, 9 and 10 above mentioned steps, but progressively decreasing the pressure.
= × + V V P P P L L
3. EXPERIMENTAL CONDITIONS
In this study, two coals were selected with different petrographic characteristics, as shown in Table 1.
To carry out gas sorption isotherms it is important to define and control the experimental conditions in order to minimize possible experimental errors (Rodrigues
et al., 2000; Sakurovs et al., 2009). All experiments were performed under the
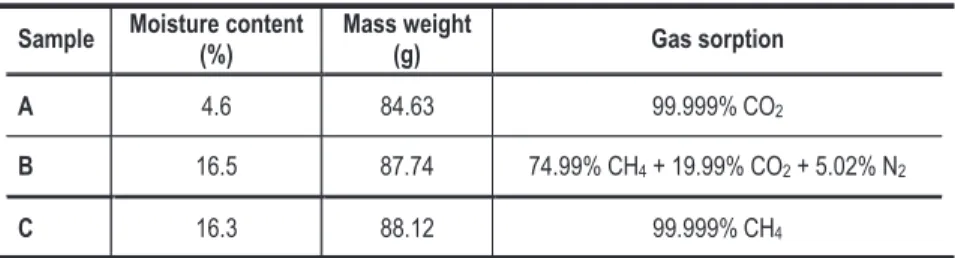
following conditions: isothermal bath of 35 ˚C (all the system is placed in a water bath in order to maintain a constant temperature during the whole gas sorption test procedure); Sample Moisture content must be equal to, or greater than, the Moisture-Holding Capacity (Rodrigues and Lemos de Sousa, 1999) (Table 2); Particle size of the sample less than 212 mm, and Mass weight ca. 100 g (Table 2). Gas sorption (sorption isotherms were performed on samples A, B and C using CO2, CH4and a gas
mixture, respectively) (Table 2).
Table 1. Petrographic Composition from samples A B and C.
Sample Petrographic Composition (%)
Rr V L I MM
A 0.72 75 5 14 6
B 0.72 75 5 14 6
C 0.67 76 4 7 13
Rr — Mean Random Reflectivity; V — Vitrinite content; L—Liptinite content; I— Inertinite content; MM — Mineral matter content
Table 2. Experimental conditions. Sample Moisture content
(%) Mass weight (g) Gas sorption A 4.6 84.63 99.999% CO2 B 16.5 87.74 74.99% CH4 + 19.99% CO2 + 5.02% N2 C 16.3 88.12 99.999% CH4 4. ANALYTICAL DATA
The present work deals with sorption isotherms accuracy determined in the first part of the sorption process (see Sorption Isotherms Remarks item). As already stated, due to the huge amount of experimental data and the need to obtain high accurate results it was decided to apply a truthfully mathematical approach on those sorption data. However, it was necessary to use two different curve fit on reference cell and sample cell data. In fact, the different behaviors observed in both cells are totally
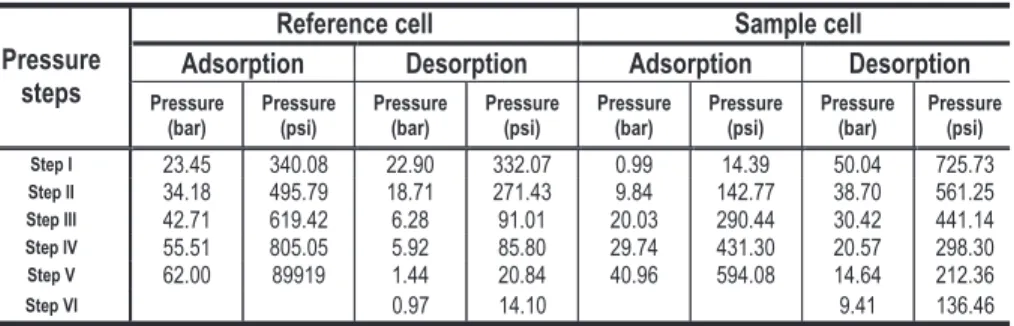
understandable and expectable. In the reference cell it was imposed a pressure change by charging (during adsorption process) or realizing pressure (during desorption process) in the cell, to a specific pressure defined for each pressure step, i.e., in the reference cell and in each pressure step a significant differential pressure was induced (Tables 3, 4 and 5). On the contrary, in the sample cell the first part of the sorption process starts when the stabilization stage from the previous pressure step is achieved; consequently, no significant pressure changes occurred during this sorption process phase, determined in each pressure step, except the ones related to the dynamic equilibrium established between the coal sample and the gas sorption. Therefore, data obtained from reference cell fit to a modified Weibull model and data from sample cell to a linear regression model. Confidence Bands (CBs) and Prediction Intervals (PIs) are both used to study the best curve fit and the square correlation coefficient (R2) to
measure the degree to which two or more variables are associated (Kenney and Keeping, 1962), thus measuring the strength of the estimated relationships. Given the assumptions of the two applied models, it is possible to be 95% sure that confidence bands enclose the true best curve fit, leaving a 5% chance that the true line is outside those boundaries. It is important to highlight the fact that anyway some data points will be outside the 95% prediction interval boundary. The prediction interval of 95% are further from the best-fit line than the confidence bands, a lot further if one has many data points. It is the area in which it is expect 95% of all data points to fall.
Table 3. Initial pressure step used during adsorption and desorption processes from sample A.
Pressure steps
Reference cell Sample cell
Adsorption Desorption Adsorption Desorption Pressure (bar) Pressure (psi) Pressure (bar) Pressure (bar) Pressure (bar) Pressure (psi) Pressure (bar) Pressure (psi) Step I 23.30 337.89 31.50 456.92 0.92 13.35 48.90 709.29 Step II 35.03 508.12 13.41 194.47 8.40 121.87 40.43 586.40 Step III 42.51 616.52 4.92 71.31 19.56 283.70 31.74 460.32 Step IV 52.12 755.98 3.26 47.34 29.87 433.28 22.02 319.39 Step V 58.01 841.35 2.52 36.56 40.43 586.44 15.26 221.26 Step VI 1.70 24.58 10.77 156.27 Pressure steps
Reference cell Sample cell
Adsorption Desorption Adsorption Desorption Pressure (bar) Pressure (psi) Pressure (bar) Pressure (psi) Pressure (bar) Pressure (psi) Pressure (bar) Pressure (psi) Step I 23.45 340.08 22.90 332.07 0.99 14.39 50.04 725.73 Step II 34.18 495.79 18.71 271.43 9.84 142.77 38.70 561.25 Step III 42.71 619.42 6.28 91.01 20.03 290.44 30.42 441.14 Step IV 55.51 805.05 5.92 85.80 29.74 431.30 20.57 298.30 Step V 62.00 89919 1.44 20.84 40.96 594.08 14.64 212.36 Step VI 0.97 14.10 9.41 136.46
Table 4. Initial pressure step used during adsorption and desorption processes from sample B.
4.1. The weibull model
The mathematical models and check pointing methodologies described in this paper have the main goal to provide a realistic, rigorous, and methodical approach to be applied to highly reliable performance data from a collection of a huge sorption isotherms database.
Weibull models have been used in many different applications and for solving a variety of problems from numerous research domains. The Weibull model was initially developed to describe the best fit of a given system submitted to different thermodynamic conditions over time (Weibull, 1951). This model is very flexible owing to the inclusion of a shape parameter (β) in addition to the scale parameter (α), which allows its application to a number of diverse situations. It has also proved to have an interesting potential for describing microbial, enzymatic and kinetic mechanisms. The Weibull model was used by Brouers et al. (2005), who used Weibull isotherms as a general term, to fit data of a number of activated carbons at different relative pressures, which corresponds in fact to micropore adsorption. The fitting procedure was considered to be much better than any other empirical formula.
In the present work, the Weibull model was adopted to study the reference cell data, since this model presents three main advantages: it has a smaller number of parameters; it has no discontinuity regarding the dependence of the scale parameter on temperature (since this model has been applied to isotherm tests), which makes it more suitable for pressure range data; it provides very good fits to the individual experiments, leading to a more refined fitting method to estimate the model parameters and the model validation.
The Weibull Model approach has been used for fitting isotherms, where isotherm parameters are adjusted to minimize the difference between experimental data and the corresponding isotherm simulated values. In the authors point of view to obtain a good Weibull Isotherm fit to experimental data and to evaluate its performance, implied to use the following sequence of processes: (i) the OriginPro professional data analysis and graphing software was applied to the huge amount of sorption experimental database collected by the BenchLink Data Logger software, (ii) Microsotf (MS) Excel solver package was used to identify initializing solutions for the Weibull parameters through the minimization of a sum of squared error (SSE) function; (iii) therefore, a hybrid optimization procedure that combines results generated using the MS Excel Table 5. Initial pressure step used during adsorption and desorption processes
from sample C. Pressure
steps
Reference cell Sample cell
Adsorption Desorption Adsorption Desorption
Pressure (bar) Pressure (psi) Pressure (bar) Pressure (psi) Pressure (bar) Pressure (psi) Pressure (bar) Pressure (psi) Step I 25.99 376.91 31.54 457.41 1.01 14.62 49.61 719.57 Step II 32.70 474.35 22.03 319.59 11.22 162.77 42.18 611.84 Step III 42.31 613.63 16.44 238.50 20.23 293.41 33.96 492.60 Step IV 51.91 752.87 9.15 132.67 29.64 429.81 26.83 389.21 Step V 63.48 920.65 4.35 63.14 39.16 567.92 19.69 285.63 Step VI 1.71 24.84 13.55 225.54
solver package with the Levenberg-Marquardt nonlinear regression (Matott and Rabideau, 2008) obtained by OriginPro, was applied. The 95% confidence bands and prediction intervals were also computed using OriginPro.
Our laboratory, taking into account the statement “Clarifying simple things end up complicated”, adopted the Model I from the Murthy et al. (2004a; 2004b) work, i.e. the two-parameters Weibull Model, due to its simplicity, flexibility and since it does not show any discontinuity in parameters in the whole range of pressure tested. However, the Weibull equation (Murthy et al., 2004a; 2004b) was modified in order to include the initial pressure, since in our specific case real experimental data was used. This modification in the Weibull equation was pertinent to our study, due to the fact that it was necessary to use the real set of all experimental data in order to understand processes behavior occurred in the first part of the sorption isotherm test. Otherwise, to understand and to interpret what is happening during the isotherm process becomes too much difficult if the results were normalized, or transformed.
Therefore, the Modified Weibull Equation is described as follows:
(2)
where y is the pressure (bar), x is the time (s), Piis the initial pressure (bar), α is the
scale parameter and β is the shape or form parameter.
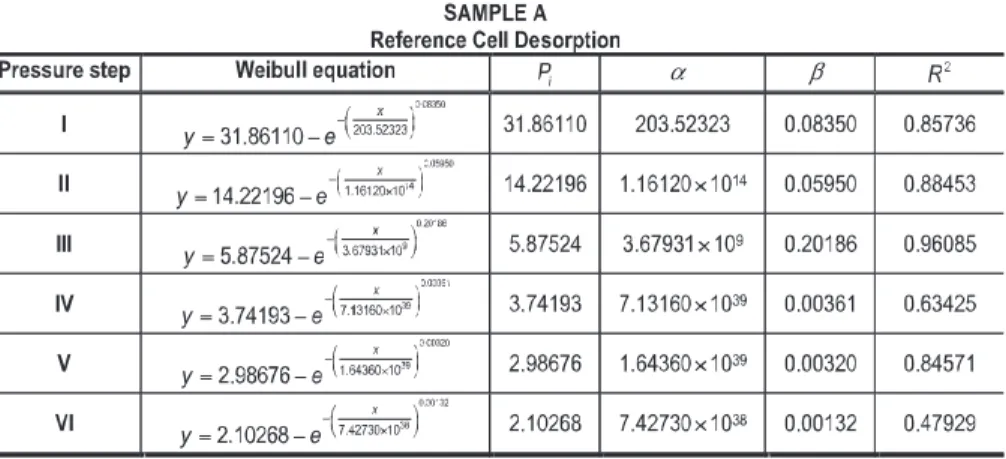
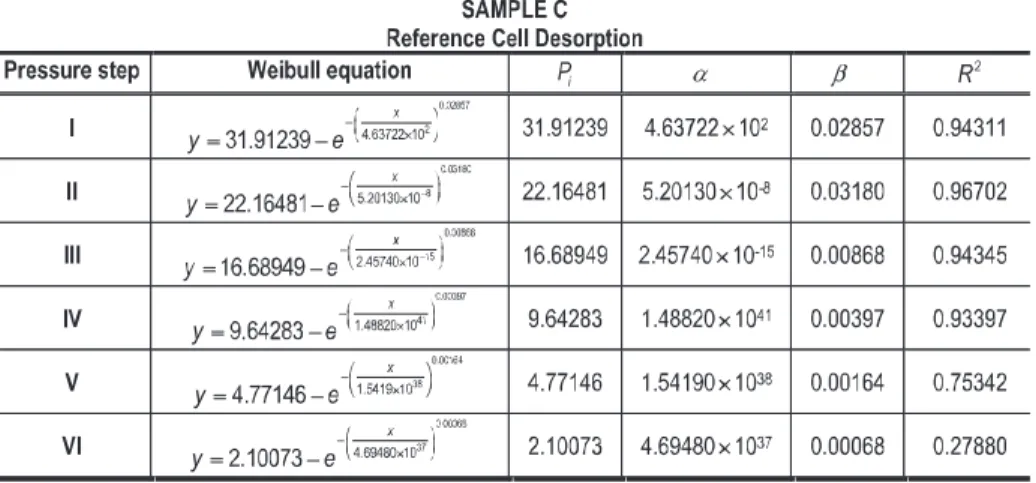
Three sets of adsorption and desorption curves on the reference cell obtained from the three sorption isotherms show a good fit to the modified Weibull equation (Tables 6, 7, 8, 9, 10 and 11). In fact, taking into account that sorption isotherm is a temperature independent process, i.e. the three experiments were performed in a constant temperature; it was possible to obtain the same general Weibull model fitting even when increasing and decreasing pressures were imposed. An interesting aspect demonstrated in the study it was that by using the Modified Weibull Model it is possible to confirm the overall sorption consistency profile even when the pressure value changes considerably from one pressure step to another pressure step.
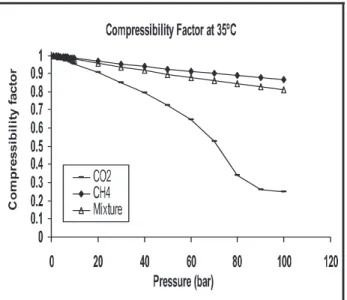
The scale parameter (α) has the same effect on the function as a change of the abscissa scale. The scale parameter determined during the adsorption process (Tables 6, 8 and 10) shows the same general trend in sample A, B and C. It means that, in the tree samples, α presents high values in pressure step I, decreases in pressure step II and finally increases until the pressure step V. The great high values obtained in pressure step I are due to the gas expansibility effect when the empty reference cell (pressure ≈ 0 bar) is charged to a specific pressure (Tables 3, 4 and 5). From pressure step II until pressure step V, α shows a slight increase, which is probably induced by the gas compressibility factor, i.e., the gas compressibility factor raises with pressure increases. Yet, in sample A, α in pressure step V presents a considerably high value due to the high CO2 compressibility factor (Fig. 1). During the desorption process
(Tables 7 – sample A, 9 – sample B and 11 – sample C), α shows the same general trend as during the adsorption process. However, α reaches high values, due to the high expansibility characteristics of gases, i.e. the minimum changes by decreasing the
= − −α β y Pi e x
pressure will produce enormous effects on gas physical properties. The rate between the gas volume (in terms of gas content) and the reference cell volume is very high and decreases strongly with pressure reduction.
The Weibull shape parameter (β) or behavior index is also known as the Weibull slope. This is because the value of β is equal to the slope of the line in a probability plot. In fact, β is related to the kinetic mechanisms, in temperature independent conditions, which gives the model a wide flexibility, making it a good model to describe different kinetic reactions, as the case described in this text.
During the adsorption process, parameter β shows a general negative growth with pressure increase in the three samples, whereas β presents a general positive reduction with pressure decrease, during the desorption process. It means that adsorption and desorption curves stay close to the first minutes of the x-axis, at low pressures, and move towards the x-axis positive direction, at high pressures. This behavior takes place because kinetic mechanisms are stronger at higher pressures than at lower pressures. Again, the compressibility factor is the parameter responsible for this behavior.
Analyzing the square correlation coefficients (R2) of each pressure step, during
adsorption and desorption processes, of the three data sets, it is possible to conclude that the best result, i.e., the one that provides the best fit to the model, corresponds to the data set from sample C (CH4), followed by the sample B (gas mixture) and finally
by the sample A (CO2). Yet, comparing adsorption and desorption processes, in the
three experiments, it is also possible to confirm that the R2has always higher values
in the adsorption process than in the desorption process (Tables 6, 7, 8, 9, 10 and 11). The lower R2 data detected during the desorption process, when using carbon dioxide,
is due to the fact that the carbon dioxide has a higher expansibility effect (Fig. 1) than Figure 1. Carbon dioxide, Methane and Mixture compressibility factors at 35 ˚C.
the gas mixture and than the methane (Tables 7, 9 and 11). In fact, it can be said that the strength of the modified Weibull relationship in terms of R2, partially confirms the
applicability of the model. Furthermore, the 95% confidence bands and prediction intervals calculated for all sorption data (Tables 6, 7, 8, 9, 10 and 11) can confirm the above mentioned behavior of R2. During the adsorption and the desorption stages the
ranges of CBs and PIs are narrower in sample C (CH4), followed by sample B (gas
mixture) and sample A (CO2), which is clearly related with the gas sorption used. In
fact, rather than only allowing taking conclusions relating the goodness-of-fit of the model, both upper and lower CBs and PIs specially emphasize the stronger scattering of the data, caused only by gas physical properties. Furthermore, the narrowest intervals of CBs and PIs are presented in the adsorption and not in desorption. This was also confirmed by the higher R2values obtained during the adsorption stage.
Table 6. Results of Modified Weibull Equation Analysis of the adsorption process in reference cell – Sample A (CO2).
Table 7. Results of Modified Weibull Equation Analysis of the desorption process in reference cell – Sample A (CO2).
Table 8. Results of Modified Weibull Equation Analysis of the adsorption process in reference cell – Sample B (gas mixture).
Table 9. Results of Modified Weibull Equation Analysis of the desorption process in reference cell – Sample B (gas mixture).
Table 10. Results of Modified Weibull Equation Analysis of the adsorption process in reference cell – Sample C (CH4).
4.2. Linear regression model
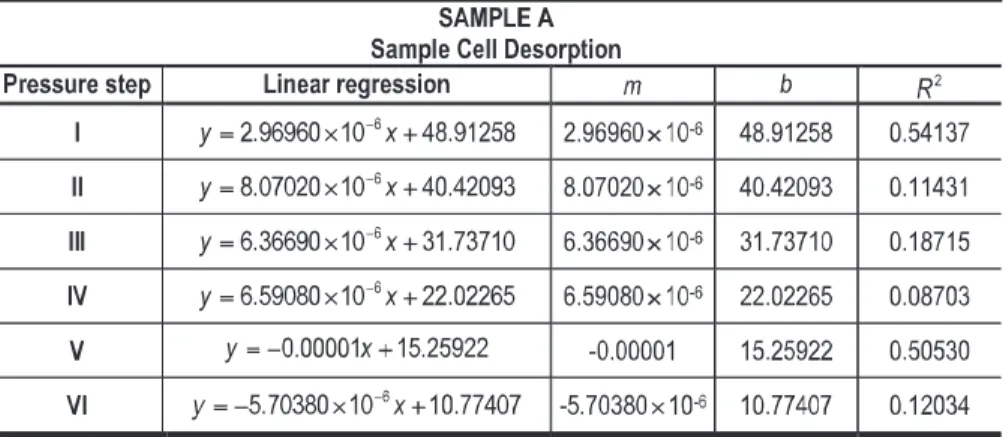
Linear regression is the process of fitting the best possible straight line through a series of points, by minimizing the sum of the squares of deviations between the points and the line. Linear regression is often used to reduce a set of experimental data to a simple mathematical relationship.
Table 11. Results of Modified Weibull Equation Analysis of the desorption process in reference cell – Sample C (CH4).
The present model is applicable just to sample cell data obtained from the first part of the sorption isotherm test, when reference and sample cells are completely isolated from each other and the stabilization stage in the previous pressure step has been achieved at a given pressure (Tables 3, 4 and 5).
The Linear regression Equation is described as follows:
(3)
where y is the pressure (bar), x is the time (s), m is the slope and b is the interception point (the pressure value of the line when time is equals to zero).
Analyzing the square correlation coefficient (R2) calculated in each pressure step,
during the adsorption and desorption processes of the three data sets (Tables 12, 13, 14, 15, 16 and 17), it is possible to conclude that it is not possible to observe an obvious trend. The obtained R2values range from very high to very low ones. In sample B, for
example, data in the adsorption pressure step I present a R2 = 0.93535 and in the
adsorption pressure step IV a R2 = 0.00004. In sample C, for example, data in the
desorption pressure step I present a R2= 0.01474 and in desorption pressure step III a
R2= 0.79257. In fact, R2translates the interaction between the coal structure and the
different gas sorptions, which is intimately related to gas kinetic movements and gas = +
saturation levels and consequently to pressure increase and decrease. Consequently, and in general terms, during the adsorption stage the higher R2values are obtained
from sorption data determined from sample C, followed by data from sample B and finally by data from sample A. On the opposite process, the desorption stage, the higher R2values are obtained with data from sample A, followed by data from samples
B and C. These effects are related to the high affinity of coal structure to CO2. During
the adsorption stage those effects, associated to pressure increase, will cause the kinetic movements increase and therefore will produce low R2values. During the desorption
stage the same affinity, associated in this case to pressure decrease, will induce the kinetic movements decrease. CBs and PIs are commonly used to indicate the reliability of an estimate study, thus upper and lower 95% CBs and PIs were computed to the linear regression model applied to the sample cell isotherm data (Tables 12, 13, 14, 15, 16 and 17). Confirming the R2values obtained, it is possible to acknowledge that CBs
and PIs are able to translate the high affinity between CO2and the coal structure.
Table 12. Results of the Linear Regression Equation Analysis of the adsorption process in sample cell – Sample A (CO2).
Table 13. Results of the Linear Regression Equation Analysis of the desorption process in sample cell – Sample A (CO2).
Table 14. Results of the Linear Regression Equation Analysis of the adsorption process in sample cell – Sample B (gas mixture).
Table 15. Results of the Linear Regression Equation Analysis of the desorption process in sample cell – Sample B (gas mixture).
Table 16. Results of the Linear Regression Equation Analysis of the adsorption process in sample cell – Sample C (CH4).
5. CONCLUSIONS
This paper deals with the determination of gas sorption isotherms, one of the techniques used in the scope of reservoirs modelling, accuracy, since under or over-estimation of the sorption results can greatly influence CBM recovery and CO2
injection project validations and consequently economically invalidate those programs. The present work aims to demonstrate the importance of conducting a gas sorption isotherm experiment using a mathematical accurate procedure in what concerns the treatment of the data. It is well-known that erroneous data acquisition and its subsequent data analysis can allow under or over-estimation of data and may, consequently, invalidate any CBM Exploration and CO2 geological sequestration
projects. In fact, it was confirmed that even during the primarily sorption isotherm phase, when both reference and sample cells were isolated, data acquisition and analysis must be conducted in a very rigorous way. When the two cells are completely isolated the gas behavior is absolutely different and totally independent in both reference and sample cells. As a result, the applied mathematical models, the modified Weibull model and the linear regression model, are also entirely diverse. In the reference cell the best data fit corresponds to a Weibull model and, in contrast, the best data fit corresponds to a linear regression model in the sample cell. Analyzing both model behaviors also implies to understand R2 values, confidence bands and
prediction intervals.
It is possible to conclude that the Weibull model, the model applied to sorption data produced in reference cell, presents a much consistent pattern than the linear regression model, the model applied to sorption data produced in sample cell. This can be explained due to the fact that adsorption and desorption processes are controlled by different parameters in each case, reference and sample cells. In the reference cell the gas behavior depends on the physical properties of the selected gas and its response to the different pressure steps induced during the sorption isotherm experiment. Accordingly, during the adsorption and the desorption processes, the best data fit to Table 17. Results of the Linear Regression Equation Analysis of the desorption
the Weibull model corresponds to the data set produced from sample C (CH4),
followed by sample B (gas mixture) and finally by sample A (CO2). It is clear that this
effect is intimately related to the high compressibility behavior of CO2. In the sample
cell, other than accounting for the gas physical properties and its performance to different pressures, it is also necessary to take into consideration the interaction between the gas and the coal structure. Therefore, and in general terms, during the adsorption stage the higher R2values are obtained in sample C, followed by sample B
and finally by sample A. On the opposite process, the desorption stage, the higher values are obtained in sample A, followed by sample B and then sample C. In this case, in addition to the high compressibility behavior of CO2it is also necessary to
consider the CO2high affinity to coal structure.
REFERENCES
Brouers F., Sotolongo O., Marquez F. and Pirard J.P., 2005. Microporous and heterogeneous surface adsorption isotherms arising from Levy distributions.
Physica a-Statistical Mechanics and Its Applications 349(1-2), 271-282.
Busch A., Gensterblum Y., Krooss B.M. and Siemons N., 2006. Investigation of high-pressure selective adsorption/desorption behaviour of CO2and CH4on coals: An
experimental study. International Journal of Coal Geology 66(1), 53-68. Carroll R.E. and Pashin J.C., 2003. Relationship of sorption capacity to coal quality:
CO2sequestration potential of coalbed methane reservoirs in the Black Warrior
basin. 2003 International Coalbed Methane Symposium Proceedings, Tuscaloosa, Alabama, University of Alabama College of Continuing Studies, Paper 0317, pp. 11.
Cui X., Bustin R.M. and Dipple G., 2004. Selective transport of CO2, CH4, and N2in
coals: insights from modeling of experimental gas adsorption data. Fuel 83(3), 293-303.
Dinis M.A.P., Rodrigues C.F. and Lemos de Sousa M.J., 2010. Gas Storage versus Gas Circulation in North Atlantic and Gondwana Coal Types. International
Journal of Energy for a Clean Environment 11(1-4), 35-40.
Dinis, M.A.D., 2010. The study of the gas diffusion process in coals using Langmuir isotherms: Doctoral Thesis, University of Fernando Pessoa, Porto, Portugal, pp. 388. (Portuguese)
Gentzis T., 2000. Subsurface sequestration of carbon dioxide - an overview from an Alberta (Canada) perspective. International Journal of Coal Geology 43(1), 287-305.
Grimston M.C., Karakoussis V., Fouquet R., van der Vorst R., Pearson P. and Leach M., 2001. The European and global potential of carbon dioxide sequestration in tackling climate change. Climate Policy 1(2), 155-171.
Gruszkiewicz M.S., Naney M.T., Blencoe J.G., Cole D.R., Pashin J.C. and Carroll R.E., 2009. Adsorption kinetics of CO2, CH4, and their equimolar mixture on
coal from the Black Warrior Basin, West-Central Alabama. International
Hamelinck C.N., Faaij A.P.C., Turkenburg W.C., van Bergen F., Pagnier H.J.M, Barzandji O.H.M., Wolf K.-H.A.A. and Ruijg G.J., 2002. CO2enhanced coalbed
methane production in the Netherlands. Energy 27(7), 647-674.
Harpalani S., Prusty B.K. and Dutta P., 2006. Methane/CO2 Sorption Modeling for
Coalbed Methane Production and CO2 Sequestration. Energy & Fuels 20(4),
1591-1599.
Karacan C.Ö., 2007. Swelling-induced volumetric strains internal to a stressed coal associated with CO2sorption. International Journal of Coal Geology 72(3),
209-220.
Karacan C.Ö., Larsen J.W. and Esterle J.S., 2009. CO2 Sequestration in Coals and
Enhanced Coalbed Methane Recovery. International Journal of Coal Geology 77(1), 1.
Kelemen S.R. and Kwiatek L.M., 2009. Physical properties of selected block Argonne Premium bituminous coal related to CO2, CH4, and N2adsorption. International
Journal of Coal Geology 77(1), 2-9.
Kenney J.F. and Keeping E.S., 1962. Linear Regression and Correlation, Ch.15. Mathematics of Statistics, Pt. 1, 3rdEdition. Princeton, NJ, Van Nostrand, pp.
252-285.
Lemos de Sousa M.J., Pinheiro H.J. and Rodrigues C., 2003. Prerequisites, General Criteria and Primary Studies Required in the Coalbed Methane Prospecting and Exploring: A Review.
Matott L.S. and Rabideau A.J., 2008. ISOFIT - A program for fitting sorption isotherms to experimental data. Environmental Modelling & Software 23(5), 670-676.
Mazumder S. and Wolf K.H., 2008. Differential swelling and permeability change of coal in response to CO2 injection for ECBM. International Journal of Coal
Geology 74(2), 123-138.
Murthy D.N.P., Bulmer M. and Eccleston J.A., 2004a. Weibull model selection for reliability modelling. Reliability Engineering & System Safety 86(3), 257-267. Murthy D.N.P., Xie M., and Jiang R., 2004b. Weibull Models (Vol. 505). John Wiley
& Sons, pp. 396.
Ozdemir E., 2009. Modeling of coal bed methane (CBM) production and CO2
sequestration in coal seams. International Journal of Coal Geology 77(1), 145-152.
Pashin J.C. and McIntyre M.R., 2003. Temperature-pressure conditions in coalbed methane reservoirs of the Black Warrior basin: Implications for carbon sequestration and enhanced coalbed methane recovery. International Journal of
Coal Geology 54(3), 167-183.
Rodrigues C., Dinis M.A. and Lemos de Sousa M.J., 2013. Unconventional coal reservoir for CO2safe geological sequestration. International Journal of Global
Rodrigues C., Pinheiro H.J. and Lemos de Sousa M.J., 2000. Sorption Isotherms in the study of Coalbed Methane – some experimental facts. In: Proceedings of the Coal Indaba 2000, 6th Coal Science and Technology Conference, Changing trends in energy use from fossil fuel, Fourways, November 2000, The Fossil Fuel Foundation, pp. 9.
Rodrigues C.F. and Lemos de Sousa M.J., 1999. Further results on the influence of moisture in coal adsorption isotherms. In: Abstracts Volume of the 51st Meeting of the International Committee for Coal and Organic Petrology, Bucharest, 1999. Romanian Journal of Mineralogy 79 (Suppl. 1), pp. 18.
Rodrigues C.F., Dinis M.A.P. and Lemos de Sousa M.J., 2008a. Gas Content Derivative Data vs Diffusion Coefficient. In: Program and Abstracts of the 60th ICCP (International Committee for Coal and Organic Petrology) and 25th TSOP (The Society for Organic Petrology). International Conference on Coal and Organic Petrology ICCP-TSOP, Join Meeting, Oviedo, Spain, September 21-26, 2008. abstract number OP27, pp. 1, CD-ROM.
Rodrigues C.F., Dinis M.A.P. and Lemos de Sousa M.J., 2008b. Gas Diffusion Coefficient: Calculation of Tangent Slope Accuracy through the Inflection Point Determination. In, Program and Abstracts of the 60th ICCP (International Committee for Coal and Organic Petrology) and 25th TSOP (The Society for Organic Petrology). International Conference on Coal and Organic Petrology ICCP-TSOP, Join Meeting, Oviedo, Spain, September 21-26, 2008. abstract number P47, pp. 1, CD-ROM.
Rodrigues C.F., Dinis M.A.P. and Lemos de Sousa M.J., 2011. Coal as an unconventional reservoir for a CO2 safe geological sequestration solution. In:
Proceedings of the Global Conference on Global Warming 2011, Lisbon, July 11-14, 2011. pp. 11.
Rodrigues C.F., Laiginhas C., Fernandes M., Lemos de Sousa M.J. and Dinis M.A.P., 2014. The coal cleat system: A new approach to its study. Journal of Rock
Mechanics and Geotechnical Engineering 6(3), 208-218.
Rodrigues C.F.A., 2002. The application of isotherm studies to evaluate the Coalbed Methane potential of the Waterberg Basin, South Africa: Doctoral Thesis, Faculty of Sciences of Oporto University, Porto, Portugal, pp. 298.
Sakurovs R., Day S. and Weir S., 2009. Causes and consequences of errors in determining sorption capacity of coals for carbon dioxide at high pressure.
International Journal of Coal Geology 77(1), 16-22.
Wei X.R., Wang G.X. and Massarotto P., 2007. A review on recent advances in the numerical simulation for coalbed methane recovery process. SPE Reservoir
Evaluation and Engineering 10(6), 657.
Weibull W., 1951. A statistical distribution function of wide applicability. Journal of
Applied Mechanics-Transactions of the Asme 18(3), 293-297.
White C.M., Smith D.H., Jones K.L., Goodman A.L., Jikich S.A., LaCount R.B., DuBose S.B., Ozdemir E., Morsi B.I. and Schroeder K.T., 2005. Sequestration of Carbon Dioxide in Coal with Enhanced Coalbed Methane Recovery - A Review. Energy & Fuels 19(3), 659-724.
White C.M., Strazisar B.R., Granite E.J., Hoffman J.S. and Pennline H.W., 2003. Separation and capture of CO2from large stationary sources and sequestration in
geological formations - coalbeds and deep saline aquifers. Journal of the Air &
Waste Management Association 53(6), 645-715.
Yu H., Yuan J., Guo W., Cheng J. and Hu Q., 2008. A preliminary laboratory experiment on coalbed methane displacement with carbon dioxide injection.
International Journal of Coal Geology 73(2), 156-166.
Yu H., Zhou G., Fan W. and Ye J., 2007. Predicted CO2enhanced coalbed methane
recovery and CO2sequestration in China. International Journal of Coal Geology