Fa gue behavior study of a dense graded HMA using
the four point bending beam test aided by an in-situ
instrumenta on at BR-116/RS, Brazil
Gracieli Bordin Colpo1, Lélio Antônio Teixeira Brito2, Dionísio Doering3,
Douglas Mar ns Mocelin4, Ana Paula Hilgert5, Marlova Johnston6, Jorge Augusto Pereira Cera37
1Federal University of Rio Grande do Sul – Brazil, [email protected] 2Federal University of Rio Grande do Sul – Brazil, [email protected]
3State University of Rio Grande do Sul and Slac Na,onal Laboratory – Brazil, [email protected] 4North Carolina State University – United States, dmar,[email protected]
5State University of Rio Grande do Sul – Brazil, [email protected] 6Federal University of Rio Grande do Sul – Brazil, [email protected] 7Federal University of Rio Grande do Sul – Brazil, [email protected]
Recebido:
7 de dezembro de 2018
Aceito para publicação:
1 de junho de 2019
Publicado:
15 de maio de 2020
Editor de área:
Francisco Thiago Aragão
ABSTRACT
Fa,gue is characterized by structural deteriora,on of a material when subjected to a state of repeated stress-strain cycles, thus resul,ng in cracking of the pavement and eventual failure a:er a sufficient number of cycles. The laboratory test commonly em-ployed in Brazil to analyze the fa,gue life is the indirect tensile test (IDT) under con-trolled stress. An alterna,ve test method is the four-point bending beam test (4PBBT), which leads the material to a more realis,c stress-state. This work examined the fa,gue behavior of an asphalt mixture with polymer-modified binder (PG76-11) using both IDT and 4PBBT. A road segment at BR-116/RS was instrumented to monitor mechanic re-sponses in the asphalt layer allowing the evalua,on of the material under real traffic, and through real-,me monitoring, enabling a beCer understanding of the distress levels in the structure. The results also demonstrate a closer rela,on between the 4PBB tests with in-service pavement fa,gue development.
RESUMO
A fadiga é caracterizada pela deterioração estrutural de um material quando subme,do a repe,dos esforços de tensão-deformação. O ensaio laboratorial comumente empre-gado no Brasil para análise de fadiga em misturas asfál,cas é o ensaio de tração indireta (IDT). Como alterna,va ao ensaio IDT, o ensaio de flexão em quatro pontos (4PBBT) sub-mete o material a um estado de tensões mais realís,co em relação ao campo. Este tra-balho avaliou o comportamento à fadiga de uma mistura asfál,ca com ligante modifi-cado por polímero (PG76-11) usando os ensaios IDT e 4PBBT. Um segmento da rodovia BR-116/RS, pavimentado com o mesmo material, foi instrumentado para monitorar as respostas mecânicas na camada asfál,ca, permi,ndo a avaliação do material sob condi-ções de tráfego real, e através do monitoramento ao longo do tempo, permi,ndo me-lhor entendimento do desgaste estrutural. Em relação aos ensaios laboratoriais, o en-saio 4PBBT apresentou uma melhor relação com o observado em campo.
Keywords:
IDT fa,gue test, Four point bending test, Pavement instrumenta,on, Fa,gue performance.
Palavras-chaves:
Ensaio de fadiga IDT,
Ensaio de flexão em quatro pontos, Instrumentação em pavimentos, Desempenho à fadiga.
DOI:10.14295/transportes.v28i2.1907
1. INTRODUCTION
The fatigue cracking is recognized as one of the main distress types in asphalt concrete pave-ments (Pell et al., 1961; Rowe, 1996; Harvey et al., 1995; Di Benedetto et al., 2004). This phe-nomenon occurs due to the accumulation of damage under the effect of repeated traf+ic loading. The tensile strain developed in the bottom of the wearing course leads the layer to cracking and
Various laboratory testing methods have been developed to characterize the fatigue re-sponse of asphalt concrete mixtures. In Brazil, the test commonly employed to analyze the fa-tigue life of asphalt mixtures is the indirect tensile test by diametral compression in cylindrical samples (IDT). This test is relatively simple to conduct and low cost, but feature some acknowl-edged disadvantages, such as permanent deformation on the loading strips due to high shear stresses, impossibility of separating damage due to fatigue from damage due to excessive creep +low for testing in inelastic materials, such as asphalt, and underestimation of the fatigue life (Tangela et al., 1990; Di Benedetto et al., 2004). Nonetheless, four point bending beam tests are recognized to display a better ability to simulate +ield conditions (Tayebali et al., 1994). In Brazil, the four point bending beam test has being employed for asphalt mixtures fatigue characteriza-tion in various research projects, such as Colpo (2014), Klinsky et al. (2014), Melo (2014), Ceratti et al. (2017) and Bessa (2017).
The monitoring of stresses and strains developed in pavement structures is of interest to pavement researches and engineers for a proper understanding of their structural behavior, which is crucial to pavement design, performance prediction and road management systems (Zejiao, Yiqiu and Meili, 2012). Measuring of the mechanical and environmental response of an in-service segment through instrumentation allows the comparison with laboratory behavior of the same asphalt mixture.
Pavement instrumentation can be an important tool for monitoring in-service material per-formance, structural responses under actual environmental and loading conditions, and also assist in the calibration of models (Leiva-Villacorta and Timm, 2012). Various instrumentation efforts pursued such purpose, allowing the validation and calibration of models that are actually used in mechanistic-empirical pavement design methods (Timm, Priest and McEwen, 2004; Priest, 2005; Ullidtz et al., 2006).
In tolled roads the development of a signi+icant super+icial cracked area is limited by the con-trol agencies and are subject to a penalty. Hence, pavement distress evolution depends on de-+lection control to help evaluating road structure as surfacing works are recurrent and the cracking assessment clouded. Because such procedure is affected by all layers’ resilient behav-ior interdependence and is in+luenced by weather, testing protocol and loci as well as equip-ment, tools to aid engineers to better evaluate the pavement structural condition ought to be investigated. All considered, a proper fatigue performance model becomes vital to anticipate the right moment of an intervention or repair in the structure, thus allowing adequate network managing.
This research was divided into two stages: +ield instrumentation of a tolled road segment in a federal highway and laboratory fatigue tests by means of IDT and 4PBB tests. Since the relation between the +ield and laboratory response is considered a challenge for road engineers this work aims to contribute to a better outlook on the instrumentation support towards such effort.
2. BACKGROUND
Fatigue phenomenon is considered the main mechanism of distress in +lexible pavements (Pell
et al., 1961; Preussler et al., 1981; Tangella et al., 1990; Matthews et al., 1993; Harvey et al.,
1995; Kim et al., 1997; Di Benedetto et al., 2004; Tapsoba et al., 2013; Mateos et al., 2017), and is highly dependent not only on material characteristics, but also on traf+ic and environmental conditions, which makes its interpretation and modeling complex.
The asphalt mixtures fatigue behavior is being studied throughout the years, with different considerations and approaches. Some approaches are purely empirical and observational, where the number of cycles at failure is related to the input of strain amplitude or stress level in a cyclic test. Other approaches include mechanistic elements and embodies a more phenom-enological view, relating the number of cycles at failure with parameters such as initial stiffness, dissipated energy, fracture mechanics and continuum damage.
The classic approach to access the number of cycles at failure (Nf) for a given tensile strain
amplitude or tensile stress level for asphalt mixture layers are so-called Wöhler curves (Equation 1 and 2). * b f t N =a
ε
− (1) * d f t N =cσ
− (2)where: Nf: Number of cycles at fatigue failure; εt: Tensile strain amplitude;
σt: Tensile stress level; a, b, c, d: Regression coef+icient.
Dissipated energy concept has been successfully used in the asphalt fatigue life prediction (Shen and Carpenter, 2005, 2007; Shen et al., 2006; Dondi et al., 2013; Subhy et al., 2017). Those methods are based on the assumption that the energy is absorbed by the material as damage, and the number of loading cycles at failure is related to the amount of energy dissipated during the test (Xiao, 2006).
Viscoelastic materials, when subjected to cyclic loading, present a hysteresis loop, once the loading and unloading path are not coincident due the viscoelasticity. The area inside this loop corresponds to the dissipated energy on that load cycle (Rowe, 1996; Ghuzlan and Carpenter, 2000), and can be calculated by Equation 3.
(3) where: DEi: Dissipated energy at load cycle i;
εi: Strain amplitude at load cycle i;
σi: Stress amplitude at load cycle i;
φi: Phase shift between stress and strain at load cycle i.
The classic fatigue models can be related to the initial dissipated energy as follows (Equation 4).
* f
f i
N =e DE− (4)
where: e, f: Regression coef+icient.
2.1. Fa gue Field Monitoring
For a proper construction or rehabilitation design of pavement structures, it is necessary to address the materials behavior under a wide range of loads and environmental conditions, such as temperature. To develop an adequate performance model for a given structure, it is manda-tory to understand the differences between laboramanda-tory performance tests and actual +ield re-sponses. In this sense, +ield instrumentation can be a powerful tool to better understand the actual response of the pavement under different conditions, which is not possible to simulate in laboratory (Al-Qadi and Nassar, 2003).
) sin( * * * i i i i DE =
π
ε
σ
ϕ
Pavement instrumentation has being used in several countries with satisfactory results, that helps to calibrate and validate models and pavement design methods (Brown, 1977; Tabatabafe and Sebaaly, 1990; Van Deusen et al., 1992; Silva e Motta, 1999; Priest and Timm, 2006; Mateos
et al., 2011). Most of the studies, nonetheless, are carried out in experimental sections and
con-trolled loading environment.
Garg et al. (2018) used +ield instrumentation data to develop a HMA fatigue model based on the ratio of dissipated energy change (RDEC). Various studies (Rowe, 1996; Ghuzlan and Car-penter, 2000; Subhy et al., 2017) have shown that RDEC, de+ined as the change of the dissipated energy between two cycles divided by the dissipated energy of previous cycle, provides a better indication of damage induced by the repeated load. This fatigue model for HMA is used in air-port pavement thickness design software FAARFIELD.
Leandri et al. (2013) observed that simulations of longitudinal and transversal strains pro-vide a good +it with the registered wave pulse, in terms of both shape and peak values. The sim-ulated vertical stress at the bottom of asphalt concrete layer well reproduce the peak values even if the shape is not exactly replicated, the tails of the registered pulse decrease more sharply than simulations.
Silva e Motta (1999) captured the Brazilian experience with pavement instrumentation and accredited that the +irst road instrumentation to an experiment in 1976, aiming to analyze poz-zolanic mixtures in the highway BR-101, in Santa Catarina state. Gonçalves (2002) used pave-ment-embedded instrumentation to evaluate six experimental segments subjected to a heavy vehicle simulator in an accelerated pavement loading facility on the Pavement Laboratory at Federal University of Rio Grande do Sul (LAPAV-UFRGS). Bastos (2016) also instrumented a pavement segment subjected to a heavy vehicle simulator, using strain gages, pressure cells, temperature and moisture sensors at Ceará state.
3. EXPERIMENTAL INVESTIGATION
The instrumentation process of the road segment and laboratory tests are described below. A bespoken data collection system with embedded signal processing and instruments signal-con-ditioners are detailed elsewhere (Ceratti et al., 2017).
3.1. Field instrumenta on
The structure of test section selected consists of a +lexible pavement with a bituminous layer of a hot mix asphalt (HMA) with polymer-modi+ied binder (8 cm thickness), a dense-graded ag-gregate base (15 cm) and granular subbase (30 cm) over a clayey subgrade.
Sensors embedded in pavement sections have proved useful in providing measured re-sponses as a basis of comparison. Various researches have instrumented pavement layers using strain gages and pressure cells to measure dynamic response to load in the form of strains and pressures (Timm, Priest and McEwen, 2004; Gonçalves, 2002; Leandri et al., 2013; Chaves et al., 2016). Following the same line of work, a road segment on BR-116/RS, in southern Brazil, was instrumented with these sensors in the bottom of asphalt wearing course.
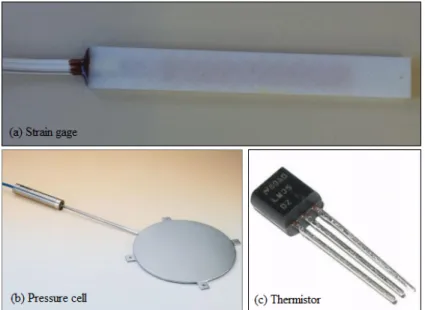
Sensors were selected in accordance with literature and the researchers experience and in-cluded six strain gages (SG) (Figure 1a), two pressure cells (PC) (Figure 1b) and six thermistors (Figure 1c). One of the pressure cells (model Geokon Earth Pressure Cell) featured a 1.0 MPa nominal maximum pressure (PC1) and the other 2.5 MPa (PC2); the strain gages (model Kyowa
KM-120-120-H2-11-W1M) were oriented to measure longitudinal, transverse and 45° strain, and the thermistors (model LM35) have the temperature range from -55 ºC to +150 ºC with ± 0.5ºC accuracy.
Figure 1. Sensors used on the experimental segment
All the sensors were installed in the bottom of the pavement wearing course. The +irst set (PC2 + 3 SG) was spaced 5 m apart longitudinally from the second set (PC1 + 3 SG) and located under the external wheel path of the external road lane. Figure 2 shows the sensor layout along the external wheel path.
Figure 2. Sensors installation layout
A custom data acquisition system (DAS) was developed as part of this research. The DAS per-forms signal conditioning, analog signal +iltering and ampli+ication, digitization and data pre-processing before sending it to an embedded single board computer for storage. The pre-pro-cessing implements a high pass +ilter to remove base line level variations (caused mainly due to temperature variations) and a trigger algorithm that sends a +lag indicating the start of a dy-namic event. The event +lag is set when the signal variation is higher than a user de+ined thresh-old. The system samples the analog signals at a rate of 450 points per second, per channel.
3.2. Laboratory tests
To evaluate the laboratory performance two test con+igurations were used, IDT and 4PBB. The specimens required for the tests were cored direct from the +ield, both cylindrical (for IDT tests) and prismatic (for the 4PBB tests). The procedure allowed evaluating the actual in situ density condition, as mixtures produced in an asphalt plant and in the laboratory may display differ-ences in performance (Rahbar-Rastegar and Daniel, 2016). Binder content for the hot mix as-phalt was 5.24% by weigh and featured apparent speci+ic gravity of 2.289.
The 4PBB test were carried out under controlled strain mode of 400 microstrains (με), 500 με and 600 με. In this study, a repeated sinusoidal loading at a frequency of 10 Hz was used. All tests were performed in a temperature-controlled chamber at 20 ± 0.5°C. The control and data acquisition software (UTS015) measured the de+lection of the beam specimen, computed the strain peak to peak in the specimen and adjusted the load applied by the loading device as per AASHTO T321 (2014).
The test apparatus also recorded load cycles, applied strain peak to peak, and beam de+lec-tions. Failure was assumed to occur when the stiffness reached half of its initial value, which is determined from the load at approximately 50 repetitions; the test was terminated automati-cally when stiffness was reduced by 50%. The dissipated energy, tensile stress and strain and +lexural stiffness of fatigue beam are determined by Equations 3, 5, 6 and 7 with the software UTS015 (AASHTO T321, 2014).
(5) (6) (7) where: σt: Tensile stress amplitude (kPa);
P: Peak force (kN);
L: Support span width (mm);
b: Average beam width (mm); h: Average beam height (mm);
εt: Tensile strain amplitude (με);
δ: Peak de+lection at the center of beam (mm); a: Loading span width (mm);
S: Flexural stiffness (MPa).
Note the validity of the equations above assume homogeneity of a linear viscoelastic, iso-tropic material. These equations consider the most stressed +iber in the bottom of the specimen, which should be the more stressed +iber, and consider the stresses/strains to be linear across the center transversal section of the specimen. Furthermore, the assumptions involved in the equations above are good approximations in the +irst cycles whilst damage is reduced and ma-terial integrity is unchanged. Although such considerations limit a fatigue study, they are rather simple approaches for application in the present research. The hysteresis loop is calculated us-ing these assumptions and so are calculated for the most stressed +iber.
The IDT was conducted under controlled stress mode of about 10%, 20%, 30%, 40% and 50% to the monotonic indirect tensile strength (ITS = 1.43 MPa). In this study, a cyclic haversine
2 * 1000000 * * h b L P t = σ 2 2 4* * 3 * * 12 a h h t − = δ ε t t S ε σ * 1000 =
loading at 1Hz frequency, with pulse time of 0.1 s and 0.9 s of rest, was used. The failure criteria adopted was 50% reduction in the initial resilient modulus. All tests were performed in a tem-perature-controlled chamber at 20 ± 0.5°C. The tensile stress and resilient modulus (MR) are determined by Equations 8 and 9.
(8) (9) where: σt: Tensile stress level (MPa);
P: Peak force (N);
d: Average specimen diameter (mm);
h: Average specimen height (mm);
MR: Resilient modulus (MPa);
∆: Resilient displacement of the specimen (mm);
µ: Coef+icient of Poisson.
4. RESULTS
4.1. Fa gue life
The results obtained for 4PBB fatigue tests are shown on Table 1. The results presented are the average of three specimens and the coef+icients of variation (COV) are also shown Figure 3 pre-sents the fatigue plot of 4PBB fatigue tests considering tensile strain and initial dissipated energy.
Table 1 – Results of fatigue test for 4PBB testing method
Sample Air voids (%)
Strain ampli-tude (με)
Initial flexural stiffness Initial dissipated energy Number of cycles at failure (Nf50%)
Initial flexural
stiffness (MPa) Average COV
(%)
Initial dissipated energy (J/m³)
Average COV (%) Nf50% Average COV (%)
1 4.2 400 5403 5455 6.3 397 393 5.3 1.80E+05 2.73E+05 30.2 2 4.1 5507 371 3.00E+05 3 4.2 6047 412 3.38E+05 4 4.3 500 5546 5592 1.3 613 615 1.9 1.01E+05 1.05E+05 3.5 5 4.3 5552 605 1.08E+05 6 4.3 5677 628 1.06E+05 7 4.1 600 5519 5560 0.9 871 895 2.4 4.34E+04 4.99E+04 11.9 8 4.1 5542 901 5.14E+04 9 4.1 5618 912 5.51E+04 h d P t * * * 2 π σ = ) 2692 . 0 * 9976 . 0 ( * * + ∆ = µ h P MR
The 4PBB fatigue tests performed on the mixture used on the experimental segment show a low variability with small coef+icient of variation. Both fatigue models, considering tensile strain and dissipated energy, show a good +itting to the data, with coef+icients of determination (R2) of
0.94 and 0.93, respectively.
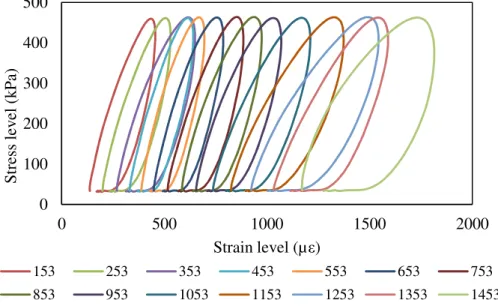
The hysteresis loops obtained for the 4PBB test with peak to peak strain of 500 µε is pictured on Figure 4. The loop area represents the dissipated energy due to dissipative phenomena as plastic dissipation and, mainly, damage growth.
The dissipated energy changes continuously along the fatigue process as the number of cy-cles increase, and the cracks initiate and propagate. In Figure 4 it can be observed a decrease in the loop area (i. e. energy) as the number of cycles increase, it happens as a consequence of the modulus reduction in the material throughout the test, in which the stress decreases to keep the displacement amplitude constant. The dissipated energy vs number of cycles can be +itted by a power function, as shown in Figure 5.
Figure 4. Typical stress-strain hysteresis loop for different number of cycles (4PBBT)
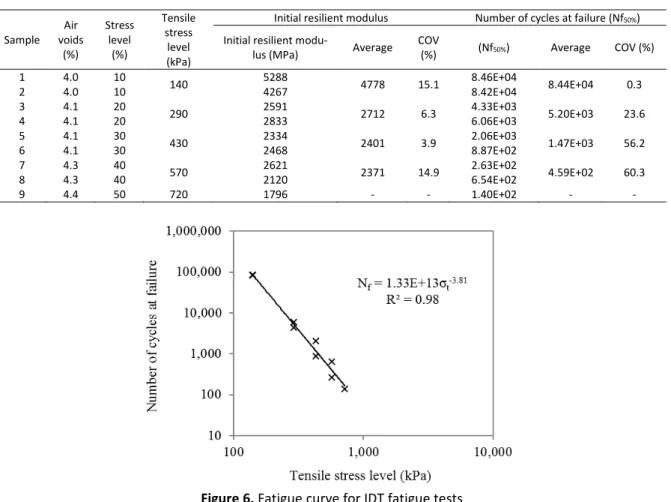
The IDT fatigue tests results are shown on Table 2. The Figure 6 presents the fatigue curve of IDT fatigue tests.
Table 2 – Results of fatigue test for IDT testing method
Sample Air voids (%) Stress level (%) Tensile stress level (kPa)
Initial resilient modulus Number of cycles at failure (Nf50%)
Initial resilient
modu-lus (MPa) Average COV (%) (Nf50%) Average COV (%) 1 4.0 10 140 5288 4778 15.1 8.46E+04 8.44E+04 0.3 2 4.0 10 4267 8.42E+04 3 4.1 20 290 2591 2712 6.3 4.33E+03 5.20E+03 23.6 4 4.1 20 2833 6.06E+03 5 4.1 30 430 2334 2401 3.9 2.06E+03 1.47E+03 56.2 6 4.1 30 2468 8.87E+02 7 4.3 40 570 2621 2371 14.9 2.63E+02 4.59E+02 60.3 8 4.3 40 2120 6.54E+02 9 4.4 50 720 1796 - - 1.40E+02 - -
Figure 6. Fatigue curve for IDT fatigue tests
The results for IDT fatigue tests shown high coef+icients of variation, which can be accredited to the instability promoted by the coring bit used to extract the specimens from the road seg-ment, and also by the severe loads applied, once the coef+icient is higher for higher loads. De-spite the variation, the coef+icient of determination for the +itting is high (R2 = 0.98).
The hysteresis loops obtained for an IDT test under controlled stress mode (stress level equivalent to 20% of ITS) is pictured on Figure 7. The energy increases with growing number of cycles due to a combined effect of strain increase, due to material’s micro cracking yielding to stiffness reduction, while stress is kept constant (Brito et al., 2008). It can be observed that in this test con+iguration there is an important strain accumulation on the material from cycle to cycle, this creep also contributes to damage. In IDT tests for viscoelastic materials is not pos-sible to separate the creep damage from the cyclic loading.
The different nature on how stresses and temperatures are combined in a scattered fashion in a real pavement create an unorderly fatigue development, as opposed to the laboratory. In IDT, strains increase constantly along the test, under controlled stress level, whereas in 4PBB, stresses decrease along the test, under a constant amplitude of controlled strain, in both sce-narios resulting in stiffness reduction due to materials’ integrity degradation.
Figure 7. Typical stress-strain hysteresis loop for different number of cycles (IDT)
Fatigue results are typically adjusted by a function which relates the effort imposed in the test to the number of cycles at fatigue failure. However, knowing the actual effort induced in the +ield is important to determine in which level the fatigue behavior should be analyzed, since the laboratory tests are carried out in different levels.
4.2. Signal processing – field data
The longitudinal strain gage shows alternate signal of contraction and extension, due to dy-namic nature of the loads, which impose different efforts depending on the position of gage in relation to the axle, while the transversal strain is always extension and the vertical stress is always compression (Perret, 2003).
To validate the +ield signals, some modelling were carried out using the software 3D-MOVE. The pavement parameters used in the analysis are shown in Table 3.
Table 3 – Material properties and layers thickness used in 3D-MOVE
Material Behavior Thickness (mm) Resilient Modulus (MPa) Poisson's ratio Bituminous layer Linear elastic/viscoelastic 80 Dynamic Modulus 0.30
Granular base Linear elastic 150 261 0.35
Granular subbase Linear elastic 300 291 0.35
Subgrade Linear elastic - 134 0.40
The longitudinal and transversal strain, and vertical pressure obtained from the instrumen-tation as well as from 3D-MOVE software are presented in Figure 7, for a single axle dual tires load with tire pressure of 560 kPa, speed of 80 km/h and temperature of 32ºC, for the asphalt layer. This temperature is based on the thermocouples reading embedded on the layer for the average temperature on which most of the readings were registered.
The simulated pavement responses are consistent with the +ield measurements, which vali-dates the data acquisition system. Regarding the shape of the signal, the vertical stress, trans-versal strain and longitudinal strain shows a better match for the set of data collected from the
0 100 200 300 400 500 0 500 1000 1500 2000 S tr es s le v el ( k P a) Strain level (µε) 153 253 353 453 553 653 753 853 953 1053 1153 1253 1353 1453
instrumentation than the signal magnitude, which can be attributed to the axle position in rela-tion to the sensors. According with Leandri et al. (2013), for little errors in the measurement of the relative position, the difference in the simulation can be high. The shape of stress load meas-ured by the pressure cell (PC) shows a difference on the unloading path compared to the simu-lated data (Figure 8a). The shape of unloading path is resimu-lated to the relaxation behavior of the asphalt materials and the observed difference can be either a data acquisition problem or an inability of the software to describe well this phenomenon of viscoelastic materials. Further investigation should be addressed to account for this difference.
(a) (b)
(c)
Figure 8. Vertical pressure (a), transversal strain (b) and longitudinal strain (c) simulated on 3D-MOVE and measured from the pavement structure
The simulated pavement responses are consistent with the +ield measurements, which vali-dates the data acquisition system. Regarding the shape of the signal, the vertical stress, trans-versal strain and longitudinal strain shows a better match for the set of data collected from the instrumentation than the signal magnitude, which can be attributed to the axle position in rela-tion to the sensors. According with Leandri et al. (2013), for little errors in the measurement of the relative position, the difference in the simulation can be high. The shape of stress load meas-ured by the pressure cell (PC) shows a difference on the unloading path compared to the simu-lated data (Figure 8a). The shape of unloading path is resimu-lated to the relaxation behavior of the asphalt materials and the observed difference can be either a data acquisition problem or an inability of the software to describe well this phenomenon of viscoelastic materials. Further investigation should be addressed to account for this difference
4.3. BR-116 Field Results
A series of 3000 events were collected to determine the level of stress and strains developed in the bottom of asphalt layer. The results (Figure 9) demonstrates that the longitudinal strains and vertical stresses rarely exceed 250 microstrains and 400 kPa, respectively. A “zero” vertical
stress and “zero” longitudinal strain in Fgiure 9, means 0 to 50 stress or strain reading; it is likely these readings are produced by light vehicles or high stress contact loads further away from sensors.
(a) (b)
Figure 9. Series of events collected for stress (a) and strain (b) in the bottom of asphalt layer
In laboratory, the strain level is usually higher than those obtained from +ield data, to make the tests faster. In the strain level observed in +ield data (less than 250 µɛ), the 4PBB shows a number of cycles to fatigue failure of 1.81*106, while IDT shows a number of cycles to fatigue
failure of 1.62*103 (for a stress of 400 kPa), according to the fatigue models calibrated for the
mixtures in this study.
The number of repetitions of a standard axle (N) in the road segment during the trial period, based on the American Association of State Highway and Transportation Of+icials (AASHTO) equivalent factors, was of 1.05*106 ESALs. This value is higher than the Nf obtained from fatigue
tests, even considering the same tensile strain observed in +ield; nonetheless, the pavement sec-tion did not develop any visible super+icial cracks during the trial period. Such difference cor-roborates to the importance of a correlation factor, or transfer function, from the laboratory to +ield result (Priest, 2005; Nascimento, 2015; Fritzen, 2016).
Considering a shift-factor of “4” to 4PBB tests (Mateos et al., 2011) and “104” for IDT tests
(Pinto, 1991), from literature, the number of cycles at failure would be 7.24*106 and 6.41*107,
respectively, for 250 microstrains and 400 kPa. A 4PBB approximation would suggest a pave-ment outlasting 6,9 times more traf+ic than that from the trial period, while an IDT fatigue life would suggest 61 times more traf+ic until pavement failed due to fatigue cracking. Although re-sults are not shown in this research, the continuous monitoring of the section assured a much better correlation to the 4PBB estimate.
5. CONCLUSIONS
The primary goal of this research was to draw a comparison between 4PBB and IDT fatigue tests results supported by an in situ instrumented test section. In order to accomplish the task, conceiving a reliable instrumentation capable of coping with real traf+ic condition was prime. The data acquisition system developed has proved to be effective and the readings were re-liable, highlighting a good adherence between modelled and collected results. The +iltering and pre-processing of signals allowed a loading wave shape without distortions and interferences, therefore becoming easily understandable and interpretable. The algorithm for identi+ication of a new event (vehicle hit) is also adequate, showing a good sensibility for this application and optimizing data collection size.
The fatigue tests protocols used for the research demonstrated to produce good quality re-sults. Regardless the aforementioned issues with IDT test con+iguration, the strain measure-ment allows for further analysis, such as dissipated energy calculation, which traditionally is not possible. The availability of a fatigue model for the 4PBB test using the dissipated energy concept turns available further discussion of the better correlation of this test to +ield data. Finally, although the pavement structure displayed a longer fatigue life span than laboratory tests, the 4PBB had a closer relation to +ield performance in comparison to IDT fatigue tests. ACKNOWLEDGEMENTS
The authors wish to express their gratitude for the LAPAV-UFRGS, UERGS, Triunfo|Concepa Concessionary, National Agency for Terrestrial Transportation (ANTT) and all other laboratory partners for their technical contribution and +inancial support to the research group.
REFERENCES
AASHTO (2014)
T321 - Determining the Fatigue Life of Compacted Hot-Mix Asphalt (HMA) Subjected to Repeated Flexural Bend-ing. American Association of State Highway and Transportation Of+icials, Washington, D.C.
Al-Qadi, I. L.; Nassar, W. N. (2003) Fatigue Shift Factors to Predict HMA Performance. The International Journal of Pavement Engineering, vol. 4, p. 69-75.
Bastos, J. B. S. (2016)
Considerações sobre a Deformação Permanente de Pavimentos Asfálticos no Dimensionamento Mecanís-tico-empírico. Tese (Doutorado em Engenharia), Universidade Federal do Ceará, Fortaleza.
Bessa, I. S. (2017) Laboratory and Field Study of Fatigue Cracking Prediction in Asphalt Pavements. Dissertation (Doctor of Sci-ence), Escola Politécnica of the Universidade de São Paulo, São Paulo.
Brito, L. A. T; Ceratti, J. A. P.; Victorino, D. R. (2008) Indicadores do Desempenho de Misturas Asfálticas Determinados através do
Ensaio de Compressão Diametral. Revista Transportes (Rio de Janeiro), v. 16, p. 36-44.
http://dx.doi.org/10.14295/trans-portes.v16i1.10.
Brown, S. F. (1977) State-of-the-art Report on Field Instrumentation for Pavement Experiments. Transportation Research Re-cord, nº 640, p. 13-28.
Ceratti, J. A. P.; Brito, L. A. T.; Colpo, G. B.; Doering, D. (2017)
Instrumentação In Situ de um Segmento da BR-116 - Estudo Com-parativo do Efeito Laboratório-campo da Fadiga. Concepa/ANTT, Recursos para Desenvolvimento Tecnológico – RDT.
Chaves, J. M. et al. (2016) Desenvolvimento do Modelo de Deterioração de Pavimentos Asfálticos com Uso de Instrumentação e
Sistema Weight in Motion. Autopista Fernão Dias/ANTT, Recursos para Desenvolvimento Tecnológico – RDT, Projeto 06,
SGP/AFD_06 REV.0.
Colpo, G. B. (2014) Análise de Fadiga de Misturas Asfálticas Através do Ensaio de Flexão em Viga Quatro Pontos. Dissertação (Mestrado em Engenharia) - Universidade Federal do Rio Grande do Sul, Porto Alegre.
Di Benedetto, H.; De La Roche, C.; Baaj, H.; Pronk, A.; Lundström, R. (2004) Fatigue of Bituminous Mixtures. Materials and Structures, vol. 37, p. 202-216.
Dondi, G.; Pettinari, M.; Sangiorgi, C.; Zoorob, S. E. (2013) Traditional and Dissipated Energy Approaches to Compare the 2PB
and 4PB Flexural Methodologies on a Warm Mix Asphalt. Construction and Building Materials, vol. 47, p. 833-839.
Fritzen, M. A. (2016)
Desenvolvimento e Validação de Função de Transferência para Previsão do Dano por Fadiga em Pavimen-tos Asfálticos. Tese (Doutorado em Engenharia). Universidade Federal do Rio de Janeiro – UFRJ/COPPE. Rio de Janeiro.
Garg, N.; Li, Q.; Haggag, M. (2018)
Accelerated Pavement Testing of Perpetual Pavement Test Sections under Heavy Aircraft Load-ing at FAA’s National Airport Pavement Test Facility. International Society for Asphalt Pavements - ISAP Conference,
Forta-leza, Ceará, Brazil.
Ghuzlan, K. A., Carpenter. (2000) Energy-Derived, Damage-Based Failure Criterion for Fatigue Testing. Transportation Research Record, Journal of the Transportation Research Board, nº 1723, Washington, D.C., p. 141-149. DOI: 10.3141/1723-18. Gonçalves, F. J. P. (2002) Estudo do Desempenho de Pavimentos Flexíveis a partir de Instrumentação e Ensaios Acelerados. Tese
(Doutorado em Engenharia). Universidade Federal do Rio Grande do Sul, Porto Alegre.
Harvey, J. T., Deacon, J. A., Tsai, B-W.; Monismith, C. L. (1995)
Fatigue Performance of Asphalt Concrete Mixes and its Relation-ship to Asphalt Concrete Pavement Performance in California. Report Prepared for California Department of
Transporta-tion, Nº RTA-65W48-2, Asphalt Research Program, Institute of Transportation Studies, University of California, Berkeley. Kim, Y. R.; Lee, H. J.; Little, D. N. (1997) Fatigue Characterization of Asphalt Concrete Using Viscoelasticity and Continuum
Dam-age Theory. Journal of the Association of Asphalt Paving Technologists, vol. 66, p. 633–685.
Klinsky, L.; Faria, V.; Oda, S.; Cavalcanti, L.; Barella, R. (2014)
Avaliação da inBluência do tipo de ligante asfáltico na vida de fa-diga de misturas asfálticas. In: Encontro do Asfalto, 21, Rio de Janeiro, IBP.
Leandri, P.; Bacci, R.; Di Natale, A.; Rocchio, P.; Losa, M. (2013)
Appropriate and Reliable use of Pavement Instrumentation on In-service Roads. Air+ield and Highway Pavement 2013: Sustainable and Ef+icient Pavements, pp. 1424-1433.
Leiva-Villacorta, F.; Timm, D. H. (2012) Simulating the Effects of Instrumentation on Measured Pavement Response. Advances in Pavement Design through Full-scale Accelerated Pavement Testing. Taylor & Francis Group, pp. 153-161.
Mateos, A., Ayuso, J. P., Cadavid, B. (2011) Shift Factors for Asphalt Fatigue from Full-scale Testing. Annual Meeting of the Transportation Research Board, CEDEX Transport Research Center.
Mateos, A.; Ayuso, J. P.; Cadavid, B. (2011) Shift factors for Asphalt Fatigue from Full-scale Testing. Annual Meeting of the Trans-portation Research Board, CEDEX Transport Research Center.
Mateos, A.; Wu, R.; Harvey, J.; Denneman, E.; Fan, A. (2017)
The Logit Model and the Need to Reproduce the Stiffness Degrada-tion Curve of Asphalt Specimens During Fatigue Testing. Transportation Research Record: Journal of the Transportation
Research Board, nº 2631, p. 105–113.
Matthews, J. M.; Monismith, C. L.; Craus, J. (1993) Investigation of Laboratory Fatigue Testing Procedures for Asphalt Aggregate
Mixtures. Journal of Transportation Engineering, vol. 119, p. 634-654, 1993.
Melo, J. V. S. de. (2014) Desenvolvimento e Estudo do Comportamento Reológico e Desempenho Mecânico de Concretos Asfálticos
ModiBicados com Nanocompósitos. Tese (Doutorado em Engenharia). Universidade Federal de Santa Catarina, Santa
Catari-ana.
Nascimento, L. A. H. do. (2015)
Implementation and Validation of the Viscoelastic Continuum Damage Theory for Asphalt Mix-ture and Pavement Analysis in Brazil. Dissertation (Doctor of Philosophy). Faculty of North Carolina State University.
Transportation Materials. Raleigh, North Carolina – USA.
Pell, P. S.; Mccarthy, P. F.; Gardner, R. R. (1961) Fatigue of Bitumen and Bituminous Mixes. International Journal of Mechanical Sciences. vol. 3, p. 247-267.
Perret, J. (2003) Déformations des Couches Bitumineuses au Passage D‘une Charge de TraBic. Tese (Doutorado em Engenharia Civil). Ebcole Polytechnique Fédérale de Lausanne, Lausanne.
Pinto, S. (1991)
Estudo do Comportamento à Fadiga de Misturas Betuminosas e Aplicação na Avaliação Estrutural de Pavimen-tos. Tese (Doutorado em Engenharia) – Universidade Federal do Rio de Janeiro, Rio de Janeiro.
Preussler, E. S.; Pinto, S.; Medina, J. (1981) Determinação da Vida de Fadiga de Concretos Asfálticos Brasileiros e Aplicação no
Dimensionamento de Reforço de Pavimentos. Reunião Anual de Pavimentação, 16. Recife: ABPV.
Priest, A. L. (2005) Calibration of Fatigue Transfer Functions for Mechanistic-empirical Flexible Pavement Design. Thesis (Mas-ters of Science). Faculty of Auburn University, Aubum, Alabama.
Priest, A. L; Timm, D. H. (2006) Methodology and Calibration of Fatigue Transfer Functions for Mechanistic-Empirical Flexible
Pavement Design. National Center for Asphalt Technology, NCAT, Auburn University, NCAT Report 06-03.
Rahbar-Rastegar, R.; Daniel, J. S. (2016) Laboratory versus Plant Production: Impact of Material Properties and Performance for
RAP and RAS Mixtures. International Journal of Pavement Engineering. pp. 1-12.
Rowe, G. M. (1996) Application of the Dissipated Energy Concept to Fatigue Cracking in Asphalt Pavements. PhD Thesis, Univer-sity of Nottingham, Nottingham.
Shen, S.; Carpenter, S. H. (2005) Application of Dissipated Energy Concept in Fatigue Endurance Limit Testing. Transportation Research Record, Journal of the Transportation Research Board, nº 1929, Washington, D.C., p. 165-173.
Shen, S.; Carpenter, S. H. (2007) Dissipated Energy Concepts for HMA Performance: Fatigue and Healing. COE report nº. 29. Cen-ter of Excellence for Airport Technology, Department of Civil and Environmental Engineering, University of Illinois at Ur-bana-Champaign, Champaign-Urbana Metropolitan Area, Illinois, USA.
Shen, S; Airey, G. D.; Carpenter, S. H.; Huang, H. A. (2006) Dissipated Energy Approach to Fatigue Evaluation. Road Materials and Pavement Design, vol. 7, p. 47-69. Doi: 10.1080/14680629.2006.9690026.
Silva, P. D. E. A.; Motta, L. M. G. (1999) Instrumentação da Pista Circular Experimental do IPR/DNER. Transportes, vol. 7, nº 2, p. 29-46.
Subhy, A.; Presti, D. L.; Airey, G. (2017) New SimpliBied Approach for Obtaining a Reliable Plateau Value in Fatigue Analysis of
Bituminous Materials. Engineering Failure Analysis. Doi: 10.1016/j.engfailanal.2017.05.021.
Tabatabafe, N.; Sebaaly, P. (1990) State-of-the-art: Pavement Instrumentation. Transportation Research Record, nº 1260, p. 246-255.
Tangella, S. C. S. R., Craus, J., Deacon, J. A.; Monismith, C. L. (1990) Summary Report on Fatigue Response of Asphalt Mixtures. Prepared for Strategic Highway Research Program, Project A-003-A. Institute of Transportation Studies, University of Cali-fornia, Berkeley.
Tapsoba, N.; Sauzéat, C.; Di Benedetto, H. (2013) Analysis of Fatigue Test for Bituminous Mixtures. Journal of Materials in Civil Engineering, vol. 25, p. 701-710. DOI: 10.1061/(ASCE)MT.1943-5533.0000636.
Tayebali, A. A.; Deacon, J. A.; Coplantz, J. S.; Finn, F. N.; Monismith, C. L. (1994) Fatigue Response of Asphalt Aggregate Mixtures,
Part I e II. Strategy Highway Research Program, Project A-404. Asphalt Research Program, Institute of Transportation
Studies, University of California.
Timm, D. H.; Priest, A. L.; Mcewen, T. V. (2004) Design and Instrumentation of the Structural Pavement Experiment at the NCAT
Test Track. National Center for Asphalt Technology, NCAT, Auburn University, NCAT Report 04-01.
Ullidtz, P.; Harvey, J.; Tsai, B.-W.; Monismith, C. L. (2006) Calibration of CalME Models using WesTrack Performance Data. Cali-fornia Department of Transportation Division of Research and Innovation Of+ice of Roadway Research, Report nº UCPRC-RR-2006-14.
Van Deusen, D. A.; Newcomb, D. E.; Labuz, J. F. (1992) A Review of Instrumentation Technology for the Minnesota Road Research
Project. University of Minnesota.
Xiao, F. (2006) Development of Fatigue Predictive Models of Rubberized Asphalt Concrete (RAC) Containing Reclaimed Asphalt
Zejiao, D.; Yiqiu, T.; Meili, L. (2012) Design and Implementation of a Full-scale Accelerated Pavement Testing Facility for Extreme
Regional Climates in China. Advances in Pavement Design through Full-scale Accelerated Pavement Testing. Taylor &