A fuzzy mul criteria method for ranking the factors
that influence the se$lement of Brazilian highway
speed limits
Gabriel Andrade Lanzaro1, Michelle Andrade2
1University of Brasilia, Brasilia, Brazil, [email protected] 2University of Brasilia, Brasilia, Brazil, [email protected]
Recebido:
31 de maio de 2019
Aceito para publicação:
6 de novembro de 2019 Publicado: 31 de agosto de 2020 Editor de área: Flávio Cunto ABSTRACT
The process of se$ling highways speed limits involves a high number of factors, not clearly defined in terms of an order of relevance that allows the expert – responsible for making the decision – choose the best solu on. Since the establishment of a speed limit is based on subjec vity, being governed by uncertainty and imprecision, the fuzzy logic stands out as an alterna ve for the solu on of the problem. Therefore, experts from the area were ques oned about the influence of pre-determined factors on highway speed limits and, a9er that, a mul criteria fuzzy decision-making method, op mized by a gene c algorithm, was used, so that the variables could be ordered concerning weights and, consequently, relevance. The method converged to sa sfactory results, which may allow not only the concep on of an expert system for the se$lement of speed limits, but also the applica on in other fields.
RESUMO
O processo de definição da velocidade limite em rodovias envolve uma série de fatores, não claramente definidos em termos de uma ordem de relevância que possibilite o especialista – responsável por tomar decisão – optar pela melhor escolha. Como o estabelecimento de um limite de velocidade se caracteriza pela subje vidade, sendo um processo regido pela incerteza e pela imprecisão, a lógica fuzzy mostra-se como alterna va para a solução deste problema. Assim, especialistas da área foram ques onados quanto à influência de fatores pré-determinados na velocidade limite de rodovias e, em seguida, foi aplicado um método fuzzy mul critério, o mizado por meio de um algoritmo gené co, para que as variáveis fossem hierarquizadas em termos de pesos e, consequentemente, relevância. O método convergiu a resultados sa sfatórios, possibilitando não somente a concepção de um sistema especialista para o estabelecimento de velocidades limites, mas também aplicações em outras áreas.
Keywords:
Speed Limits. Fuzzy Mul criteria. Gene c Algorithm. Brazilian Highways.
Palavras-chaves:
Velocidade Limite. Fuzzy mul critério. Algoritmo gené co. Rodovias brasileiras.
DOI:10.14295/transportes.v28i3.2067
1. INTRODUCTION
The settlement of a speed limit in a roadway segment is an effort of great importance for traf ic low. The proper de inition of a speed limit represents a meaningful role in terms of assuring better luidity, but also minimizing crash risk, and it is a hard task to ind a balance between these goals (Correia and Silva, 2011). Therefore, the dif iculty focuses on inding a consistent speed limit, encompassing many relevant questions to road users, including drivers, pedestrians and cyclists.
Brazilian highways are conceived to meet a speci ic design speed, according to a technical classi ication (and, consequently, to a traf ic volume), given a terrain classi ication (DNER, 1999). However, the disordered growth of urban centers allowed, in many cases, roadside occupation, resulting in conditions not originally foreseen by the Manual of Geometric Design of Rural Highways (DNER, 1999), such as pedestrians and intersections.
Besides that, sometimes it is not possible to keep a continuous alignment, with minor defects, in the entire road. The existence of segments with adverse conditions, due to design laws or inevitable circumstances because of the terrain, makes necessary the reduction of speed, and it is expected that signaling elements warn the driver about the danger.
Thus, despite being desirable the maintenance of a single speed throughout the highway, a change might be needed because of unfavorable conditions. However, one of the greatest dif iculties is the fact of not knowing, exactly, how some factors may impact the choice of a speed limit for a roadway segment.
In Brazil, the Manual of Vertical Signaling for Regulation (CONTRAN, 2007) enumerates some relevant elements to settle speed limits, but it does not explain how the factors are related and how exactly they in luence the establishment of a speed. For instance, in the referred manual, elements such as land use (urban or rural) and crash data are highlighted. However, it is not known which of these factors should be the most preponderant when de ining a speed limit.
The considerable number of variables for establishing a speed limit suggests that multicriteria decision-making methods may be used for a proper ranking of the factors. Such ranking stands out as of great importance for identifying the factors that must be prioritized when the expert, responsible for settling a roadway speed limit, makes a decision, that could be a more coherent one and less ruled by subjectivity.
Because of these reasons, this study aims to rank the variables that in luence the process of choosing a speed limit, with the application of a fuzzy multicriteria decision-making method, that was capable of providing weights to these variables. To do so, arti icial intelligence technics – fuzzy logic and genetic algorithms – were used to deal with the complexity of the problem, but also with the related uncertainty.
2. A LITERATURE REVIEW OF FACTORS THAT INFLUENCE THE SETTLEMENT OF SPEED
LIMITS
For Brazilian highways, in terms of a national level, the speed limit is regulated by the Brazilian Traf ic Code (CTB), according to Law No. 13281. It is established that the speed limit must be indicated by signaling, provided by the road’s technical characteristics and, consequently, traf ic volume (Brasil, 2016). Although the CTB does not present relevant factors for settling speed limits, the Manual of Vertical Signaling for Regulation (CONTRAN, 2007) mentions 13 elements that must be taken into consideration when an engineering study for de ining a speed limit is conducted:
• Land use (urban or rural);
• Technical classi ication;
• Existence and conditions for on-road movements;
• Existence and conditions for parking, stop and access;
• Operational speed (V85);
• Pavement’s conditions and characteristics;
• Shoulder’s conditions and characteristics;
• Conditions of vertical and horizontal alignment;
• Safety in curves;
• Crash data;
• Pedestrian and cyclists’ conditions;
• Traf ic composition, including heavy vehicles.
Despite the reference to these factors, there is not a clear de inition of possible weights of these elements in terms of a relative importance between each other, which makes the settlement of speed limits a subjective task. To solve this problem, Marques (2012) used the analytical hierarchic process to obtain an order of relevance of these factors, after questioning some experts from distinct state and federal traf ic agencies.
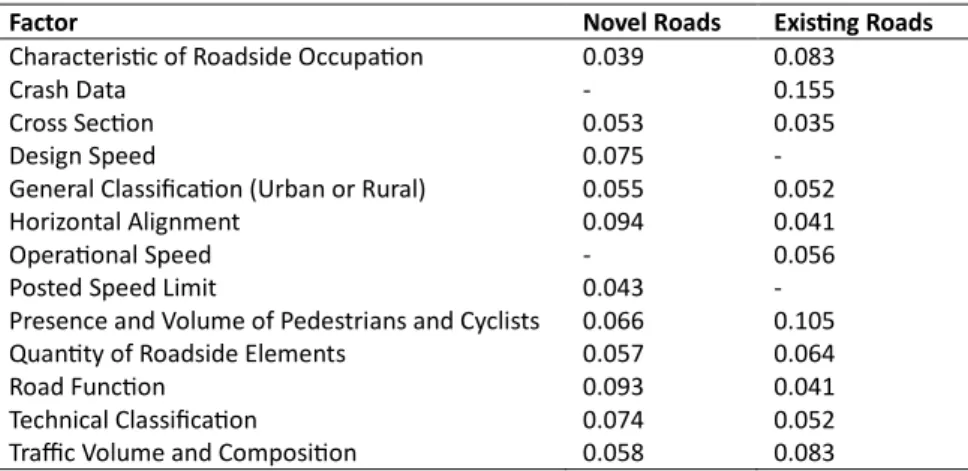
The questionnaire distinguished novel and existing roads, but with an attempt of including similar factors in both analyses. To do so, factors such as “presence and volume of pedestrians and cyclists” and “volume and traf ic composition,” for instance, were discerned concerning estimated and measured data. Table 1 summarizes the factors considered of great importance by the author, with its weights, on a scale from 0 to 1.
Table 1 – Factors of great importance for the settlement of speed limits in Brazilian highways, according to Marques
(2012)
Factor Novel Roads Exis7ng Roads
Characteris c of Roadside Occupa on 0.039 0.083
Crash Data - 0.155
Cross Sec on 0.053 0.035
Design Speed 0.075 -
General Classifica on (Urban or Rural) 0.055 0.052
Horizontal Alignment 0.094 0.041
Opera onal Speed - 0.056
Posted Speed Limit 0.043 -
Presence and Volume of Pedestrians and Cyclists 0.066 0.105
Quan ty of Roadside Elements 0.057 0.064
Road Func on 0.093 0.041
Technical Classifica on 0.074 0.052
Traffic Volume and Composi on 0.058 0.083
Gregório et al. (2016) developed a system capable of assessing a relationship between speed limits and some pre-de ined factors, which were selected based on previous research or experts’ opinions. This relationship was estimated by the multinomial logit model, and the study focused on Portuguese two-lane, two-way road segments. The variables considered by the authors are presented in Table 2.
Table 2 – Variables selected by Gregório et al. (2016) for the development of a speed limit model
Variable Type
Buildings’ Pedestrian Accesses Discrete
Bus Stops Discrete
Filling Sta ons Discrete
Individual Parking Accesses Discrete
Intersec ons Discrete
Motorized Traffic Lateral Accesses Discrete On-Road Parking Spaces Discrete
Pedestrian Crossings Discrete
Pedestrian Paths’ Accesses Discrete
Central Islands Binary
Lateral Restric ons (high level) Binary Lateral Restric ons (medium level) Binary
Sidewalks Binary
The authors decided not to include variables involving crash data, operational speed and traf ic volume mainly because of the dif iculty to obtain this information and, besides that, to allow the application of the model by the technical community. The analysis was intended to be as objective as possible, with the inclusion of discrete and binary elements, but lateral restrictions, for instance, were subjective, since they contained elements not segmented in the model.
In the United States, the Manual on Uniform Traf ic Control Devices, that settles the signaling guidelines in the country, recommends some factors that should be taken into consideration when de ining speed limits in roads (MUTCD, 2009):
• Operational speed (V85);
• Road characteristics: shoulder, grade, alignment and sight distance;
• The pace of speed with a tolerance of 10 mph (16 km/h);
• Roadside occupation and land use;
• Parking and pedestrian activities;
• Reported crash data for at least a 1-year period.
Despite it being a national recommendation, many states possess their own guidelines for settling speed limits. After a survey conducted by the Institute of Transportation Engineers (2001 apud Fitzpatrick et al., 2003), it was veri ied that the V85 represented the preponderant factor, since it was used by almost all the agencies researched. Besides that, other highly mentioned elements were road geometry, reported crash data, and political pressure for maintain or changing a speed limit.
In another study, conducted for the Texas Department of Transportation, Fitzpatrick et al. (1997 apud Marques, 2012) wanted to investigate the relationship between speed limits, operational speed and design speed. In addition to the previously mentioned factors, roadside occupation, pedestrian and cyclist activity, traf ic volume, legal speed established by the state, and safe speed recommended for curves were highlighted by experts.
In Australia, speed limits must be de ined based on environment and driving condition factors. The combined effect of these is generally incorporated into the expert system XLIMITS (AUSTROADS, 2005), that consists of:
• Road and road environment: road function, number of lanes and width, vertical and horizontal alignment, presence and conditions of road shoulders, pavement condition, sidewalks, presence of medians, presence and quantity of roadside elements, frequency of roadside accesses, and presence of traf ic signals;
• Roadside occupation: type of occupation (rural, residential, commercial or industrial), presence of schools, hospitals, and other traf ic generators;
• Road user activity: pedestrians, cyclists, and heavy vehicles;
• Crash data;
• Operational speed (V85);
• Traf ic volume;
• Adjacent speed limits.
The United Kingdom’s Department of Transportation (DfT, 2012) emphasizes that speed limits must be self-explanatory so that they can reinforce a self-evaluation for drivers concerning a safe speed for a speci ic road segment. Because of that, the most important factors
that in luence the settlement of speed limits are: crash data, road function, composition of road users, operational speed, and road environment. The department also states that, before altering speed limits in regions that may present an adverse situation, studies must be conducted to attempt the maintenance of a constant speed in the entire road length.
Therefore, it can be seen that different agencies (CONTRAN, 2007; MUTCD, 2009; AUSTROADS, 2005; DfT, 2012), and also the studies conducted by Marques (2012) and Gregório
et al. (2016), may use different factors to settle speed limits, but some of them are in fact widely
employed, such as roadside occupation, operational speed (V85), crash data, and pedestrian activity. However, the big number of factors suggests that methods can be used to rank the most important ones, which is the objective of this study.
3. ARTIFICIAL INTELLIGENCE TECHNIQUES
In order to use a fuzzy multicriteria decision-making method, the fuzzy logic and a genetic algorithm were used. This section, thus, presents the basic concepts of such techniques that were the basis for obtaining weights and, with that, ranking the variables that in luence the settlement of highway speed limits.
3.1. Fuzzy logic
Some problems have no clear classi ication and are subject to certain degrees of imprecision and uncertainty. For instance, classifying people concerning stature, tall or short, becomes a dif icult task since there is not an explicit distinction between these variables, and the de inition of how tall one is might be associated with the subjectivity of each person. When it comes to human nature, in fact, the ability of transmitting information is more related to imprecise variables (such as the linguistic variables) instead of numeric ones (Zadeh, 1973).
This is different, for example, from the boolean algebra, in which only two results are admitted, true or false, generally de ined as 0 or 1. To overcome this issue, Zadeh (1965) developed the fuzzy set theory, that made possible the obtainment of intermediate values between the limits of 0 and 1.
A fuzzy set can be de ined according to the original ideas proposed by Zadeh (1965). Let X be a space of points, with a generic element of X denoted by x. A fuzzy set A in X is characterized by a membership function fA(x) which associates with each element of X a real number in the
interval [0,1], that is:
: ⇒ [0,1] (1) If fA(x) = 1, there is an indication that x is completely compatible to A, while, if fA(x) = 0, there
is a total incompatibility.
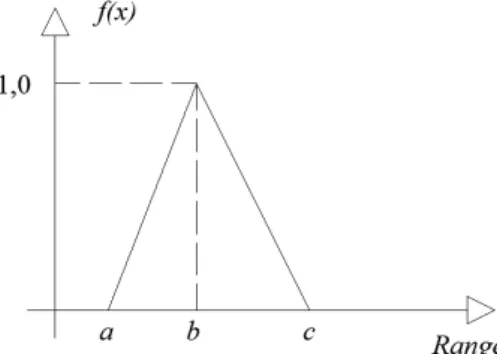
One of the most used types of membership functions is the triangular, that may be mathematically represented by Equation 2. Graphically, the numbers a, b and c are illustrated in Figure 1. ; , , = ⎩ ⎪ ⎨ ⎪ ⎧ 0,, ≤ ≤≤ , ≤ ≤ 0, ≤ (2)
Problems related to the decision-making process are uncertain under a lot of aspects. Despite the attempt of solving it with theories from probability and statistics, the perceptions of many
people are expressed in terms of linguistic variables, which represents the possibility of introducing the fuzzy set theory (Mardani et al., 2015).
Figure 1. A Triangular Membership Function
Therefore, considering the effect of uncertainty when making a decision that involves multiple criteria is important. For instance, there is a big number of factors that in luence the settlement of speed limits and selecting the most relevant ones constitutes one direct application of a multicriteria decision-making method in a fuzzy context, since the variables are of dif icult distinction and characterization. This methodology allows the possibility of obtaining weights, that are capable of exposing the variables in terms of a rank.
Carlsson and Fullér (1996), for example, basically proposed four methods for multicriteria decision-making analyses:
• For ranking variables;
• For assessing the relative importance of multiple attributes;
• For optimizing linear programming;
• For group decisions and negotiation theory.
3.2. Gene7c Algorithm
Inspired by Darwinism, genetic algorithms are heuristic methods for solving problems, whose main advantage is cost and time reduction (Bauchspiess, 2008). Because of their simplicity, genetic algorithms possess large applications in many areas as a methodology for optimization (Arslan and Kaya, 2001).
These algorithms start with a random initial population of individuals, in which each individual represents a possible solution to the problem. Such individuals evolve in sequential generations, and, in each of them, these individuals are evaluated in terms of a degree of itness to the problem. The procedure continues until a previously established end condition is reached (Sakawa, 2001).
The individuals in a genetic algorithm population are represented by means of chromosomes, and each locus (that represents a gene) has two possible alleles: 0 and 1. To create the next generations, three genetic operators are generally used (Mitchell, 1998):
• Selection: chromosomes from the population are chosen for reproduction and, the higher the degree of itness, the more likable becomes their selection for reproduction;
• Crossover: the operators randomly choose a locus in the chromosome and change information before and after such position in each pair;
In order to evaluate the individuals according to natural selection, itness techniques are used and, because of that, evaluation functions are developed. These functions constitute important connections between genetic algorithms and systems, since they are able to measure the performance of a chromosome in a given situation. In such context, a scale analysis is necessary so that it can allow the reorganization of individuals after new generations and, consequently, the population’s increase. Therefore, it allows that stronger chromosomes reproduce and the less it, even in the next generations, be eliminated (Arslan and Kaya, 2001). To assure faster itness, a technique called elitism can be used. It tries to prevent that the best chromosomes be lost from one generation to the next after genetic operations. Because of that, the most proper ones are automatically transferred to the next generation (Gonçalves, 2016).
4. MODELLING APPROACH AND JUSTIFICATION
When dealing with people’s perceptions, the Likert Scale can be used to quantify thoughts in terms of numerical values, such as if speci ic factors in luence or not the occurrence of a particular phenomenon. In these cases, people may indicate if they agree or not with statements not through binary responses – agree or disagree – but by means of a degree of agreement on a scale.
However, the Likert Scale’s traditional use assumes that all respondents present exactly the same perception of a linguistic variable. For instance, if two people mention that they fairly agree with a certain statement on a scale from 1 to 5, the answers would not necessarily be the same if the scale employed were different, such as from 1 to 10.
Therefore, the utilization of this scale, in a direct way, besides presuming that the linguistic variables are equally spaced, does not consider the degree of uncertainty and ambiguity from the respondents (Hu, 2009). These characteristics suggest that a fuzzy multicriteria decision-making method can be an alternative to deal with this problem.
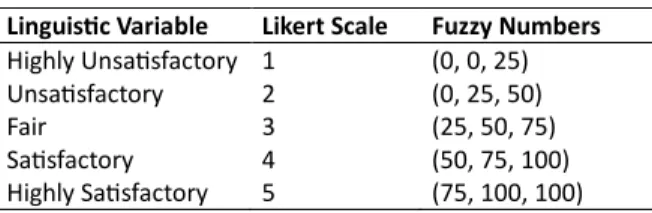
Hu et al. (2011) describe an example of triangular membership functions – and their corresponding numbers a, b and c – for the traditional Likert Scale. This example is presented in Table 3. The linguistic variables – highly unsatisfactory to highly satisfactory – can change depending on the case study. For instance, if people were asked about the in luence of a particular factor on an existing condition, the membership functions and their linguistic variables would be similar to those illustrated in Figure 2.
Table 3 – Linguistic variables for traditional likert scale and Fuzzy Sets (Hu et al., 2011)
Linguis7c Variable Likert Scale Fuzzy Numbers
Highly Unsa sfactory 1 (0, 0, 25)
Unsa sfactory 2 (0, 25, 50)
Fair 3 (25, 50, 75)
Sa sfactory 4 (50, 75, 100)
Highly Sa sfactory 5 (75, 100, 100)
For ranking factors, which is the objective of this study, weights can be assigned to each variable and the factors with the highest weights would be considered the most important.
The methodology for obtaining weights was based on the one proposed by Hu (2009), that used a fuzzy multicriteria decision-making method to determine the most relevant factors for assessing service quality of travel websites. With the objective of measuring the degrees of
importance of each variable of interest, an equation, referring to an error, was formulated by means of fuzzy numbers from triangular membership functions. This equation was minimized with the aid of a genetic algorithm.
Figure 2. Membership Functions in terms of Degrees of Influence
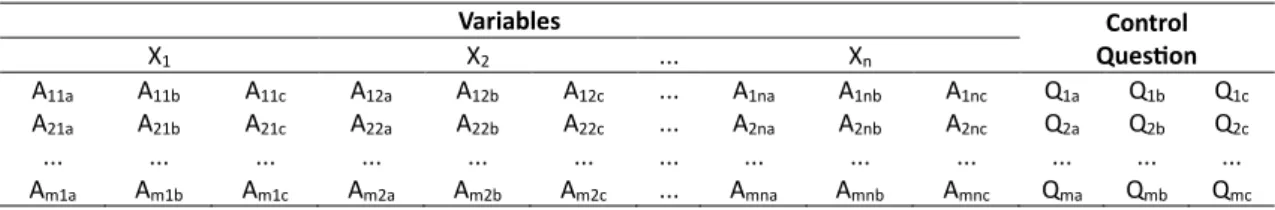
Let a questionnaire with n variables (that is, factors that may in luence a phenomenon), m respondents and a control question Q. Being the variables de ined as X and each answer, based on the Likert Scale, as A, the Table 4 can be presented as the results after a questionnaire application.
Table 4 – Answers from a questionnaire
Variables Control Ques7on X1 X2 ... Xn A11 A12 ... A1n Q1 A21 A22 ... A2n Q2 ... ... ... ... ... Am1 Am2 ... Amn Qm
As each answer A and control question Q refer to a value from the Likert Scale (on a scale from 1 to 5), each one is associated to three fuzzy numbers from the triangular membership functions. Therefore, in which a, b and c represent these fuzzy numbers, Table 4 is extended into Table 5.
Table 5 – Insertion of fuzzy numbers in the answers from a questionnaire
Variables Control
Ques7on
X1 X2 ... Xn
A11a A11b A11c A12a A12b A12c ... A1na A1nb A1nc Q1a Q1b Q1c
A21a A21b A21c A22a A22b A22c ... A2na A2nb A2nc Q2a Q2b Q2c
... ... ... ... ... ... ... ... ... ... ... ... ...
Am1a Am1b Am1c Am2a Am2b Am2c ... Amna Amnb Amnc Qma Qmb Qmc
The control question can be used to evaluate if the responder agreed with the importance of the research, that is, if de ining factors is an important process for better characterizing and understanding a phenomenon. For this speci ic question, the linguistic variables were not the ones presented in Figure 2, since the control question was supposed to deal with agreement, and not in luence. Therefore, the scale, just for this question, went from “strongly disagree” to “strongly agree”. 0 0,2 0,4 0,6 0,8 1 0 20 40 60 80 100 M em b er sh ip Degree of Influence
Very Weak Influence Weak Influence Fair Influence Strong Influence Very Strong Influence
This question is to calculate the difference between the fuzzy numbers referent to it and the ones related to the answers A, and such difference was named as an error. For the variables of greater importance, it was expected that the error would be minimum because, if a group of people believe that one factor strongly in luences the occurrence of a phenomenon and that the de inition of factors is an important process to it, then this factor must be included in the model. That is, the smaller the error, the greater the importance of the corresponding factor.
The answers A were multiplied by their respective weights, referent to each variable X, denominated w1, w2, …, wn. Thus, the problem consisted of inding the weights that minimize
the following equation, in terms of a mean squared error, as expressed by Equation 3.
= ∑ ∑2%01 /(01"#$% − '(⋅ *%( +,+ #$% − '(⋅ *%( +,+ #$% − '(⋅ *%( +,. (3) This problem also required to satisfy some constraints in order to obtain weights that were coherent to the multicriteria fuzzy decision-making method.
Let the values of each line from Table 5 be summed, for each fuzzy number corresponding to the membership function (a, b and c), variable X and control question Q. The sum S of each column can be expressed by Equations 4 and 5.
3 / , , = ∑ *2%01 %/ , ∑ *2%01 %/ , ∑ *2%01 %/ (4)
34 , , = ∑ $2 %
%01 , ∑ $2%01 % , ∑ $2%01 % (5)
Therefore, 3 × (n + Q) numeric values were obtained, represented by the sums Sxn for the
variables X1, X2, ..., Xn and by the sums SQ for the control question. These values were placed in
matrixes and, using the same logic to minimize the weights from the median squared error, the weights w1, w2, …, wn were used in the sums Sxn so that the equations could result in the sums SQ.Hence, three additional equations were de ined, and each one of them was associated to a fuzzy number from the triangular membership functions. Equation 6 illustrates the proposed linear system for these three equations.
633 11 3 1 33 ,, 3 , …… … 3 / 3 / 3 / 8 × 6 '1 '…, '/ 8 = 6 34 34 34 8 (6)
Also, the weight’s sum must be equal to 1, which represents another constraint, that is represented by Equation 7.
'1+ ',+ ⋯ + '/ = 1 (7) This being said, the problem can be summarized to Equation 3’s minimization subject to four constraints (linear system provided by Equation 6 and Equation 7). In cases with a high number of variables, an analytical solution is likely not possible due to the bigger number of variables when compared to the number of equations.
Because of this, the usage of genetic algorithms, that can be employed in optimization problems, highlights as an alternative to the solution. Osyczka (2002 apud Hu, 2009) recommends the adoption of some parameters for these algorithms, when concerning classi ications based on the fuzzy logic.
• Size of the population: 100 individuals;
• Number of generations: 2000;
• Elitism: 2 individuals;
For the proposed minimization in this study, the population’s size was increased to 200 individuals in order to obtain more consistent results. Besides that, a crossover fraction of 80% was used, and, for mutation, a 20% one. The selection method was the stochastic uniform, as de ined by MathWorks (2018).
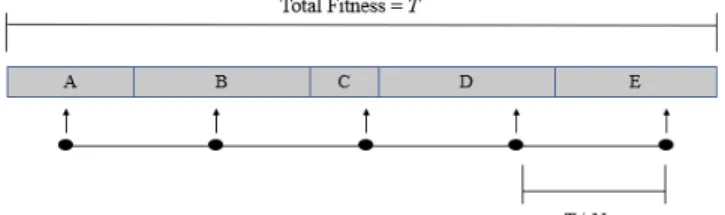
In this method, the algorithm creates a line T in which each individual corresponds to a fragment of this line, with length proportional to its itness expectancy. These individuals are the parents of the next generation. After that, the algorithm moves along this line in equal steps, one for each parent, expressed in terms of a proportion of the line T by the number of individuals N. Then, it allocates the next parents so that the next generation can be performed. The irst generation’s placement is always random (Pecheva et al., 2009). Besides that, as the method moves along the whole line, it reduces the possibility of premature convergence.
Figure 3 illustrates this procedure for ive individuals (A, B, C, D and E). The arrows correspond to the moments of selection, in which there is a parental modi ication. The placement of the irst selection is random, though, as stated.
Figure 3. The Stochastic Uniform Selection Method (Pecheva et al., 2009)
After obtaining the weights through Equation 3’s minimization, that was used as the itness function for the genetic algorithm, some values did not converge to the interval [0,1], as expected, but to [-1, 1]. Because of this, the weights were normalized using the min-max normalization, that executes a linear transformation from the original values. The equation used for this objective, given weights w1, w2, …, wn was (Han et al., 2006):
'/: =;;=?@< ;;=><=>< (8)
As a result, in order to be coherent with Equation 7, a renormalization from w1’, w2’, …, wn’
was necessary, but this time in terms of Equation 9 to obtain w1’’, w2’’, ..., wn’’.
'/′′ =∑ ;;<<:<:
B (9)
5. CASE STUDY
5.1. Variable selec7on
The variables to be used in the process were mainly based on the selection from Marques (2012), but also on recommendations from national and foreign manuals (AUSTROADS, 2005; CONTRAN, 2007; MUTCD, 2009; DfT, 2012). However, some factors were included and others, eliminated. Such decisions were taken in an attempt of making the elements – that is, the variables – clearer to the experts that were to be questioned.
Some elements concerning road classi ication (general, technical and function) were expressed in terms of the characteristics that de ine these classi ications: terrain, land use and traf ic volume. Therefore, the respondent could analyze, for instance, the technical classi ication of a road segment not through Design Classes (0, I, II, III and IV), according to Brazilian
regulations (DNER, 1999), but with regards to the most important factor that sustains its choice: traf ic volume.
Besides that, design speed were not considered. This happened because most of the times the experts do not have access to the original projects when evaluating speed limits for existing roads.
Thus, 20 variables were delimited and divided in four main categories: General Characteristics (encompassing elements that allow road classi ication, according to DNER, 1999), Roadside Characteristics, Road Characteristics, and Traf ic Characteristics. These variables are listed in Table 6 with their corresponding descriptions.
5.2. Procedure for Ques7oning Experts
After the variables were selected, an online survey was elaborated so that the questionnaire could be spread and answered throughout the country, without the need of sending physical versions of it to different agencies.
In this survey, the factors from Table 6, with their descriptions, were presented individually, in which experts were questioned about the degree of in luence of them in speed limits. To do that, a Likert Scale was used, from 1 to 5, in which 1 would represent very weak in luence and 5, very strong in luence.
Table 6 – Variables selected for questioning experts
Characteris7cs Variable Descrip7on
General Characteris cs
Land Use Urban or Rural.
Terrain Level, Rolling, or Mountainous.
Traffic Volume Average annual daily traffic, considering usual traffic for Brazilian highways.
Roadside Characteris cs
Quan ty of Roadside Elements Distance from construc ons, bus stops, and isolated elements (trees, light poles, columns, etc.) not protected by devices such as guardrails. Characteris c of Roadside Condi on Residen al, Industrial, Commercial, Agricultural, etc., and intensity of
occupa on.
Road
Characteris cs
Horizontal Alignment
Quan ty of curves and characteris cs of horizontal alignment (radius and spirals, for instance). Also, road sinuosity in terms of a big number of curves.
Ver cal Alignment Grades’ lengths and slopes, number of ver cal curves, and other elements of design, such as length of curves. Also, sight distance. Cross Sec on Number of lanes, lanes’ width, shoulder (presence and width), gu$er,
curbs, and slopes.
Presence of Intersec ons Average number per kilometer (density) and type of intersec on (roundabout, for instance).
Presence of U-Turns Average number per kilometer (density) and characteris cs, such as presence of accelera on lane.
Presence of Accesses Average number per kilometer (density) and accesses to parking facili es or roadside construc ons, such as gas sta ons and restaurants. Presence of Condi ons for
Pedestrians and Cyclists
Existence of crosswalks, footbridges, or cycle paths.
Presence of Traffic Flow Separa on Devices
Existence and type of traffic flow separa ng device (concrete barriers, median, guardrails) placed longitudinally. Also, these devices to protect elements on the roadside (trees, light poles, columns, etc.).
Pavement Type of pavement and level of conserva on.
Signaling Type of exis ng or missing signaling, but also the level of conserva on. Bridges and Viaducts Existence of bridges and viaducts.
Traffic Characteris cs
Presence and Volume of Pedestrians and Cyclists
Average daily traffic of pedestrians and cyclists.
Traffic Composi on Percentage of heavy vehicles.
Opera onal Speed V85, for example.
Subsequently to answering the same question to 20 variables, the respondent would analyze his/her degree of agreement to a control question: “The de inition of factors that in luence speed limits is an important process for decision-making.” To this question speci ically, the Likert Scale’s limits were changed. At this moment, 1 meant strong disagreement and 5, strong agreement. This control question is of great importance to the mathematical model used to obtain the weights and, thus, ordering the variables.
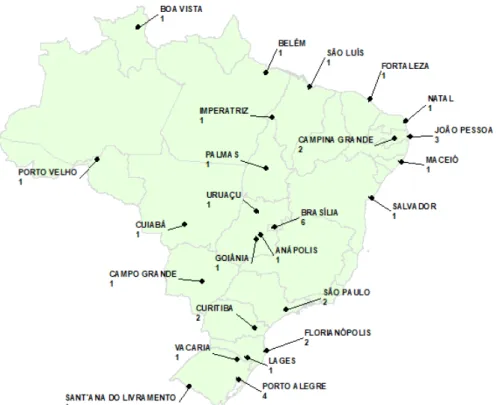
The sample consisted of 39 people, that belonged to Brazil’s ive regions. The questionnaire was sent to experts that worked with speed limits in federal and state agencies, DNIT’s regional superintendents and researchers that had already studied speed on highways. The map from Figure 4 presents the experts’ locations, indicating the quantity of respondents in each city as well.
Figure 4. Location and Quantity of Respondents
6. RESULTS AND DISCUSSIONS
With the numeric values from the experts’ answers (Likert Scale from 1 to 5), the Cronbach’s Alpha, a reliability coef icient to access a questionnaire’s internal consistence in terms of the items’ homogeneity on a scale, was computed. Such coef icient can be de ined, statistically, as the proportion of a scale’s total variance that is attributed to a common source, presumedly the corresponding to the true score of a latent variable (Devellis, 2017).
A Cronbach’s Alpha of 0.87 was obtained, suggesting that, according to George and Mallery (2003), the questionnaire had a good consistence.
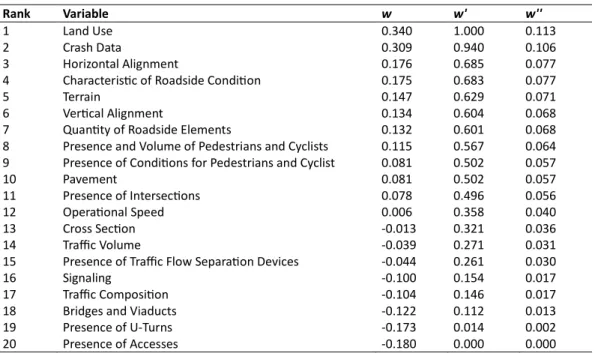
The procedure for obtaining weights was performed with MATLAB and the results for w, w’ and w’’ are presented in Table 7.
Table 7 – Weights for the Factors that Influence Speed Limits in Highways
Rank Variable w w' w''
1 Land Use 0.340 1.000 0.113
2 Crash Data 0.309 0.940 0.106
3 Horizontal Alignment 0.176 0.685 0.077
4 Characteris c of Roadside Condi on 0.175 0.683 0.077
5 Terrain 0.147 0.629 0.071
6 Ver cal Alignment 0.134 0.604 0.068
7 Quan ty of Roadside Elements 0.132 0.601 0.068
8 Presence and Volume of Pedestrians and Cyclists 0.115 0.567 0.064 9 Presence of Condi ons for Pedestrians and Cyclist 0.081 0.502 0.057
10 Pavement 0.081 0.502 0.057
11 Presence of Intersec ons 0.078 0.496 0.056
12 Opera onal Speed 0.006 0.358 0.040
13 Cross Sec on -0.013 0.321 0.036
14 Traffic Volume -0.039 0.271 0.031
15 Presence of Traffic Flow Separa on Devices -0.044 0.261 0.030
16 Signaling -0.100 0.154 0.017
17 Traffic Composi on -0.104 0.146 0.017
18 Bridges and Viaducts -0.122 0.112 0.013
19 Presence of U-Turns -0.173 0.014 0.002
20 Presence of Accesses -0.180 0.000 0.000
It can be observed that, among the most relevant variables, land use (urban or rural) and characteristic of roadside condition (residential, industrial, commercial, agricultural, etc., and intensity of occupation) were included, which indicates that the fact of the highway being inserted in a rural or urban area, and also if it has houses or schools surrounding it, for instance, exerts a meaningful in luence when de ining a speed limit, as it was expected. Besides that, crash data was considered as a high relevance factor, since crashes have a strong relationship with speed and, consequently, with speed limits.
Concerning terrain and traf ic volume, the most important parameters when technically classifying a road, it was seen that only the terrain was highlighted. Both volume and traf ic composition did not end up as relevant, according to experts.
Geometry elements – horizontal and vertical alignments – were pointed as important, despite cross section characteristics, such as shoulder, number of lanes, slopes, and traf ic low separation devices having presented inferior classi ication. Also, operational speed (V85), extensively employed throughout the world as one of the most important factors, was not considered by experts as a variable of vital importance when establishing a speed limit in Brazil. In terms of U-Turns, accesses, intersections, bridges, and viaducts, only the intersections have had some relevance. Such statement is coherent, because they represent the possibility of traf ic con licts, inducing a speed reduction when compared to a segment of continuous low. Accesses and U-Turns, when designed with acceleration and deceleration lanes, should not interfere in speed limits. The same conclusion applies to bridges and viaducts, that need a proper geometric design around them.
It was expected that the presence of pedestrians and cyclists be better ranked, but this can be explained to be possibly included in the factor “Characteristics of Roadside Occupation”. Residential occupation, for example, means the existence of pedestrian traf ic.
Besides that, elements such as signaling – both horizontal and vertical, since a distinction was not mentioned in the questionnaire – and pavements did not stand out as relevant for settling speed limits.
7. CONCLUSIONS
In any problem that involves a big number of variables, it is very important to rank them so that the most important ones can be selected. This applies to de ining speed limits, since 20 variables were initially proposed.
Among the possible methods to rank variables, a fuzzy multicriteria decision-making method, adapted from Hu (2009), was used with the aid of a genetic algorithm, since it referred to a complex optimization problem that had many uncertainties, including the Likert Scale itself. The results, after using the method, have converged to what was expected, based on the literature review.
However, the V85 did not present a signi icant relevance, as stated by many public agencies. Possibly, such situation occurred because most of the experts have no access to this kind of data in Brazil and may not use it when de ining a speed limit.
When comparing to the results presented by Marques (2012), as in Table 1, horizontal alignment, terrain (in terms of technical classi ication), land use (in terms of general classi ication), characteristic of roadside occupation, quantity of roadside elements, and crash data were considered of high relevance by the author, and similar results were obtained in
this study.
One of the limitations of this study was not considering correlation between variables. As stated before, it was supposed that “Presence of Pedestrians and Cyclists” was not well ranked due to its possible inclusion in “Characteristics of Roadside Occupation”. Considering correlation into the analysis might lead to different weights from the ones obtained, since their effects may be combined.
Therefore, future studies are possible using other techniques. Both Factorial and Principal Component Analyses can be conducted to simplify the variables and evaluate if 20, for instance, is too much to characterize the settlement of speed limits.
Also, variable ranking can be used to select the most important ones so that, for example, an expert system to settle speed limits can be developed, since it would be very dif icult to work with 20 variables. Many variables in luence it, but some of them may not be as important as others. Therefore, using an excessive quantity of variables in a system could result in a very complex model, which highlights the importance of the ranking process.
Such possible system can also use fuzzy logic as the main technique, since many of the variables listed as the most important ones have no clear de inition between them. It is dif icult to establish if a highway is totally inserted in a rural or urban environment, for instance, and, due to the uncertainty associated to it, membership functions may appropriately deal with classifying a road in this way. Similar circumstances can be seen at other variables, such as if a terrain is level, rolling, or mountainous. Therefore, a fuzzy control system is a good way of studying the association between these factors and the speed limit itself.
Besides that, it is important to state that these results correspond only to opinions of Brazilian experts, so they are focused on highway conditions for this country. Similar studies may be conducted in other countries to test if factors signi icantly change. Not only that, but Brazil has ive regions that are very distinct from each other, and this may indicate a possible future study to investigate how differently an expert from the South can settle a speed limit when compared to one from the North.
Furthermore, this methodology can be employed not only in several transportation areas, such as investigating elements that may in luence the choice of a speci ic mode or when looking into the most important aspects for a road safety audit, but in other ields as well. The Likert Scale is widely used and the fuzzy multicriteria decision making, as presented in this study, properly deals with the uncertainty inherent to it, since it has converged to satisfactory results. Also, other areas, such as economics, business, and medicine, may use this technique to rank the most relevant elements in an analysis.
REFERENCES
Arslan, A. and M. Kaya (2001) Determination of fuzzy logic membership functions using genetic algorithms. Fuzzy Sets and Systems, v. 118, p. 297-306. DOI: https://doi.org/10.1016/S0165-0114(99)00065-2
AUSTROADS (2005) Balance between Harm Reduction and Mobility in Setting Speed Limits: A Feasibility Study. Research Report AP-R272/05. Sydney, Australia. 67p.
Brasil (2016) Lei Nº 13.281, de 4 de maio de 2016. Altera a Lei nº 9.503, de 23 de setembro de 1997 (Código de Trânsito Brasileiro), e a Lei nº 13,146, de 6 de julho de 2015. Retrieved from: http://www.planalto.gov.br/ccivil_03/_ato2015-2018/2016/lei/l13281.htm. Last access: 11/04/2018.
Bauchspiess, A. (2008) Introdução aos Sistemas Inteligentes. Apostila da disciplina Introdução ao Controle Inteligente Numérico. Departamento de Engenharia Elétrica, Universidade de Brası́lia, 78p. Avaliable in:
http://www.ene.unb.br/adolfo/Lectures/ ICIN/isi.pdf. Last access: 20/06/2018.
Carlsson, C. and R. Fullér (1996) Fuzzy multiple criteria decision making: Recent developments. Fuzzy Sets and Systems, v. 78, p. 139-153. DOI: https://doi.org/10.1016/0165-0114(95)00165-4
CONTRAN (2007) Conselho Nacional de Trânsito. Manual Brasileiro de Sinalização de Trânsito. Sinalização Vertical de Regulamentação – Volume 1. 2ª Edição.
Correia, G. H. A. and A. B. Silva (2011) Setting Speed Limits on Rural Two-Lane Highways by Modeling the Relationship between Expert Judgment and Measurable Roadside Characteristics. Journal of Transpor-tation Engineering, v. 137, nº 3, p. 184-192. DOI: https://doi.org/10.1061/(ASCE)TE.1943-5436.0000210
DfT (2012) Departament of Transportation. Setting local speed limits. DfT Circular 01/2013. London, United Kingdom. 42p. Devellis, R. F. (2017) Scale Development: Theory and Applications. SAGE, Thousand Oaks, CA, 306p.
DNER (1999) Departamento Nacional de Estradas de Rodagem. Manual de Projeto Geométrico de Rodovias Rurais. Publicação 706. 195 p.
Fitzpatrick, K.; P. Carlson; M. A. Brewer; M. D. Wooldridge; and S. Miaou (2003) Design Speed, Operating Speed, and Posted Speed Practices. Transportation Research Board. National Cooperative Highway Re-search Program. Report 504. Washington, D.C., United States.
George, L. E. and P. Mallery (2003) SPSS for Windows step by step: A simple guide and reference. Allyn and Bacon, Boston, MA, 386 p.
Gonçalves, F. (2016) Algoritmos Genéticos. Apostila – Faculdade de Engenharia Elétrica e Computação, Uni-camp, 20p. Retrieved from: https://andreric.github.io/posts/2018/05/blog-post-2/. Last access: 07/07/2019.
Gregório, N.; A. B. Silva; and A. Seco (2016) Speed management in rural two-way roads: speed limit de inition through expert-based system. Transportation Research Procedia, v. 13, p. 166-175. DOI: https://doi.org/10.1016/j.trpro.2016.05.017 Han, J.; J. Pei; and M. Kamber (2006) Data Mining. Pearson, Elsevier, San Francisco, CA 800 p.
Hu, Y. (2009) Fuzzy multiple-criteria decision making in the determination of critical criteria for assessing ser-vice quality of travel websites. Expert Systems with Applications, v. 36, p. 6439-6445. DOI: https://doi.org/10.1016/j.eswa.2008.07.046 Hu, J. W.; Y. Hu; and H. Bein (2011) Constructing a Corporate Social Responsibility Fund Using Fuzzy Multiple Criteria Decision
Making. International Journal of Fuzzy Systems, v. 13, p. 195-205. DOI: 10.30000/IJFS.201109.0005
Mardani, A.; A. Jusoh; and E. K. Zavadskas (2015) Fuzzy multiple criteria decision-making techniques and applications – Two decades review from 1994 to 2014. Expert Systems with Applications, v. 42, p. 4126-4148. DOI:
https://doi.org/10.1016/j.eswa.2015.01.003
Marques, E. C. S. (2012) Fatores a Serem Considerados para a De inição de Velocidade Limite em Rodovias Brasileiras. Dissertação de Mestrado em Transportes, Publicação T. DM – 006 A/2012. Departamento de Engenharia Civil e Ambiental, Universidade de Brası́lia, 126p.
Mathworks (2018) Available in: https://www.mathworks.com/?s_tid=gn_logo. Last access: 30/11/2018. Mitchell, M. (1998) An Introduction to Genetic Algorithms. The MIT Press, Boston, MA, 162 p.
MUTCD (2009) Manual on Uniform Traf ic Control Devices for Streets and Highways. 2009 Edition. Washing-ton, D.C., United States.
Pecheva, A.; K. Atanassov; and A. Shannon (2009) Modelling of a Stochastic Universal Sampling Selection Operator in Genetic Algorithms. Tenth International Workshop on Generalized Nets, So ia, v.1, p. 1-7.
Zadeh, L. A. (1965) Fuzzy Sets. Information and Control, v.8, p. 338-353. DOI: https://doi.org/10.1016/S0019-9958(65)90241-X
Zadeh, L. A. (1973) Outline of a New Approach to the Analysis of Complex Systems and Decision Processes. IIEE Transactions on Systems, Man, And Cybernetics, v. SMC-3, nº 1. DOI: 10.1109/TSMC.1973.5408575