www.atmos-chem-phys.net/15/1367/2015/ doi:10.5194/acp-15-1367-2015
© Author(s) 2015. CC Attribution 3.0 License.
Size-resolved observations of refractory black carbon particles in
cloud droplets at a marine boundary layer site
J. C. Schroder1, S. J. Hanna1, R. L. Modini2, A. L. Corrigan2, S. M. Kreidenwies6, A. M. Macdonald3, K. J. Noone5, L. M. Russell2, W. R. Leaitch4, and A. K. Bertram1
1Department of Chemistry, University of British Columbia, Vancouver, BC, V6T 1Z1, Canada
2Scripps Institute of Oceanography, University of California-San Diego, La Jolla, San Diego, CA, USA 3Air Quality Processes Research Section, Environment Canada, Toronto, ON, Canada
4Climate Chemistry and Measurements Research, Environment Canada, Toronto, ON, Canada 5Department of Applied Environmental Science, Stockholm University, Stockholm, Sweden 6Department of Atmospheric Science, Colorado State University, Fort Collins, CO, USA Correspondence to:A. Bertram ([email protected])
Received: 4 April 2014 – Published in Atmos. Chem. Phys. Discuss.: 7 May 2014 Revised: 27 November 2014 – Accepted: 3 January 2015 – Published: 9 February 2015
Abstract.Size-resolved observations of aerosol particles and cloud droplet residuals were studied at a marine boundary layer site (251 m a.m.s.l.) in La Jolla, San Diego, California, during 2012. A counterflow virtual impactor (CVI) was used as the inlet to sample cloud residuals while a total inlet was used to sample both cloud residuals and interstitial particles. Two cloud events totaling 10 h of in-cloud sampling were an-alyzed. Based on bulk aerosol particle concentrations, mass concentrations of refractory black carbon (rBC), and back trajectories, the two air masses sampled were classified as polluted marine air. Since the fraction of cloud droplets sam-pled by the CVI was less than 100 %, the measured activated fractions of rBC should be considered as lower limits to the total fraction of rBC activated during the two cloud events. Size distributions of rBC and a coating analysis showed that sub-100 nm rBC cores with relatively thick coatings were in-corporated into the cloud droplets (i.e., 95 nm rBC cores with median coating thicknesses of at least 65 nm were incorpo-rated into the cloud droplets). Measurements also show that the coating volume fraction of rBC cores is relatively large for sub-100 nm rBC cores. For example, the median coat-ing volume fraction of 95 nm rBC cores incorporated into cloud droplets was at least 0.9, a result that is consistent with
κ-Köhler theory. Measurements of the total diameter of the rBC-containing particles (rBC core and coating) suggest that the total diameter of rBC-containing particles needed to be at least 165 nm to be incorporated into cloud droplets when
the core rBC diameter is ≥85 nm. This result is consistent with previous work that has shown that particle diameter is important for activation of non-rBC particles. The activated fractions of rBC determined from the measurements ranged from 0.01 to 0.1 for core rBC diameters ranging from 70 to 220 nm. This type of data is useful for constraining models used for predicting rBC concentrations in the atmosphere.
1 Introduction
highly uncertain, with an uncertainty of approximately 90 % (Bond et al., 2013). The uncertainty in the indirect effect ra-diative forcing estimate is partially due to an uncertainty in BC–cloud interactions (Bond et al., 2013). To better under-stand the direct and indirect effects of BC on climate, a better understanding of the activation of BC into cloud droplets is needed.
Despite the importance of activation of BC particles into cloud droplets, there have only been a small number of stud-ies that have investigated the activation of BC particles into cloud droplets under real atmospheric conditions (see Table 1 in Cozic et al., 2007, as well as Pratt et al., 2010, and Granat et al., 2010). Of these studies, most have been carried out at mid- to high-altitude mountain sites (Cozic et al., 2007; Hitzenberger et al., 2000, 2001; Kasper-Giebl et al., 2000; Sellegri et al., 2003). Only a few studies have investigated the activation of BC particles at marine or coastal sites (Gieray et al., 1997; Granat et al., 2010). In addition, almost all of the previous studies have focused on the fraction of total BC mass activated into cloud droplets. For example, Hallberg et al. (1992) measured the mass scavenging of BC into fog droplets at a polluted site in the Po Valley (Italy). They found that the mass fraction of scavenged BC (0.06) was statisti-cally smaller than the scavenged fraction of sulfate (0.18). Similar results were obtained when sampling stratocumulus clouds at a mountaintop site at Kleiner Feldberg, Germany. There, a statistically significant difference in scavenging was also observed; the scavenged fraction of sulfate at this site was 0.52 while the scavenged fraction of BC was 0.15 (Hall-berg et al., 1994). In this latter case, observations showed that BC particles found as cloud droplet residuals were of mixed composition, often having a water-soluble component that varied as a function of size. These studies reporting mass scavenging of BC can be useful for validating models. How-ever, since the CCN properties of refractory black carbon (rBC)-containing particles are more closely linked to number and particle size, the studies that focus on BC mass scaveng-ing are unable to determine the relative contribution of parti-cle size and composition to the activation of BC into clouds. Recent studies have compared concentrations of BC parti-cles measured over the central Pacific from 85◦N to 67◦S during the HIAPER (High-Performance Instrumented Air-borne Platform for Environmental Research) Pole-to-Pole Observations (HIPPO) campaign, with predictions using a global chemical transport model (Wang et al., 2014). The authors concluded that most models may not be accurately simulating the scavenging of BC particles into cloud droplets (Wang et al., 2014). To help better constrain these models, additional studies on the activation of BC into cloud droplets under real atmospheric conditions and at different locations and times would be helpful.
The single particle soot photometer (SP2) is an instrument recently developed to determine the refractory black carbon (rBC) mass of individual particles (Moteki and Kondo, 2007; Schwarz et al., 2006; Stephens et al., 2003). With this
instru-ment, size distributions of rBC can be obtained in real time. In addition, this instrument provides information on coat-ing thicknesses of the rBC-containcoat-ing particles. The SP2 has now been used extensively to determine the size distribution and coating thicknesses of rBC particles in the atmosphere. Here, we apply this technique to investigate the activation of rBC particles in stratocumulus clouds at a marine boundary layer site. Specific questions to be addressed include the fol-lowing: (1) what is the activated fraction of rBC as a function of particle size in the marine stratocumulus clouds studied? (2) Do small (sub-100 nm) rBC cores get incorporated into the cloud droplets? (3) What is the thickness of the coating on the rBC cores that are incorporated into the cloud droplets? (4) Is the rBC coating volume fraction and the total diameter (rBC core and coating thickness) important for activation of rBC into cloud droplets? (5) Are the results consistent with
κ-Köhler theory, which is used in advanced modeling studies to describe the activation of rBC particles into cloud droplets (e.g., Fierce et al., 2013; Riemer et al., 2010)?
2 Site, sampling and analysis 2.1 Site description
The sampling site was located below the peak of Mt. Soledad (251 m a.m.s.l.) which is∼2 km from the coast of the Pacific Ocean in La Jolla, CA (32.8400◦N, 117.2769◦W) and has mostly light commercial and residential activities in the area. The cloud periods occurred primarily at night when these ac-tivities are at a minimum. The city of La Jolla is predomi-nately residential with a population of approximately 43 000 people and is situated 24 km north of San Diego (population 1.3 million), the closest urban center (Zhao et al., 2014).
Data was collected from 27 May to 18 June 2012 using instruments housed in a modified shipping container. A to-tal of three stratocumulus cloud events were sampled dur-ing this time frame. The first cloud event was excluded from this analysis due to an instrumental error. The second cloud event occurred from 12 June 2012, 20:43 to 13 June 2012, 11:35 PDT, and is hereinafter called Cloud 2. The third cloud event took place from 17 June 2012, 20:36 to 18 June 2012, 07:52 PDT, and is called Cloud 3 for the remainder of the document.
2.2 Inlets
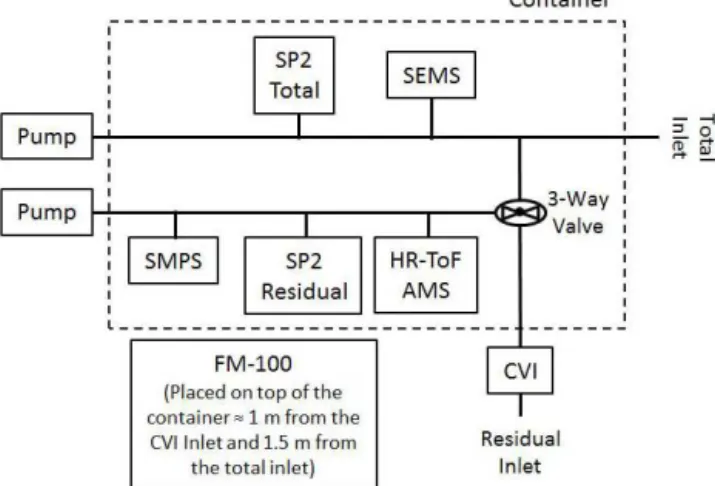
Figure 1. Schematic showing the configuration of the inlets and instrumentation housed in the shipping container.
sampling line (0.25 in. stainless steel tubing). A pump was placed at the end of this sampling line creating a bypass flow of∼2 Lpm.
The intake of the residual inlet was a counterflow virtual impactor (CVI, see Sect. 2.3 and Sect. S1 in the Supple-ment) that enabled the sampling of cloud droplets without contamination from interstitial particles, or ambient gases, thus only the residual particles of the cloud droplets were sampled. This inlet was used only during cloudy periods and was connected to a branch of the total inlet by a three-way valve (Fig. 1). During a cloud event, the valve was manu-ally switched so that cloud droplets were sampled through the CVI and cloud residuals were measured by instrumenta-tion connected downstream of the valve. At times when no clouds were present the valve was switched such that all in-struments were sampling ambient particles. All inin-struments downstream of the three-way valve were sequentially con-nected to a common sampling line (0.25 in. stainless steel tubing). A pump was also placed at the end of the sampling line creating a bypass flow of∼2 Lpm.
Since much of the analysis used in this paper is based on a measured ratio of particle number concentrations it was nec-essary to ensure that there were no significant losses of parti-cles due to the inlet configurations. Therefore, particle losses from diffusion, sedimentation, turbulent inertial deposition and inertial deposition from both bends and contractions for the total and residual inlets (assuming cloud-free sampling) were calculated using the Particle Loss Calculator (Von der Weiden et al., 2009) and found to be < 2 % for particles with diameters between 0.07 and 1 µm, covering the size range used for this analysis.
2.3 Counterflow virtual impactor sampling
The CVI was based on the design of Noone et al. (1988), where droplet-laden air was drawn into the CVI using a high velocity air intake vacuum (≈92 m s−1). Only those droplets
with enough inertia to overcome a counterflow of zero air with an average flow rate of≈5 Lpm made it past the region known as the stagnation plane and were entrained into the sample flow and transported to the instruments downstream. Water from these droplets began evaporating upon impact with the warm dry counterflow air, held at a constant temper-ature of 40◦C, and particles were further dried by a heated section of the sampling tube, also at 40◦C, leaving only the droplet residuals to be sampled downstream. If the droplets were completely evaporated, any volatile gases in the cloud droplets, such as nitric acid, likely evaporated and were not part of the residual particles (Zhao et al., 2014). If some wa-ter was retained by the residual particles at this temperature, a fraction of highly soluble volatile components may have also remained.
The smallest droplet diameter for which 50 % of the droplets are sampled is considered to be the CVI cut-size (CVI-D50) and is the diameter for which a droplet’s stopping
distance is greater than the CVI inlet diameter and the length to the end of the stagnation plane (Anderson et al., 1993; Noone et al., 1988). For the clouds sampled in this study, a CVI-D50of 11.5±0.7 µm and 11.6±0.7 µm for Cloud 2 and
Cloud 3, respectively, were calculated (Sect. S1).
Due to the properties of a CVI, particle concentrations are enhanced at the exit of the CVI compared to ambient condi-tions. Enhancement factors (EF) of 7.1 and 7.4 for Cloud 2 and Cloud 3, respectively, were calculated based on the flow rates used during sampling (Sect. S1).
2.4 Black carbon measurements
Refractory black carbon (rBC) was measured from the total inlet and the residual inlet using two separate single particle soot photometers (SP2, DMT, Boulder, CO). These instru-ments are referred to as the total SP2 (SP2Tot) and the
resid-ual SP2 (SP2Res). The location of these instruments is shown
in Fig. 1. The SP2 has been described in detail elsewhere (Moteki and Kondo, 2007; Schwarz et al., 2006; Stephens et al., 2003). Briefly, particles are sampled at ≈0.12 Lpm and carried directly into a chamber housing a high inten-sity (≈1 MW cm−2) intra-cavity Nd : YAG laser operating at
The calibration parameters used to determine mass were taken from a linear fit of the combined pre and post-campaign data. The uncertainty in the rBC mass (at the 95 % confidence limit) stemming from uncertainty in the fit of the calibra-tion was 1–16 % for SP2Res(depending on particle mass) and
3–25 % for SP2Tot (depending on particle mass). A volume
equivalent diameter was also determined from the measured mass assuming a black carbon density of 1.8 g cm−3 (Bond and Bergstrom, 2006). The SP2Reswas a four-channel
instru-ment with a detection range of approximately 70 to 220 nm, whereas the SP2Totwas an eight-channel instrument with a
detection range of 70 to 558 nm.
It is well known that the detection efficiency of an SP2 decreases when the diameter of rBC cores becomes small (i.e., <∼70–90 nm; Laborde et al., 2012; Schwarz et al., 2010). Since the main conclusions about black carbon in this manuscript are based on relative measurements taken with two SP2s (i.e., the residual SP2 and the total SP2) the detec-tion sensitivities of the two instruments as a funcdetec-tion of size need to be similar. To ensure that this was the case, we car-ried out the following test: we measured the rBC size distri-butions with both SP2s from side-by-side ambient sampling of room air during the post-campaign calibration. Since the two instruments gave slightly different results, we applied a size-dependent correction factor to the SP2 connected to the total inlet to bring the two results in agreement. Shown in Fig. S1 are rBC size distributions measured during cloud-free sampling conditions before the corrections were applied, the size-dependent correction factor applied to the total SP2, and the rBC size distributions measured during cloud-free sampling after the correction factors were applied. After ap-plying the correction factors to the total SP2, the two SP2s agreed to within 6 % for the total number concentration of rBC particles having diameters between 70 and 220 nm. 2.5 Refractory black carbon coating thickness
measurements
In addition to measuring the incandescence signal, the SP2 measures the elastically scattered light from rBC and non-rBC-containing particles with two avalanche photodiodes (APDs). Both APDs were set to the high gain setting for col-lection, and one of the APDs was a split detector. The APDs generate a time dependent signal as particles pass through the Gaussian laser beam. The split detector APD can be used to obtain position information, whereas the APD without the split detector is used to obtain information on the elastic scat-tering intensity from particles (Gao et al., 2007). The infor-mation from the two APDs combined can be used to deter-mine the coating thickness on rBC cores as described by Gao et al. (2007). However, in the study presented here, a large fraction of rBC particles evaporated before the notch posi-tion in the split detector, due to poor alignment of the split detector. As a result, position information could not be ob-tained reliably for a large fraction of the rBC particles. A
similar observation has previously been reported (Taylor et al., 2014). Since position information could not be deter-mined reliably for a large fraction of rBC particles, coat-ing thicknesses were not determined uscoat-ing the approach de-scribed by Gao et al. (2007). Instead, we used the maximum intensity in the elastic scattering signal from the non-split APD detector to determine lower limits to the coating thick-ness on the rBC particles. A similar approach has been previ-ously used (Subramanian et al., 2010). This coating analysis was only performed on the data from the residual SP2. In other words, we only extracted coating information for rBC-containing particles sampled from the residual inlet. When rBC-containing particles intersect with the laser beam the particles are heated, and any coating material will evaporate. As a result, the maximum elastic scattering signal measured with the non-split APD detector may not represent the orig-inal size of the coated rBC particle. Because of the evapora-tion process, the maximum intensity from the non-split APD detector only provides a lower limit to the coating thick-nesses of rBC-containing particles (Gao et al., 2007; Sub-ramanian et al., 2010).
The signal from the non-split detector was calibrated using polystyrene latex (PSL) beads (200 and 300 nm in diameter). This gives a calibration curve that relates the amplitude of the measured scattering signal to the scattering intensity de-termined from Mie calculations. These Mie calculations in-volved calculating the scattering intensity for each PSL size over the solid angle of the SP2 detector (a full-angle cone of 65◦at 45◦and 135◦from the laser axis (Gao et al., 2007; Schwarz et al., 2008b) using a Mie code (Leinonen) based on that of Mätzler (2002a, b). The refractive index used for the PSL Mie calculations was 1.59–0.0i.
Since the mass of the rBC core is known from the in-candescence signal and the scattering amplitude is known from the non-split APD detector, a core–shell Mie model can be employed to determine what coating thickness would give the measured scattering signal for that particular parti-cle (Gao et al., 2007; Schwarz et al., 2008b). In this work a core–shell Mie model was used to construct a lookup ta-ble for core diameters of 60 to 220 nm (in 1 nm increments) and shell thicknesses from 0 to 360 nm (in 1 nm increments). The complex index of refraction used for the core was 2.26– 1.26i (Moteki et al., 2010; Taylor et al., 2014) and for the shell, 1.5–0.0i, which is consistent with that of dry sulfate or sodium chloride (Metcalf et al., 2012; Schwarz et al., 2008a, b). The PSL calibration was used to scale all calculated val-ues to measured valval-ues. The elastic scattering amplitudes and the rBC core diameters were then used with this lookup ta-ble to determine the lower limits to the coating thicknesses for each rBC-containing particle. It should be noted that the coating thicknesses have not been validated experimentally, but merely provide consistency between the observed optical scattering and Mie theory.
elas-tic scattering opelas-tical detection limit means that scattering from bare rBC cores below∼110 nm cannot be measured. As particle size decreases below 110 nm, thicker and thicker coatings are required to produce a measurable scattering sig-nal. In this analysis any particle with no measurable scat-tering signal was assumed to have a coating thickness of 0 (i.e., they were assumed to be bare rBC cores), even though they may actually have had a thin coating. This also leads to a lower limit for coating thicknesses for particle sizes be-low ∼110 nm. The fraction of particles with no detectable scattering was 33 % for Cloud 2 and 17 % for Cloud 3.
For large rBC cores, the optical detector became saturated when even relatively modest coatings were present. For ex-ample, the scattering from a 220 nm rBC core with a coat-ing thickness of 40 nm would saturate the SP2 optical detec-tor. In this analysis, the coatings for particles with saturated scattering signals were calculated using the saturation limit of the detector, again resulting in a lower limit for coating thickness. The fraction of particles with saturated scattering signals was 6 % for Cloud 2 and 4 % for Cloud 3.
In summary, due to the optical detection limits of the non-split detector and due to evaporation of the coatings in the laser beam, the coating thicknesses determined in this work, are lower limits to the true coating thicknesses.
2.6 Size distribution measurements of the bulk aerosol Two instruments were used to measure size distributions of the bulk aerosol (see Fig. 1). Size distributions of the bulk aerosol sampled from the total inlet were determined with a scanning electrical mobility spectrometer (SEMS, model 2002, BMI, Hayward, CA) coupled to a condensation par-ticle counter (CPC, model 3781, TSI, St. Paul, MN), which counted particles into 61 discrete size bins from 0.01 to 1 µm with a 5 min scan time interval. Size distributions of bulk aerosol, sampled from the residual inlet, were determined with a scanning mobility particle sizer (SMPS, model 3034, TSI, St. Paul, MN), which recorded particle counts into 55 size bins from 10 to 487 nm with a 3 min scan time interval. Both the SEMS and SMPS operate based on the coupling of a size-selecting differential mobility analyzer and a conden-sational growth particle counter. During cloud-free sampling periods, the total number concentration of particles between 70 and 400 nm measured with the SMPS and SEMS agreed to within 4 %.
2.7 Aerosol mass spectrometry
To characterize the chemical composition of the cloud droplet residuals an online aerosol mass spectrometer (HR-ToF-AMS, Aerodyne Research Inc., Billerica, MA) was op-erated downstream of the CVI on the residual inlet. The HR-ToF-AMS measures non-refractory, sub-micrometer aerosol chemical composition at high time resolution (DeCarlo et al., 2006). Here we only consider data measured by the
HR-ToF-AMS in its mass-spectrum and V modes of opera-tion. These data were recorded as 2 min averages every 4– 6 min, depending on how many other modes of operation (W-mode, light scattering) the instrument was alternating be-tween. Size-resolved composition data for the residual parti-cles measured by the HR-ToF-AMS in time-of-flight mode are not considered here since the signal was generally at or below the detection limit. Standard quantification procedures (Allan et al., 2004) were applied to the mass spectra mea-sured by the HR-ToF-AMS to determine the relative concen-trations of the non-refractory species (organic, nitrate, sul-fate, ammonium and chloride) typically reported by aerosol mass spectrometry.
2.8 Back trajectories
Air mass back trajectories were calculated using the NOAA Hybrid Single Particle Lagrangian Integrated Trajectory Model (HYSPLIT; Draxler and Rolph, 2013; Rolph, 2013). All trajectory calculations used the National Centers for En-vironmental Predictions EDAS meteorological data set. Tra-jectories were calculated starting at 10 m a.g.l., 96 h back-wards in time, and at hourly intervals throughout the entire period of cloud sampling.
2.9 Cloud properties
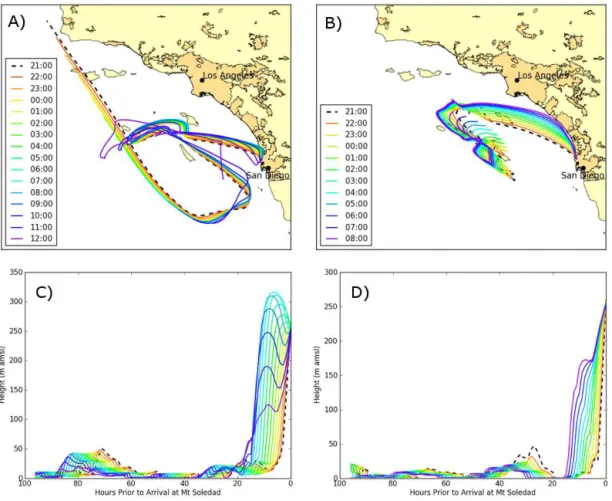
Figure 2.In-cloud HYSPLIT 96 h back trajectories ending at hourly intervals for Cloud 2 (12 June 21:00 to 13 June 12:00 PDT) in(a)and
(c), and Cloud 3 (17 June 21:00 to 18 June 08:00 PDT) in(b)and(d). All back trajectories started at 10 m a.g.l. Darker yellow regions on land in panels(a)and(b)indicate densely developed urban areas containing 50 000 or more people (United States Census Bureau). Panels
(c)and(d)show the vertical profiles over the same hourly intervals shown in(a)and(b).
3 Results and discussion 3.1 Back trajectories
The back trajectories for Cloud 2 (Fig. 2a, c) show that the air mass spent most of the previous 96 h over the Pacific Ocean and arrived at the sampling site from a northwesterly direc-tion. During the first part of Cloud 2 (from 12 June 21:00 to 13 June 08:00 PDT), the back trajectories became progres-sively more northerly and the air mass began traveling to-wards large populated urban regions. Toto-wards the end of the cloud event (at≈09:00 PDT on 13 June) the winds shifted to southwesterly. Based on the back trajectories, the air mass for Cloud 2 traveled≈40–50 km over land before reaching the sampling site. In addition, the air mass spent a significant amount of time close to the ocean surface prior to being lifted up to the sampling site (Fig. 2c).
The back trajectories for Cloud 3 (Fig. 2b, d) also show that the air mass spent the majority of the previous 96 h over the Pacific Ocean before arriving at the site. At the start of Cloud 3 (17 June, 21:00 to 22:00 PDT) the air mass arrived
from the northwest. Throughout the remainder of the cloud event (17 June 23:00 to 18 June 08:00 PDT) the air mass con-tinued to shift farther north, and by the end of the cloud event (18 June 08:00 PDT) the air mass was traveling south along the coastline before arriving at the sampling site. The back trajectories indicate that the air mass traveled≈10–20 km over land prior to arriving at the sampling site. Similar to Cloud 2, the air spent a significant amount of time close to the ocean surface prior to being lifted up to the sampling location (Fig. 2d). Since the trajectories during both cloud events are close to the coastline for a period of time, it is likely these air masses contained both marine particles and anthropogenic emissions.
3.2 Meteorological conditions and cloud properties For the purposes of this study, the data were classified as in-cloud and included for analysis if they met the follow-ing criteria: (1) the 5 min averaged CVI counterflow was within±6 % of the mean counterflow (i.e.,±5σ, whereσ
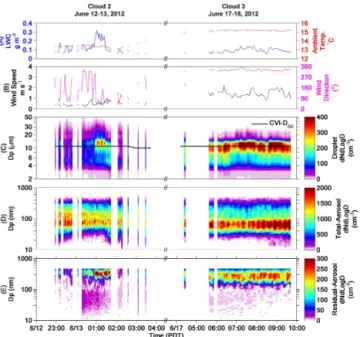
Figure 3.Time series data for both Cloud 2 (left side) and Cloud 3 (right side) showing liquid water content (LWC, blue trace) and ambient temperature (red trace) in (a); wind speed and direction in (b); cloud droplet number size distributions with the CVI-D50
(black trace) overlaid in(c); the number size distribution for the to-tal aerosol in(d), and the residual aerosol in(e). All data shown are 5 min averages and meet the criteria discussed in the text.
flows were included; and (2) the 5 min averaged LWC was greater than 0.05 g m−3to remove periods of entrainment, or “patchy” regions of the cloud as much as possible (Cozic et al., 2007).
The measured cloud properties as a function of time are shown in Fig. 3a–c, where Cloud 2 is shown on the left side and Cloud 3 is shown on the right side of the plot. Cloud 2 was characterized by a median temperature of 13.4◦C, a me-dian wind velocity of 0.5 m s−1 (10th and 90th percentiles of 0.3 and 0.8 m s−1) a median wind direction of 126◦(10th and 90th percentiles of 60 and 297◦), and a median LWC
of 0.10 g m−3. During the middle portion of Cloud 2 (13 June, 01:00 to 02:00 PDT), the droplet distributions clearly show an interval where the number of droplets above the CVI-D50 (black trace overlaid on panel c) increases
signif-icantly, which coincides, in time, with a sharp increase in LWC. Cloud 3 was characterized by a median temperature of 15.2◦C, a median wind velocity of 1.4 m s−1 (10th and 90th percentiles of 1.1 and 2.0 m s−1), a median wind direc-tion of 328◦ (10th and 90th percentiles of 322 and 341◦), and a median LWC of 0.09 g m−3.
The cloud droplet number and volume size distributions, averaged over the entire event, are shown in Fig. 4, and further summarized in Table 1. Cloud 3 had a CDNC of 146 cm−3, a factor of 2 higher than during Cloud 2 (68 cm−3).
Figure 4. Average cloud droplet number size distributions for Cloud 2(a)and Cloud 3(b)measured by the FM-100 (black circles) and fit with a lognormal distribution function (black dashed lines). The average cloud droplet volume distributions (blue squares) and lognormal fits (blue dashed lines) are also shown for each cloud event. The CVI-D50 is indicated on each panel by a red dashed
line.
From the calculated CVI-D50 and the fits to the droplet
size distribution (Fig. 4), the number and volume fraction of droplets sampled by the CVI were determined. The results are summarized in Table 1. During Cloud 2, the number frac-tion of droplets larger than the CVI-D50was about 38 % and
for Cloud 3 the fraction sampled was about 24 %. Since only the larger droplets were sampled by the CVI during these two cloud events, the results presented herein are only represen-tative of the larger droplet population.
3.3 Size distributions
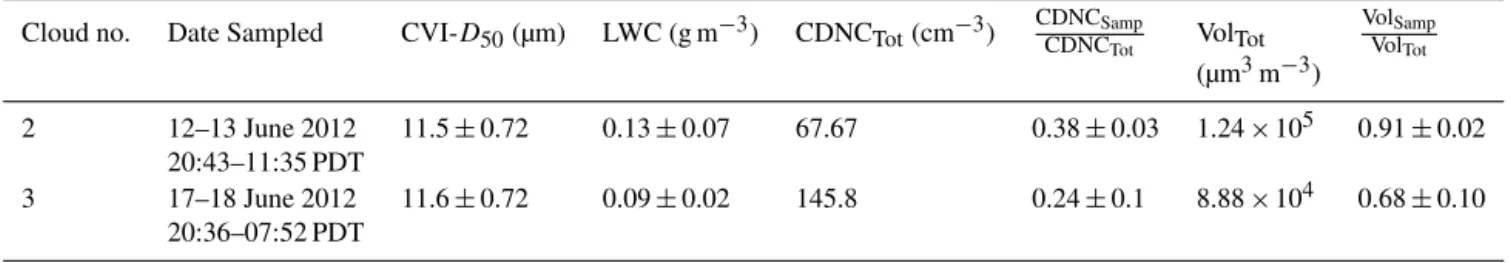
Table 1.Summary of cloud microphysical properties showing the average CVI cut-size (CVI-D50) where the uncertainty stems from the
cal-culated cut-size (see text for details); average liquid water content (LWC) and 1 standard deviation; and the cloud droplet number (CDNCTot)
and volume (VolTot) concentration for droplets with diameters between 2 and 50 µm. Also shown are the number
CDNC Samp CDNCTot
and volume
Vol Samp VolTot
fractions of droplets sampled, where CDNCSampand VolSampare the number and volume concentrations, respectively, for the
fraction of droplets sampled.
Cloud no. Date Sampled CVI-D50(µm) LWC (g m−3) CDNCTot(cm−3) CDNCCDNCSampTot VolTot VolVolSampTot
(µm3m−3)
2 12–13 June 2012 11.5±0.72 0.13±0.07 67.67 0.38±0.03 1.24×10⁵ 0.91±0.02
20:43–11:35 PDT
3 17–18 June 2012 11.6±0.72 0.09±0.02 145.8 0.24±0.1 8.88×10⁴ 0.68±0.10
20:36–07:52 PDT
Table 2.Averaged number (N) and mass (M) concentrations and modal parametersDgandσgfor aerosol and rBC particles during
the two cloud events measured at Mt. Soledad. The subscripts Tot and Res represent measurements made from the total and residual inlets, respectively.
Cloud 2 Cloud 3
Aerosol rBC Aerosol rBC
NTot(cm−3) 980.8 75.24 994.0 62.13
MTot(ng m−3) – 73.41 – 61.83
Dg,Tot(nm) 107.7 < 0.07 80.54 < 0.07
σg,Tot 1.577 – 1.703 –
NRes(cm−3) 43.46 2.000 83.15 3.86
MRes(ng m−3) – 2.741 – 4.735
Dg,Res(nm) 331.9 87.30 269.2 80.72
σg,Res 1.187 1.259 1.281 1.268
3.3.1 Size distributions measured from the total inlet (BulkAeroTotand rBCTot)
The average size distributions of the bulk aerosol measured with the total inlet (referred to as BulkAeroTot for the
re-mainder of the document) and the average size distributions of the refractory black carbon measured with the total inlet (referred to as rBCTot for the remainder of the document)
are shown in Fig. 5. A single mode lognormal distribution function was fit to the BulkAeroTot data, yielding mean
ge-ometric diameters (Dg) of 108 and 81 nm with geometric
standard deviations (σg) of 1.58 and 1.70 for Clouds 2 and
3, respectively. Integration of the number distribution dur-ing Cloud 2 results in a total number concentration (NTot)
for the bulk aerosol of 981 cm−3. Likewise, NTot during
Cloud 3 was measured to be 994 cm−3. Previous measure-ments in the marine boundary layer have classified the en-vironment as “clean” marine if the number of particles is ≤300–500 cm−3and “polluted” marine if the number con-centrations are ≥400–1500 cm−3(Andreae, 2009; Bates et
al., 2000; Glantz and Noone, 2000; Hawkins et al., 2010; O’Dowd et al., 2001; Pirjola and O’Dowd, 2000; Twohy et al., 2005). Thus, the particle concentrations measured at Mt. Soledad, in addition to the back trajectories, suggest that for both clouds the air masses can be classified as polluted marine aerosols. The size distributions of BulkAeroTot as a
function of time are also included in Fig. 3d for comparison. The rBCTotsize distributions for each cloud are shown in
Fig. 5. TheDg for rBCTot (assuming the number
distribu-tions are lognormal) during both events lies somewhere in the nucleation mode at < 70 nm, which is outside the detec-tion range for the SP2. Integradetec-tion of the rBCTotdistributions,
from 70 to 220 nm, yields anNTotof 75 cm−3during Cloud 2
and 62 cm−3in Cloud 3. Assuming a black carbon density of 1.8 cm−3the total mass concentrations of rBC (MTot) are 73
and 62 ng m−3 for Clouds 2 and 3, respectively (Table 2). The rBCTot mass concentrations observed at Mt. Soledad
were higher than concentrations measured in clean marine air (Cooke et al., 1997; Shank et al., 2012), but considerably lower than concentrations measured in most urban environ-ments (see Table 1 in Metcalf et al., 2012).
3.3.2 Size distributions measured from the residual inlet (BulkAeroResand rBCRes)
Average size distributions of the bulk aerosol measured from the residual inlet (referred to as BulkAeroResfor the
remain-der of the document) are also shown in Fig. 5. The size dis-tributions of the BulkAeroResindicate that it was mostly the
larger particles of the BulkAeroTotdistributions that were
in-corporated into the sampled cloud droplets. The size distri-butions of BulkAeroRes as a function of time for both cloud
events are included in Fig. 3e for comparison.
The size distributions for BulkAeroRes shown in Fig. 5
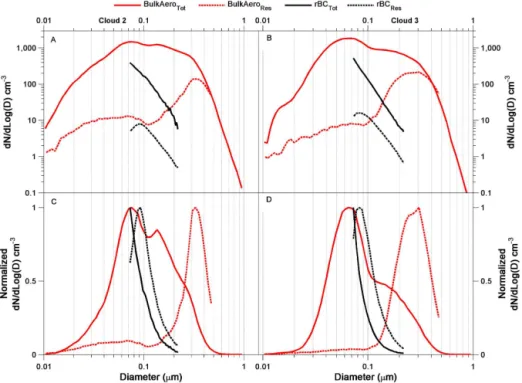
Figure 5.Summary of the averaged number size distributions for Cloud 2(a, c)and Cloud 3(b, d)for the total aerosol (red solid lines); residual aerosol (red dashed lines); total rBC as a function of core diameter (black solid lines); residual rBC as a function of core diameter (black dashed lines). Both the aerosol and rBC for each cloud event are shown in two ways: a log scale(a, b)to highlight the relative differ-ences between the aerosol and rBC as well as normalized to the respective maximum value(c, d)to highlight the shift in size distributions. All residual distributions have been corrected for instrument sensitivity (Fig. S1), CVI enhancement (Sect. S1), and droplet losses (Sect. S4).
Figure 5 also shows the size distributions of the rBC resid-uals measured with the CVI. Figure 5 shows that rBC cores smaller than 100 nm are incorporated into cloud droplets. In addition, they are overall larger than the rBCTot. Fitting the
rBCRes size distributions (assuming these distributions are
lognormal) results in mean geometric diameters of 87 and 81 nm for Clouds 2 and 3, respectively.
3.4 Size-resolved activated fraction
The size-resolved activated fraction [AF(Dp)] for rBC and
the bulk aerosol were calculated by taking the ratio of the number distributions measured with the residual inlet to the number distributions measured with the total inlet. Prior to calculating AF(Dp), a spline interpolation algorithm was
ap-plied to the rBC and bulk aerosol size distributions. After a spline interpolation was applied to the data, the follow-ing equation was used to calculate the size-resolved activated fraction:
AF Dp=
NRes Dp
×CF(Dp)
NTot(Dp)×EF×DT
, (1)
whereNRes(Dp) is the number of residual particles as a
func-tion of size, CF(Dp) is the size-resolved instrument
sen-sitivity correction factor, NTot(Dp) is the number of
parti-cles measured with the total inlet as a function of size, EF is the CVI enhancement factor (Sect. S1), and DT is the
droplet transmission factor through the CVI. Calculations of the droplet transmission factor are discussed in the Supple-ment Sect. S4 and plotted in Fig. S3. CF(Dp), which correct
for variances in instrument detection efficiencies, were de-termined from a 12 h period of cloud-free air on 5 June 2012 for the bulk aerosol and from side-by-side ambient sampling of room air during the post-campaign for rBC. Additional in-formation on the measurement of CF(Dp) for rBC is given in
the Supplement (Sect. S2).
The median AF(Dp) for the bulk aerosol and rBC are
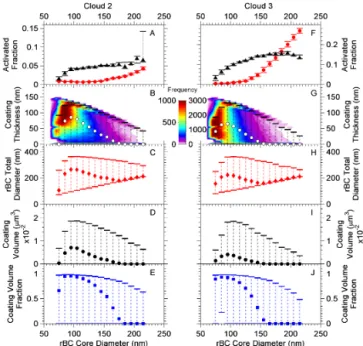
Figure 6.Shown in(a)and(f)are the median size-dependent ac-tivated fraction (AF) for the aerosol (red circles), and rBC (black triangles) for Clouds 2 and 3, respectively, where the error bars rep-resent the 10th and 90th percentiles. The bottom axes reprep-resent par-ticle diameter for the aerosol and core diameter for rBC. Panels(b)
and(g)show a 2-D histogram of coating thickness with the median values (white circles) overlaid on top, where the error bars show the 10th and 90th percentiles. Panels(c)and(h)show rBC total diam-eter (i.e., the core and the coating),(d)and(i)the coating volume, and(e)and(j)the coating volume fraction, all as a function of rBC core diameter.
the CVI was < 100 %, the calculated AF should be consid-ered as lower limits to the total fraction activated during the two cloud events.
3.5 Mechanism of incorporating rBC into cloud droplets
Two possible mechanisms exist for incorporating rBC-containing particles into cloud droplets: nucleation scaveng-ing and coagulation between the rBC-containscaveng-ing particles and cloud droplets. Based on calculations (Sect. S3), the frac-tion of rBC-containing particles expected to be incorporated into the cloud droplets by coagulation was on the order of < 1 %. This suggests that the dominant mechanism for incor-porating rBC particles into the cloud droplets studied was nucleation scavenging. First, the fraction of rBC-containing particles activated into cloud droplets increases as the size of the rBC cores increases (Fig. 6a, b). If coagulation dom-inated, we would expect to see an opposite trend. Second, calculated coagulation rates together with estimated lifetimes of the cloud droplets cannot explain the fraction of rBC-containing particles activated into the cloud droplets – the calculated coagulation rates are too small (Sect. S3).
3.6 Lower limits to coating thickness of rBC residuals Lower limits to the coating thicknesses on the rBC cores were determined using a core and shell Mie model. The me-dian values from this analysis are shown in Fig. 6b and g, where the error bars represent the 10th and 90th percentiles and the symbols represent the medians for each size bin. When calculating lower limits to the coating thicknesses, the particles were idealized as a pure BC core uniformly coated with a non-absorbing material, although the actual particle morphology may be more complicated (Sedlacek et al., 2012). The results shown in Fig. 6b and g give a qualita-tive explanation for why we see activation of rBC cores with sizes < 100 nm: these rBC cores have relatively thick coat-ings, which can lower the critical supersaturation required for activation. For example, 95 nm rBC cores incorporated into the cloud droplets had a median coating thickness of 65 nm.
Figure 6b and g show that as the rBC core diameter in-creased from 75 to approximately 100 nm the lower limit to the coating thickness also increased. This is likely be-cause as the rBC core diameter increased from 75 to 100 nm, the fraction of particles above the optical detection limit in-creased. Recall that for rBC-containing particles with diame-ters <≈100 nm, a relatively large fraction of the coated par-ticles are below the optical detection limits and hence are assigned a coating thickness of zero (Sect. 2.5). After the me-dian coating thickness reached a maximum at an rBC core di-ameter of approximately 100 nm, the lower limit to the coat-ing thickness decreased with an increase in rBC core diam-eter. This may suggest that the larger rBC cores had thinner coatings than the smaller rBC cores that were incorporated into the cloud droplets. Part of the decrease in the lower limit to the coating thickness with an increase in rBC core diameter could be due to saturation of the optical detector. As mentioned in Sect. 2.5, the optical detector became satu-rated when the rBC cores were relatively large and contain a modest coating. In Fig. 6c and h, we plotted the overall di-ameter of the rBC-containing particles. In other words, we plotted the sum of the rBC core diameter plus 2 times the coating thickness. If we disregard the point at 75 nm (which is likely strongly influenced by the fact that a large fraction of the rBC-containing particles with this core size are below the optical detection limit), we conclude that in order for the rBC-containing particles to be incorporated into the cloud droplets, the overall median diameter of rBC-containing par-ticles must be at least 165 nm in diameter. Figure 6c and h suggest that the overall diameter of the rBC-containing par-ticles is important for activation. This finding is consistent with previous work that has shown that particle diameter is important for activation of non-rBC-containing particles (e.g., Wang et al., 2008).
on the coating volume fraction as a function of size and rBC core diameters≥85 nm. As discussed above, coating volume fraction at 75 nm rBC core diameter, is likely strongly in-fluenced by the fact that a large fraction of rBC-containing particles, with this core size, are below the optical detection limit. Figure 6e and j show that for rBC core diameters from 85 to 95 nm, the median coating volume fraction is at least 0.9. This finding also gives a qualitative explanation for why we see relatively large activated fractions of small rBC cores in the cloud residuals.
As the rBC core diameter increased above approximately 100 nm, the lower limit to the coating volume fraction de-creased. This could be because larger rBC cores need less coating material in order to be incorporated into cloud droplets. Part of the decrease in coating volume fraction at rBC core diameters above 100 nm could also be due to the saturation limit of the optical scattering detectors, as dis-cussed above.
3.7 In-cloud aqueous-phase chemistry
In the discussion above, we assumed the coatings on the rBC cores were present before incorporation into the cloud droplets. However, some of the coating material may have formed after the rBC cores were incorporated into the cloud by aqueous-phase chemistry. As mentioned in the Supple-mentary Material (Sect. S3), the upper limits to residence times of air parcels in the clouds sampled at Soledad were likely ∼1 h. Whether significant aqueous-phase chemistry can occur on this timescale depends on the level of SO2
and oxidants. When SO2is absorbed by a cloud droplet, it
partitions in different forms as a function of pH: at lower pH values, the primary aqueous-phase oxidant of dissolved SO2, or S(IV) is H2O2; for higher pH values, ozone and
cat-alyzed aerobic oxidation are important oxidation pathways. Depending on the pH and available oxidants, conversion of the dissolved S(IV) to S(VI) can be fast or slow. The ab-sorption of large amounts of HNO3or N2O5can reduce the
pH significantly, which will require the presence of H2O2
in order to significantly convert S(IV) to S(VI). Since the clouds at Soledad occurred mostly overnight, the primary oxidant (H2O2) was likely lower (and probably near zero).
Also, analysis of the cloud water indicated that nitrate was high, and thus the pH was probably low. Based on these fac-tors, we suspect that aqueous-phase production of sulfate was not large. However, a quantitative estimate of the sulfate pro-duced is not possible since the measurements of SO2 and
H2O2 were not performed at this site. Based on the
discus-sion above, we assumed that a large fraction of the coatings were present before rBC particles were incorporated into the cloud droplets. However, the production of coating material from in-cloud aqueous-phase chemistry cannot be ruled out.
3.8 Comparison of rBCResas a function of size with predictions based onκ-Köhler theory
Sections 3.4 and 3.6 provide a qualitative explanation for how small rBC cores are incorporated into cloud droplets – the rBC cores have thick coatings leading to overall particle diameters greater than approximately 165 nm. In the follow-ing we expand on this qualitative explanation by carryfollow-ing out a quantitative analysis that shows that the presence of small rBC cores in the cloud residuals is consistent withκ-Köhler theory. This quantitative analysis consists of the following steps: (1) an estimation of the bulk aerosol composition; (2) an estimation of the critical diameter for activation of the cloud droplets sampled; (3) an estimation of the critical su-persaturation required to form the droplets sampled; and (4) a prediction of the critical diameter for activation of rBC cores. Steps 1–3 are required to carry out the predictions in step 4. 3.8.1 Bulk aerosol composition
A HR-ToF-AMS was used to measure the bulk aerosol com-position in residual particles downstream of the CVI. Five species (organic, nitrate, sulfate, ammonium, and chloride) were quantitatively differentiated. Then, based on a sim-plified ion-pairing scheme similar to Gysel et al. (2007; Sect. S5), the mass fractions of ammonium nitrate, nium sulfate, ammonium bisulfate, sulfuric acid, and ammo-nium chloride were calculated. The results of these calcu-lations are shown in Fig. 7. In order to determine the bulk aerosol hygroscopicity (Eq. 3), the mass fractions of these individual components were first converted to volume frac-tions using an organic density of 1.4 g cm−3 (Moore et al., 2012) and densities reported in Lide (2001) for the inorganic salts.
3.8.2 The critical diameter for activation of the bulk aerosol in the cloud droplets sampled
The critical diameter for activation (Dcrit) of the bulk aerosol
is often calculated by integrating the droplet number distribu-tion from the largest to smallest diameters until the number concentration equals the CDNC sampled (see for example Hersey et al., 2013). Using this method,Dcritwas found to be
241 and 239 nm for Cloud 2 and Cloud 3, respectively. Note theseDcrit values apply only to the cloud droplets sampled
(i.e., cloud droplets greater than ≈11 µm). Different Dcrit
values would be expected if the entire cloud droplet popu-lation were sampled.
3.8.3 Critical supersaturation for the cloud droplets sampled during the two cloud events
To estimate the critical supersaturation (SC) for the
Figure 7. Sub-micrometer non-refractory average aerosol mass fractions for Clouds 2 and 3 based on an ion-pairing scheme (see text and Sect. S5) and measured from a high resolution time-of-flight aerosol mass spectrometer.
was used. This model describes the relationship between the water vapor saturation ratio (S) over an aqueous solution droplet, which can be calculated using the following equa-tion:
S= D
3−D3 p
D3−D3
p(1−κBulk)
exp
4σ Mw
ρwRTD
(2) whereD is the droplet diameter;Dpis the dry particle
di-ameter;σ is the droplet surface tension and is assumed to be that of water, 0.072 J m−2;Mwis the molecular mass of
wa-ter;ρwis the density of water;Ris the universal gas constant;
T is the temperature; andκBulkis a compositionally specific
parameter that describes the bulk aerosol’s hygroscopicity. Equation (2) was used to find theSCneeded for a particle of
dry diameterDpto activate (Petters and Kreidenweis, 2007).
The overall hygroscopicity of a particular aerosol follows a simple mixing rule and can be calculated from
κBulk=
X
i
εiκi, (3)
whereεi is the volume fraction andκi is the hygroscopicity
parameter for each componentidiscussed in Sect. 3.8.1. The individual componentκ values used in Eq. (2) were 0.1 for organic (Lance et al., 2013; Moore et al., 2012; Rose et al., 2010); 0.67 for ammonium nitrate (Petters and Kreidenweis, 2007); 0.61 for ammonium sulfate and ammonium bisulfate (Petters and Kreidenweis, 2007; Wu et al., 2013); and 0.71 for sulfuric acid, which is the average of the range reported in Shantz et al. (2008). The value for ammonium chloride
κ (1.02) was calculated according to Eq. (A28) in Rose et al. (2008) using a Van ’t Hoff factor of 2.
Using the aboveκi values and the εi values discussed in
Sect. 3.8.1 in Eq. (3),κBulkvalues of 0.50 and 0.41 were
cal-culated for Cloud 2 and Cloud 3, respectively. Theκ values determined during this study are consistent with theκ val-ues suggested by Andreae and Rosenfeld (2008) for marine
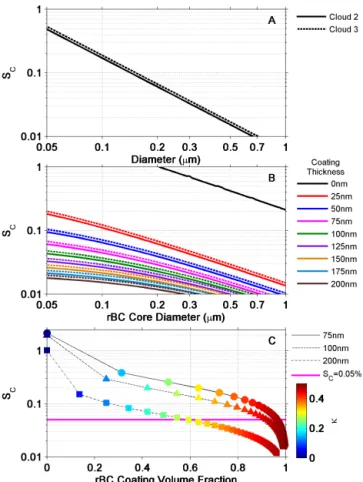
Figure 8.Panel(a)shows the critical supersaturation (SC, black
lines) as a function of particle dry diameter based on measured AMS bulk compositions and an ion-pairing scheme. Panel(b)showsSC
as a function of rBC core diameters with coatings ranging from 0 to 200 nm. In(b), the coatings are assumed to have the same com-position as the bulk residual aerosol (Fig. 7). The solid lines are for Cloud 2 and the dashed lines are for Cloud 3. Panel(c)shows
SCas a function of rBC coating volume fraction at three different
rBC core diameters (75, 100, and 200 nm), where each data point is colored by its correspondingκ. Also shown in panel(c)is the estimatedSC(pink line) determined for both clouds in this study.
aerosols during Cloud 2 and lower than theκ values sug-gested during Cloud 3.
Shown in Fig. 8a are plots ofSCas a function of dry
diam-eter for Cloud 2 (solid line) and Cloud 3 (dashed line) cal-culated using Eqs. (2) and (3). CombiningDcrit(Sect. 3.8.2)
with the results plotted in Fig. 8,SC for the cloud droplets
sampled can be determined. The points at whichDcrit
inter-sect with the calculatedSCtraces shown in Fig. 8 result in
es-timations ofSCvalues of 0.05 % for both clouds. Note these
critical supersaturations apply only to the cloud droplets sam-pled by the CVI. DifferentSCvalues would be expected if
was also connected to the residual inlet and sampled residual particles during the cloud events. Data from this instrument were used to derive an upper limit to the cloud supersatu-ration applicable to the cloud droplets sampled by the CVI (Modini et al., 2015), and was found to be approximately 0.1 %. This upper limit to the cloud supersaturation is ap-proximately consistent with theSCvalues reported here
us-ing the estimation technique discussed above.
In this determination of SC, several assumptions were
made which are addressed separately below: (1) the predom-inant mechanism for incorporation of particles into droplets was nucleation scavenging, and influences by impaction were negligible (Sect. 3.5); (2) the contribution from sea salt aerosols could be neglected. Based on sea salt mass concen-trations measured by the HR-ToF-AMS behind the CVI and calibrated against collocated ion chromatography measure-ments following a procedure similar to that introduced by Ovadnevaite et al. (2012), we estimated an upper limit of ap-proximately 15 % for the sea salt mass fraction of the cloud residuals (these results will be discussed in detail in a future publication). A sensitivity study (not shown here) indicated a < 8 % decrease in the estimatedSCwhen a sea salt
frac-tion of 15 % was included; (3) we assumed that the particles were internally mixed and the composition did not depend on size. Since, during this study, the size-dependent AMS data were at or below the detection limit we could not determine if the composition was size dependent. Additionally, no mea-surements of bulk aerosol mixing state were carried out; and (4) we assumed that the entire fraction of organics was wa-ter soluble and represented by aκof 0.1. To determine ifSC
was sensitive to this value,κfor organics was varied from 0 to 0.2, which is roughly consistent with the range of κ val-ues reported in the literature for organics (Chang et al., 2010; Lathem et al., 2013; Mei et al., 2013). Over this range ofκ
values,SCvaried by < 4 %.
3.8.4 Predictions of the critical diameter for activation of rBC cores
In Fig. 8b the critical diameter for activation of rBC cores for the cloud droplets sampled is calculated usingκ-Köhler theory and assuming coating thicknesses ranging from 0 to 200 nm, which covers the range of coating thicknesses mea-sured. In these calculations the composition of the coating was assumed to be the same as determined by the AMS (Sect. 3.8.1), and the rBC cores were assumed to be insolu-ble with aκ=0 (Rose et al., 2010). As expected, in Fig. 8b,
SCdecreases as the coating thickness increases at a constant
rBC core diameter. Figure 8b also suggests that if theSCis
≈0.05 % and the diameter of the rBC core is 95 nm, the coat-ing thickness must be between 50 and 75 nm. Our lower lim-its to the coating thicknesses for an rBC core diameter of 95 nm shown in Fig. 6b and g are consistent with these pre-dictions.
In Fig. 8c we plottedSCas a function of the rBC coating
volume fraction assuming rBC core diameters of 75, 100, and 200 nm. This figure illustrates that in order to activate 75 and 100 nm rBC cores at aSCof 0.05 % the rBC coating volume
fraction must be greater than 0.9. Figure 8c also shows that for an rBC core diameter of 200 nm, the coating volume frac-tion needs to be approximately 0.6. For 100 nm rBC cores the measurements are in good agreement with the predictions (compare Fig. 8c with Fig. 6e, j). For 75 and 200 nm cores the measurements are lower than the predictions. However, the measurements are not inconsistent with the calculations since the measurements represent lower limits.
4 Summary and conclusions
Cloud residuals were measured during two cloud events at the top of Mt. Soledad in La Jolla, CA. Back trajectories showed that air masses for both cloud events spent at least 96 h over the Pacific Ocean and traveled near, or over popu-lated regions before arriving on site. Based on measured bulk aerosol concentrations the two air masses sampled were clas-sified as polluted marine air, a classification consistent with the back trajectories and measured concentrations of black carbon. Size distributions of the bulk aerosol residuals were shifted to larger sizes for both cloud events compared to size distributions measured with the total inlet. The size distribu-tions of rBC cloud residuals were also shifted towards larger diameters when compared to the size distributions of rBC measured with the total inlet. The activated fractions of rBC determined from the measurements ranged from 0.01 to 0.1 for rBC core diameters ranging from 70 to 220 nm. This type of data will be useful for constraining models used to predict rBC concentrations in the atmosphere. Since the fraction of cloud droplets sampled by the CVI was less than 100 %, the measured activated fractions of rBC are lower limits to the total fraction of rBC activated during the two cloud events.
for rBC core diameters ranging from 85 to 95 nm, a result consistent with κ-Köhler theory. In addition, the measure-ments suggest that the total diameter (rBC core and coating) must be at least 165 nm in order for rBC cores with diameters ≥85 nm to be incorporated into cloud droplets. The results also suggest that the total particle diameter (core and coating thickness) is important for determining if rBC particles are incorporated into the cloud droplets. This finding is consis-tent with previous work that has shown that particle diameter is important for activation of non-rBC-containing particles (Wang et al., 2008).
The Supplement related to this article is available online at doi:10.5194/acp-15-1367-2015-supplement.
Acknowledgements. The authors would like to thank D. Toom-Sauntry, S. Sharma, and A. Sheppard, from Environment Canada, as well as A. Lee and R. Zhou, from the University of Toronto, for their contributions during the campaign and the three anonymous referees for very helpful feedback on the manuscript. The authors are also grateful for funding provided by Environment Canada through the Clean Air Regulatory Agenda, NSERC, NSF (grant AGS1013423), and the FORMAS MACCII project.
Edited by: B. Ervens
References
Allan, J. D., Delia, A. E., Coe, H., Bower, K. N., Alfarra, M. R., Jimenez, J. L., Middlebrook, A. M., Drewnick, F., Onasch, T. B., Canagaratna, M. R., Jayne, J. T., and Worsnop, D. R.: A generalised method for the extraction of chemically resolved mass spectra from Aerodyne aerosol mass spectrometer data, J. Aerosol Sci., 35, 909–922, doi:10.1016/j.jaerosci.2004.02.007, 2004.
Anderson, T. L., Charlson, R. J., and Covert, D. S.: Calibration of a Counterflow Virtual Impactor at Aerodynamic Diameters from 1 to 15 µm, Aerosol Sci. Technol., 19, 317–329, 1993.
Andreae, M. O.: Correlation between cloud condensation nu-clei concentration and aerosol optical thickness in remote and polluted regions, Atmos. Chem. Phys., 9, 543–556, doi:10.5194/acp-9-543-2009, 2009.
Andreae, M. O. and Rosenfeld, D.: Aerosol cloud pre-cipitation interactions. Part 1. The nature and sources of cloud-active aerosols, Earth-Sci. Rev., 89, 13–41, doi:10.1016/j.earscirev.2008.03.001, 2008.
Bates, T. S., Quinn, P. K., Covert, D. S., Coffman, D. J., Johnson, J. E., and Wiedensohler, A.: Aerosol physical properties and pro-cesses in the lower marine boundary layer: a comparison of ship-board sub-micron data from ACE-1 and ACE-2, Tellus B, 52B, 258–272, 2000.
Bates, T. S., Coffman D. J., Covert, D. S., and Quinn, P. K.: Re-gional marine boundary layer aerosol size distributions in the In-dian, Atlantic, and Pacific Oceans: A comparison of INDOEX
measurements with ACE-1, ACE-2, and Aerosols99, J. Geophys. Res., 107, 8026, doi:10.1029/2001JD001174, 2002.
Baumgardner, D., Popovicheva, O., Allan, J., Bernardoni, V., Cao, J., Cavalli, F., Cozic, J., Diapouli, E., Eleftheriadis, K., Gen-berg, P. J., Gonzalez, C., Gysel, M., John, A., Kirchstetter, T. W., Kuhlbusch, T. A. J., Laborde, M., Lack, D., Müller, T., Niessner, R., Petzold, A., Piazzalunga, A., Putaud, J. P., Schwarz, J., Sheri-dan, P., Subramanian, R., Swietlicki, E., Valli, G., Vecchi, R., and Viana, M.: Soot reference materials for instrument calibration and intercomparisons: a workshop summary with recommenda-tions, Atmos. Meas. Tech., 5, 1869–1887, doi:10.5194/amt-5-1869-2012, 2012.
Bond, T. C. and Bergstrom, R. W.: Light Absorption by Carbona-ceous Particles: An Investigative Review, Aerosol Sci. Technol., 40, 27–67, doi:10.1080/02786820500421521, 2006.
Bond, T. C., Doherty, S. J., Fahey, D. W., Forster, P. M., Berntsen, T., DeAngelo, B. J., Flanner, M. G., Ghan, S., Kärcher, B., Koch, D., Kinne, S., Kondo, Y., Quinn, P. K., Sarofim, M. C., Schultz, M. G., Schulz, M., Venkataraman, C., Zhang, H., Zhang, S., Bellouin, N., Guttikunda, S. K., Hopke, P. K., Jacobson, M. Z., Kaiser, J. W., Klimont, Z., Lohmann, U., Schwarz, J. P., Shindell, D., Storelvmo, T., Warren, S. G., and Zender, C. S.: Bounding the role of black carbon in the climate system: A sci-entific assessment, J. Geophys. Res.-Atmos., 118, 5380–5552, doi:10.1002/jgrd.50171, 2013.
Chang, R. Y.-W., Slowik, J. G., Shantz, N. C., Vlasenko, A., Liggio, J., Sjostedt, S. J., Leaitch, W. R., and Abbatt, J. P. D.: The hy-groscopicity parameter (κ) of ambient organic aerosol at a field site subject to biogenic and anthropogenic influences: relation-ship to degree of aerosol oxidation, Atmos. Chem. Phys., 10, 5047–5064, doi:10.5194/acp-10-5047-2010, 2010.
Cooke, W., Jennings, S. G., and Spain, T. G.: Black carbon measure-ments at Mace Head, 1989–1996, J. Geophys. Res., 102, 1989– 1996, doi:10.1029/97JD01430, 1997.
Cozic, J., Verheggen, B., Mertes, S., Connolly, P., Bower, K., Petzold, A., Baltensperger, U., and Weingartner, E.: Scav-enging of black carbon in mixed phase clouds at the high alpine site Jungfraujoch, Atmos. Chem. Phys., 7, 1797–1807, doi:10.5194/acp-7-1797-2007, 2007.
DeCarlo, P. F., Kimmel, J. R., Trimborn, A., Northway, M. J., Jayne, J.T., Jayne, J. T., Aiken, A. C., Gonin, M., Fuhrer, K., Horvath, T., Docherty, K. S., Worsnop, D. R., and Jimenez, J. L.: Field-deployable, high-resolution, time-of-flight aerosol mass spec-trometer, Anal. Chem., 78, 8281–8289, doi:10.1021/ac061249n, 2006.
Draxler, R. R. and Rolph, G. D.: HYSPLIT (HYbrid Single-Particle Langrangian Integrated Trajectory) Model access via NOAA ARL READY Website, NOAA Air Resources Laboratory, Silver Spring, MD, available at: http://ready.arl.noaa.gov/HYSPLIT. php, last access: 4 February 2014, 2013 .
Eugster, W., Burkard, R., Holwerda, F., Scatena, F. N., and Brui-jnzeel, L. A.: Sampurno.: Characteristics of fog and fogwater fluxes in a Puerto Rican elfin cloud forest, Agr. Forest Meteo-rol., 139, 288–306, 2006.
Gao, R. S., Schwarz, J. P., Kelly, K. K., Fahey, D. W., Watts, L. A., Thompson, T. L., Spackman, J. R., Slowik, J. G., Cross, E. S., Han, J.-H., Davidovits, P., Onasch, T. B., and Worsnop, D. R.: A Novel Method for Estimating Light-Scattering Properties of Soot Aerosols Using a Modified Single-Particle Soot Photometer, Aerosol Sci. Technol., 41, 125–135, doi:10.1080/02786820601118398, 2007.
Gieray, R., Wieser, P., Engelhardt, T., Swietlicki, E., Hansson, H.-C., Mentes, B., Orsini, D., Martinsson, B., Svenningsson, B., Noone, K. J., and Heintzenbergg, J.: Phase partitioning of aerosol constituents in cloud based on single-particle and bulk analysis, Atmos. Environ., 31, 2491–2502, 1997.
Glantz, P. and Noone, K. J.: A physically-based algorithm for esti-mating the relationship between aerosol mass and cloud droplet number, Tellus B, 52B, 1216–1231, 2000.
Granat, L., Engström, J. E., Praveen, S., and Rodhe, H.: Light absorbing material (soot) in rainwater and in aerosol particles in the Maldives, J. Geophys. Res., 115, 1–12, doi:10.1029/2009JD013768, 2010.
Gysel, M., Crosier, J., Topping, D. O., Whitehead, J. D., Bower, K. N., Cubison, M. J., Williams, P. I., Flynn, M. J., McFiggans, G. B., and Coe, H.: Closure study between chemical composition and hygroscopic growth of aerosol particles during TORCH2, Atmos. Chem. Phys., 7, 6131–6144, doi:10.5194/acp-7-6131-2007, 2007.
Gysel, M., Laborde, M., Olfert, J. S., Subramanian, R., and Gröhn, A. J.: Effective density of Aquadag and fullerene soot black car-bon reference materials used for SP2 calibration, Atmos. Meas. Tech., 4, 2851–2858, doi:10.5194/amt-4-2851-2011, 2011. Hallberg, A., Ogren, J. A., Noone, K. J., Heintzenberg, J., Berner,
A., Solly, I., Kruisz, C., Reischl, G., Fuzzi, S., Facchini, M. C., Hansson, H.-C., Wiedensohler, A., and Svenningsson, I. B.: Phase partitioning for different aerosol species in fog, Tellus B, 44B, 545–555, 1992.
Hallberg, A., Ogren, J. A., Noone, K. J., Okada, K., Heintzenberg, J., and Svenningsson, I. B.: The influence of aerosol particle composition on cloud droplet formation, J. Atmos. Chem., 19, 153–171, 1994.
Hawkins, L. N., Russell, L. M., Covert, D. S., Quinn, P. K., and Bates, T. S.: Carboxylic acids, sulfates, and organosulfates in processed continental organic aerosol over the southeast Pa-cific Ocean during VOCALS-REx 2008, J. Geophys. Res., 115, D13201, doi:10.1029/2009JD013276, 2010.
Hersey, S. P., Craven, J. S., Metcalf, A. R., Lin, J., Lathem, T., Suski, K. J., Cahill, J. F., Duong, H. T., Sorooshian, A., Jonsson, H. H., Shiraiwa, M., Zuend, A., Nenes, A., Prather, K. A., Flagan, R. C., and Seinfeld, J. H.: Composition and hygroscopicity of the Los Angeles Aerosol: CalNex, J. Geophys. Res.-Atmos., 118, 3016– 3036, doi:10.1002/jgrd.50307, 2013.
Hitzenberger, R., Berner, A., Kromp, R., Kasper-Giebl, A., Lim-beck, A., Tscherwenka, W., and Puxbaum, H.: Black carbon and other species at a high-elevation European site (Mount Sonnblick, 3106 m, Austria): Concentrations and scavenging ef-ficiencies, J. Geophys. Res., 105, 24637–24645, 2000.
Hitzenberger, R., Berner, A., Glebl, H., Drobesch, K., Kasper-Giebl, A., Loeflund, M., Urban, H., and Puxbaum, H.: Black carbon (BC) in alpine aerosols and cloud water – concentrations and scavenging efficiencies, Atmos. Environ., 35, 5135–5141, 2001.
Kasper-Giebl, A., Koch, A., Hitzenberger, R., and Puxbaum, H.: Scavenging efficiency of “aerosol carbon” and sulfate in super-cooled clouds at Mt. Sonnblick (3106 m asl, Austria), J. Atmos. Chem., 35, 33–46, 2000.
Laborde, M., Mertes, P., Zieger, P., Dommen, J., Baltensperger, U., and Gysel, M.: Sensitivity of the Single Particle Soot Photometer to different black carbon types, Atmos. Meas. Tech., 5, 1031– 1043, doi:10.5194/amt-5-1031-2012, 2012.
Lance, S., Raatikainen, T., Onasch, T. B., Worsnop, D. R., Yu, X.-Y., Alexander, M. L., Stolzenburg, M. R., McMurry, P. H., Smith, J. N., and Nenes, A.: Aerosol mixing state, hygroscopic growth and cloud activation efficiency during MIRAGE 2006, Atmos. Chem. Phys., 13, 5049–5062, doi:10.5194/acp-13-5049-2013, 2013. Lathem, T. L., Beyersdorf, A. J., Thornhill, K. L., Winstead, E. L.,
Cubison, M. J., Hecobian, A., Jimenez, J. L., Weber, R. J., An-derson, B. E., and Nenes, A.: Analysis of CCN activity of Arc-tic aerosol and Canadian biomass burning during summer 2008, Atmos. Chem. Phys., 13, 2735–2756, doi:10.5194/acp-13-2735-2013, 2013.
Lide, D. R. (Ed.): CRC Handbook of Chemistry and Physics, 82nd ed., CRC Press, 2001.
Mätzler, C.: MATLAB Functions for Mie Scattering and Absorp-tion Version 1 – Research Report No. 2002-08, available at: http://www.iap.unibe.ch/publications/download/201/en/, 20 Oc-tober 2014, 2002a.
Mätzler, C.: MATLAB Functions for Mie Scattering and Absorption Version 2 – Research Report No. 2002-11, available at: www. iap.unibe.ch/publications/download/199/en/, 20 October 2014, 2002b.
Mei, F., Hayes, P. L., Ortega, A., Taylor, J. W., Allan, J. D., Gilman, J., Kuster, W., de Gouw, J., Jimenez, J. L., and Wang, J.: Droplet activation properties of organic aerosols observed at an urban site during CalNex-LA, J. Geophys. Res.-Atmos., 118, 2903–2917, doi:10.1002/jgrd.50285, 2013.
Metcalf, A. R., Craven, J. S., Ensberg, J. J., Brioude, J., Angevine, W., Sorooshian, A., Duong, H. T., Jonsson, H. H., Flagan, R. C., and Seinfeld, J. H.: Black carbon aerosol over the Los Ange-les Basin during CalNex, J. Geophys. Res.-Atmos., 117, 1–24, doi:10.1029/2011JD017255, 2012.
Modini, R. L., Frossard, A. A., Ahlm, L., Russell, L.M., Corrigan, C. E., Roberts, G. C., Hawkins, L. N., Schroder, J. C., Bertram, A. K., Zhao, R., Lee, A. K. Y., Abbatt, J. P. D., Lin, J., Nenes, A., Wang, Z., Wonaschütz, A., Sorooshian, A., Noone, K. J., Jons-son, H., Seinfeld, J. H., Toom-Sauntry, D., Macdonald, A. M., and Leaitch, W. R.: Sea-spray-areosol-cloud interactions off the coast of California, in preparation, 2015.
Moore, R. H., Cerully, K., Bahreini, R., Brock, C. A., Middlebrook, A. M., and Nenes, A.: Hygroscopicity and composition of Cali-fornia CCN during summer 2010, J. Geophys. Res.-Atmos., 117, 1–14, doi:10.1029/2011JD017352, 2012.
Moteki, N. and Kondo, Y.: Effects of Mixing State on Black Carbon Measurements by Laser-Induced Incandescence, Aerosol Sci. Technol., 41, 398–417, doi:10.1080/02786820701199728, 2007. Moteki, N., Kondo, Y., Takegawa, N., and Nakamura, S.: Directional dependence of thermal emission from non-spherical carbon particles, J. Aerosol Sci., 40, 790–801, doi:10.1016/j.jaerosci.2009.05.003, 2009.
Appli-cation to black carbon particles, J. Aerosol Sci., 41, 513–521, doi:10.1016/j.jaerosci.2010.02.013, 2010.
Noone, K. J., Ogren, J. A., Heintzenberg, J., Charlson, R. J., and Covert, D. S.: Design and Calibration of a Counterflow Virtual Impactor for Sampling of Atmospheric Fog and Cloud Droplets, Aerosol Sci. Technol., 8, 235–244, 1988.
O’Dowd, C., Becker, E., and Kulmala, M.: Mid-latitude North-Atlantic aerosol characteristics in clean and polluted air, Atmos. Res., 58, 167–185, 2001.
Ovadnevaite, J., Ceburnis, D., Canagaratna, M., Berresheim, H., Bialek, J., Martucci, G., Worsnop, D. R., and O’Dowd, C.: On the effect of wind speed on submicron sea salt mass con-centrations and source fluxes, J. Geophys. Res., 117, 1–11, doi:10.1029/2011JD017379, 2012.
Pekour, M. S. and Cziczo, D. J.: Wake capture, parti-cle breakup, and other artifacts associated with counter-flow virtual impaction, Aerosol Sci. Technol., 45, 758–764, doi:10.1080/02786826.2011.558942, 2011.
Petters, M. D. and Kreidenweis, S. M.: A single parameter repre-sentation of hygroscopic growth and cloud condensation nucleus activity, Atmos. Chem. Phys., 7, 1961–1971, doi:10.5194/acp-7-1961-2007, 2007.
Pirjola, L. and O’Dowd, C.: Can new particle formation occur in the clean marine boundary layer?, J. Geophys. Res., 105, 26531– 26546, 2000.
Pratt, K. A., Heymsfield, A. J., Twohy, C. H., Murphy, S. M., De-Mott, P. J., Hudson, J. G., Subramanian, R., Wang, Z., Seinfeld, J. H., and Prather, K. A.: In Situ Chemical Characterization of Aged Biomass-Burning Aerosols Impacting Cold Wave Clouds, J. Atmos. Sci., 67, 2451–2468, doi:10.1175/2010JAS3330.1, 2010.
Riemer, N., West, M., Zaveri, R., and Easter, R.: Estimating black carbon aging time-scales with a particle-resolved aerosol model, J. Aerosol Sci., 41, 143–158, doi:10.1016/j.jaerosci.2009.08.009, 2010.
Rolph, G. D.: Real-time Environmental Application and Display sYstem (READY) Website. NOAA Air Resources Laboratory, Silver Spring, MD., available at: http//ready.arl.noaa.gov, 4 February 2014, 2013.
Rose, D., Gunthe, S. S., Mikhailov, E., Frank, G. P., Dusek, U., Andreae, M. O., and Pöschl, U.: Calibration and measurement uncertainties of a continuous-flow cloud condensation nuclei counter (DMT-CCNC): CCN activation of ammonium sulfate and sodium chloride aerosol particles in theory and experiment, Atmos. Chem. Phys., 8, 1153–1179, doi:10.5194/acp-8-1153-2008, 2008.
Rose, D., Nowak, A., Achtert, P., Wiedensohler, A., Hu, M., Shao, M., Zhang, Y., Andreae, M. O., and Pöschl, U.: Cloud conden-sation nuclei in polluted air and biomass burning smoke near the mega-city Guangzhou, China – Part 1: Size-resolved measure-ments and implications for the modeling of aerosol particle hy-groscopicity and CCN activity, Atmos. Chem. Phys., 10, 3365– 3383, doi:10.5194/acp-10-3365-2010, 2010.
Schwarz, J. P., Gao, R. S., Fahey, D. W., Thomson, D. S., Watts, L. A., Wilson, J. C., Reeves, J. M., Darbeheshti, M., Baum-gardner, D. G., Kok, G. L., Chung, S. H., Schulz, M., Hen-dricks, J., Lauer, A., Kärcher, B., Slowik, J. G., Rosenlof, K. H., Thompson, T. L., Langford, a. O., Loewenstein, M., and Aikin, K. C.: Single-particle measurements of midlatitude
black carbon and light-scattering aerosols from the boundary layer to the lower stratosphere, J. Geophys. Res., 111, 1–15, doi:10.1029/2006JD007076, 2006.
Schwarz, J. P., Gao, R. S., Spackman, J. R., Watts, L. A., Thomson, D. S., Fahey, D. W., Ryerson, T. B., Peischl, J., Holloway, J. S., Trainer, M., Frost, G. J., Baynard, T., Lack, D. A., de Gouw, J. A., Warneke, C., and Del Negro, L. A.: Measurement of the mixing state, mass, and optical size of individual black carbon particles in urban and biomass burning emissions, Geophys. Res. Lett., 35, L13810, doi:10.1029/2008GL033968, 2008a.
Schwarz, J. P., Spackman, J. R., Fahey, D. W., Gao, R. S., Lohmann, U., Stier, P., Watts, L. A., Thomson, D. S., Lack, D. A., Pfister, L., Mahoney, M. J., Baumgardner, D., Wilson, J. C., and Reeves, J. M.: Coatings and their enhancement of black carbon light ab-sorption in the tropical atmosphere, J. Geophys. Res., 113, 1–10, doi:10.1029/2007JD009042, 2008b.
Schwarz, J. P., Spackman, J. R., Gao, R. S., Perring, A. E., Cross, E., Onasch, T. B., Ahern, A., Wrobel, W., Davi-dovits, P., Olfert, J., Dubey, M. K., Mazzoleni, C., and Fa-hey, D. W.: The Detection Efficiency of the Single Parti-cle Soot Photometer, Aerosol Sci. Technol., 44, 612–628, doi:10.1080/02786826.2010.481298, 2010.
Schwarzenboeck, A.: Cut size minimization and cloud element break-up in a ground-based CVI, 31, 477–489, 2000.
Sedlacek, A. J., Lewis, E. R., Kleinman, L., Xu, J., and Zhang, Q.: Determination of and evidence for non-core-shell structure of particles containing black carbon using the Single-Particle Soot Photometer (SP2), Geophys. Res. Lett., 39, L06802, doi:10.1029/2012GL050905, 2012.
Sellegri, K., Laj, P., Dupuy, R., Legrand, M., Preunkert, S., and Putaud, J.-P.: Size-dependent scavenging efficiencies of multi-component atmospheric aerosols in clouds, J. Geophys. Res., 108, 4334, doi:10.1029/2002JD002749, 2003.
Shank, L. M., Howell, S., Clarke, A. D., Freitag, S., Brekhovskikh, V., Kapustin, V., McNaughton, C., Campos, T., and Wood, R.: Organic matter and non-refractory aerosol over the re-mote Southeast Pacific: oceanic and combustion sources, Atmos. Chem. Phys., 12, 557–576, doi:10.5194/acp-12-557-2012, 2012. Shantz, N. C., Leaitch, W. R., Phinney, L., Mozurkewich, M., and Toom-Sauntry, D.: The effect of organic compounds on the growth rate of cloud droplets in marine and forest settings, At-mos. Chem. Phys., 8, 5869–5887, doi:10.5194/acp-8-5869-2008, 2008.
Spiegel, J. K., Zieger, P., Bukowiecki, N., Hammer, E., Weingart-ner, E., and Eugster, W.: Evaluating the capabilities and uncer-tainties of droplet measurements for the fog droplet spectrometer (FM-100), Atmos. Meas. Tech., 5, 2237–2260, doi:10.5194/amt-5-2237-2012, 2012.
Stephens, M., Turner, N., and Sandberg, J.: Particle identification by laser-induced incandescence in a solid-state laser cavity, Appl. Opt., 42, 3726–3736, 2003.
Subramanian, R., Kok, G. L., Baumgardner, D., Clarke, A., Shi-nozuka, Y., Campos, T. L., Heizer, C. G., Stephens, B. B., de Foy, B., Voss, P. B., and Zaveri, R. A.: Black carbon over Mexico: the effect of atmospheric transport on mixing state, mass absorption cross-section, and BC/CO ratios, Atmos. Chem. Phys., 10, 219– 237, doi:10.5194/acp-10-219-2010, 2010.