M
ASTER OF
S
CIENCE IN
FINANCE
M
ASTERS
F
INAL
W
ORK
PROJECT
EQUITY RESEARCH
:
C
ONTINENTAL AG
MIGUEL GOMES ESTEVES CRISTO LOPES
M
ASTER OF
S
CIENCE IN
FINANCE
M
ASTERS
F
INAL
W
ORK
PROJECT
EQUITY RESEARCH
:
CONTINENTAL
AG
MIGUEL
GOMES
ESTEVES
CRISTO
LOPES
S
UPERVISOR
:
P
ROF
.
D
OUTORA
A
NA
I
SABEL
O
RTEGA
V
ENÂNCIO
Abstract
The following project is a valuation of the company Continental AG, based solely in public information until the 24th of April 2019. It follows the format recommend by the CFA institute.
Continental AG is one of the global players in the tyre and automotive Original Equipment Manufacturer (OEM) industries. It was founded in 1871 in Hanover, Germany, as result of a merger between Continental-Caoutchouc and Gutta-Percha Compagnie, and, today is the parent company of the Continental group.
This valuation derived from an intrinsic valuation, based in a Discounted Cash Flow (DFC) method through a Free Cash Flow to the Firm (FCFF) perspective, supported by a relative valuation and coherent with the Reuters consensus.
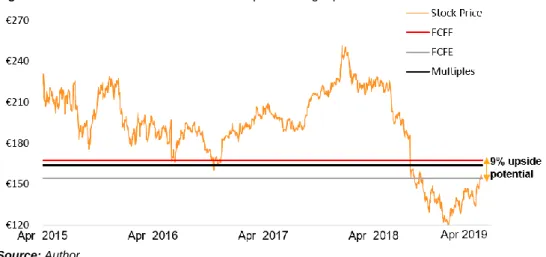
The final target price is €167.45/sh for Continental at 2019YE and a respective HOLD recommendation, based on a upside potential of 9% compared to Continental share price at 24th of April 2019 and a medium risk profile.
JEL classification: G10 ; G32; G34.
ii
Resumo
O seguinte trabalho final de mestrado faz uma avaliação da empresa Continental AG, baseada apenas em informação publica até 24 de abril 2019. Esta avaliação segue o formato recomendado pelo CFA
institute.
A Continental AG é um dos líderes de mercado na indústria dos pneus e do equipamento original automóvel. Foi fundada em 1871 em Hanover, Alemanha, como resultado de uma fusão entre Continental-Caoutchouc e Gutta-Percha Compagnie, e, hoje é a empresa mãe do grupo Continental.
Esta avaliação realizou uma análise intrínseca do valor da empresa, baseada no método de fluxos de caixa atualizados, através da perspetiva dos fluxos de caixa para a empresa, suportada por uma avaliação relativa e coerente com o consenso da Reuters.
O preço alvo final é de €167.4/ação para a empresa Continental no final do ano de 2019 e a respetiva recomendação é de manter, baseada num potencial de subida de 9% comparado com o preço da ação em 24 de abril 2019 e num perfil de risco médio.
Classificação JEL: G10; G32 e G34.
Index
Abstract i Resumo ii Index iii List of Figures iv List of Tables vi 1. Research Snapshot 1 2. Business Description 2 3. Corporate Strategy 44. Management and Corporate Governance 6
5. Macroeconomic Overview 9
6. Industry Overview and Competitive Positioning 10
7. Investment Summary 16
8. Valuation 18
9. Financial Analysis 23
10. Investment Risks 25
Appendices 28
Appendix 1: Statement of Financial Position (in €M) 28
Appendix 2: Income Statement (in €M) 29
Appendix 3: Cash Flow Statement (in €M) 29
Appendix 4: Common-Size Statement of Financial Position 30
Appendix 5: Common-Size Income Statement 31
Appendix 6: Common-Size Cash Flow Statement 31
Appendix 7: Key Financial Ratios 32
Appendix 8: Forecasting Assumptions 33
Appendix 9: Free Cash Flow to the Firm 35
Appendix 10: Free Cash Flow to the Equity 35
Appendix 11: Organizational Structure and respective products 35
Appendix 12: Governance model 36
Appendix 13: External Agencies Ratings 37
Appendix 14: Continental Peers 37
Appendix 15: Recommendation System 38
References 39
iv
List of Figures
Figure 1. Continental market profile 1
Figure 2. Analyst risk assessment 1
Figure 3. Valuation summary 1
Figure 4. Earnings per share (EPS) and dividends per Share (DPS) 1
Figure 5. Monte-Carlo – Sensitivity analysis on the Price target 1
Figure 6. Continental share evolution and respective target prices 1
Figure 7. Continental’s presence 2
Figure 8. Continental turnover YE18 2
Figure 9. Chassis & safety division organization 2
Figure 10. Powertrain division reorganization 2
Figure 11. Interior division reorganization 3
Figure 12. Tyre division organization 3
Figure 13. ContiTech division organization 3
Figure 14. Continental umbrella structure in 2020 4
Figure 15. Continental long-term corporate strategy 4
Figure 16. ROCE and CVC Evolution 4
Figure 17. Geographical activity breakdown 4
Figure 18. Continental YE18 sales in OE & NOE 5
Figure 19. Cube – Test drives 5
Figure 20. Powertrain vs. Continental historical ROCE 5
Figure 21. Simplified shareholders organogram 6
Figure 22. Dividend and pay-out ratio evolution 6
Figure 23. Executive board composition 7
Figure 24. Chairman of the supervisory board 7
Figure 25. Eco contact tyre 6 overview 8
Figure 26. Women in management positions 8
Figure 27. Worldwide GDP growth Y.o.Y and inflation growth 9
Figure 28. Euro zone GDP growth Y.o.Y and inflation growth 9
Figure 29. United States and emerging and developing Asia GDP growth Y.o.Y. 9
Figure 30. China and India GDP growth Y.o.Y. 9
Figure 31. Tyre industry segmentation 10
Figure 32. Automotive demand, forecast before 2018 (in million units) 10
Figure 33. Forecasted global sales volume of Tyres (in billion units). 10
Figure 34. Automobile production (in million units) 10
Figure 35. Electric car fleet outlook (in million units) 11
Figure 36. Contiseal – from Continental AG 11
Figure 38. Breakdown Tyre production costs 12
Figure 39. Market share of the 3 main Tyre industry players in 2004 12
Figure 40. Market share of the 3 main Tyre industry players in 2017 12
Figure 41. Porter’s 5 forces 13
Figure 42. Crude oil ($ per barrel) and natural rubber ($/Kg) evolution 14
Figure 43. Porter’s 5 forces Automotive OE suppliers’ industry 14
Figure 44. Operating profit and net debt to EBIT (without the impact of IFRS 16) 16
Figure 45. Continental’s earnings per share (EPS) and dividends per Share (DPS) 16
Figure 46. Continental’s earnings per share (EPS) and payout Ratio 16
Figure 47. Monte-Carlo simulation on the target price of Continental 17
Figure 48. Monte-Carlo – Sensitivity analysis on the Price target 17
Figure 49. Continental’s revenues evolution 2016-2023F 18
Figure 50. Continental’s CAPEX evolution 2016-2023F 19
Figure 51. Continental factoring in Lousado, Portugal (extension of €100m ongoing). 19
Figure 52. Continental’s debt composition in YE18 (M€ and %) 20
Figure 53. Continental’s net debt evolution (2016-2023) 20
Figure 54. Continental’s debt evolution (2019-2023) 20
Figure 55. Sales vs. Operating profit per division 23
Figure 56. Continental historical sales evolution 23
Figure 57. Continental historical sales evolution 23
Figure 58. Historic and outlook of operating profit 23
Figure 59. NOCF vs. Investments and shareholder remuneration 24
Figure 60. Continental cash at hands evolution 24
vi
List of Tables
Table 1 – Continental’s main Shareholders 6
Table 2 – Continental’s ESG classifications (scale from A+(highest/best) to D- (lowest/worst)) 7
Table 3 - Comparison of retail Tyre prices, 2017 (€ including VAT) 13
Table 4 – Continental’s SWOT analysis 15
Table 5 – Valuation summary 16
Table 6 – Reuters consensus (scale 1-sell to 5-buy) 17
Table 7 – Revenues forecast in € M (Automotive segment) 18
Table 8 – Revenues forecast (Tyre segment) 18
Table 9 – Revenues forecast (ContiTech and total sales) 19
Table 10 – Summary of Continental consolidated sales in 2018 and 2019F (in €M) 19
Table 11 – WACC FY19 summary 20
Table 12 – Terminal WACC summary 21
Table 13 – Enterprise value to equity value (M€) 21
Table 14 – Final peer group selection 21
Table 15 – Relative Valuation calculations 22
Table 16 – Relative valuation summary 22
Table 17 – Peers Automotive segment 37
Continental AG: Instability, safety and re-organization
YE 2019 Price Target of €167.47 (+9% upside potential), Hold recommendation
Our final recommendation is HOLD, for Continental AG at YE19 with a target price of €167.45/sh and a respective 9% upside potential compared to 24th of April 2019,
using the DFC method (FCFF perspective) and a medium risk assessment.
Figure 6. Continental share evolution and respective target prices
Source: Author
The TP of €167.45/sh was achieved through an intrinsic valuation (DFC model - FCFF) and supported by a relative valuation with a TP of €163.53/sh. Additionally, it was also analysed through a FCFE perspective, which resulted in a TP slightly more conservative at €153.93/sh. Lastly, the consensus provided by Reuters analysts also pointed for a hold recommendation.
Continental is foreseen to continue posting recurrent profitability, in line with the last decade, however FY19 is forecasted to follow the deterioration of operating profitability seen in 2018 and drop it by 13% (vs. PY). From 2020 to 2023, the firm is expected to recover the momentum seen last years and grow at a 4.7% CAGR, mainly in line with expectations of the industry in the long term. Furthermore, Continental’s financial profile continues solid, where net debt to EBIT is expected to continue to fall in the same trend as in the three previous years and turn negative in 2021. With a light financial cost structure, EPS are expected to follow operating profitability and drop by 14% in 2019 down to €12.3/per sh. This represents a decrease 11% higher compared to YE17-YE18 evolution.
It was also computed a complementary analysis through a Monte-Carlo simulation, where it was verified the sensitivity of the model towards several variables. The most sensitive ones were the terminal Growth (correlation of 36.2%); its sales (correlation of 29.5%) and lastly the Cost of Sales (COS), with a correlation of - 24.3%.
1. Research Snapshot
Continental AG
HOLD
Recommendation
Medium Risk
14th of October 2019Figure 1. Continental market profile
Source: Company data
Figure 2. Analyst risk assessment
Source: Author
Figure 3. Valuation summary
Source: Author
Figure 4. Earnings per share (EPS)
and dividends per Share (DPS)
Source: Author
Figure 5.Monte-Carlo – Sensitivity analysis on the Price target
Source: Author
Share price at 24th of April €153.26
High - Low (52 weeks) €223 - €116
Number of shares (Millions) 200
Market Capitalization €30 652
Index Dax 30
Ticker (Bloomberg) CON:GR
Continental Market Profile
Low Medium High
Share price at 24th of April €153.26
Target Price (FCFF) €167.45 Upside potential 9%
Target Price (FCFE) €153.93 Target Price (Multiple Valuation) €163.53
Valuation Summary 0 € 1 € 2 € 3 € 4 € 5 € 6 € 7 € 11 € 12 € 13 € 14 € 15 € 16 € 17 € EPS DPS 36.2% 29.5% -24.3% -5.8% -2.8% -0.7% -0.6% -100% 0% 100% Terminal Growth Sales Cost of sales Beta MRP Tax Rate Risk Free
2
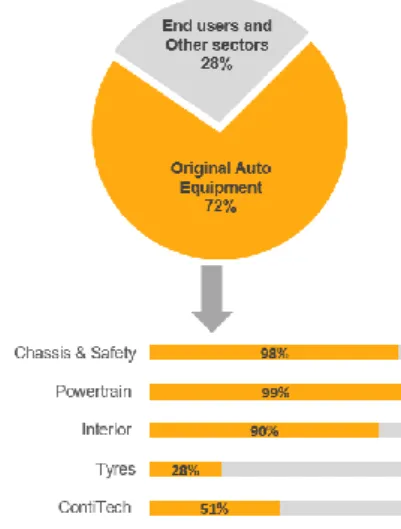
Continental AG (CON:GR) is one of the global players in the tyre and automobile Original Manufacture Equipment (OEM) industries. It was founded in 1871 in Hanover, Germany, as result of a merger between Continental-Caoutchouc and Gutta-Percha Compagnie, and, today is the parent company of the Continental group. In YE18, it had a workforce of 243,226 employees, spread around 60 countries (Figure 7), with a turnover close to € 44.4bn and a net profit of € 2.9bn.
The company entered in the DAX 30 index (German index for the 30 major companies) in 1996 and since then it was removed two times (2003 and 2008). In YE18, it had a market capitalization of € 24.3bn (vs. € 45bn in PY), representing 2.38% of the DAX 30.
Continental comprises 572 corporations (including non-controlling entities) and is divided into two segments: Automotive and Rubber, which are respectively organized under five divisions and 26 business units.
The Automotive group is responsible for 60% of Continental’s turnover
(Figure 8) and has grown 1.1% Y.o.Y. It manufactures original pieces for vehicles and its main clients are Daimler, FCA, Ford, Alliance and Volkswagen, which represents 80% of the Automotive group’s turnover. Raw materials (steel, aluminium, precious metals, copper and plastics) and electromechanical components are the main inputs in the production process, as they constitute 44% of total production costs. The Automotive group is divided into the following three divisions (% of 2018’s turnover of the Automotive group): Chassis & Safety (35%),
Powertrain (29%) and Interior (36%). The Chassis & Safety division develops and
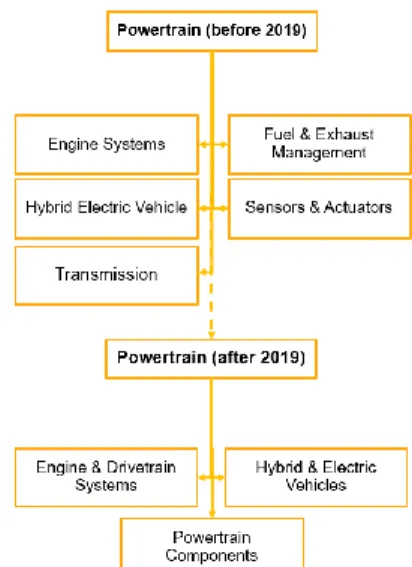
produces a vast portfolio of products in the field of electronic components for cars, namely hydraulic brakes, sensors, advanced driver assistance systems among other components. Their mission is to achieve a fully autonomous driving experience, creating the “Vision Zero” (an accident-free driving experience). This division is further divided into 4 Business Units (BUs) (Figure 9). The Powertrain division develops innovative and efficient solutions for powertrains, being a leader in the development of combustion engines, injectors, turbocharges, transmissions, actuators and other products. This division is one of the most volatile, since it’s highly exposed to the automotive electric transformation. The industry is currently undergoing a transformation, transitioning from traditional combustion to electrical batteries. Continental strategy for this division is not to pursue pure electric solutions until 2022, focusing in hybrid and combustion solutions, as the margins are very thin and capital investments are very high in the electric segment. Since January 2019, this division is divided into 3 BUs (Figure 10), as independent legal entities, to
2. Business Description
Figure 7. Continental’s presence
Source: Company data
Figure 8. Continental turnover YE18
Source: Company data
Figure 9. Chassis & safety division
organization
Source: Company data
Figure 10. Powertrain division
reorganization
Source: Company data
Automotive Group 60% € 26.8bn Rubber Group 40% € 17.6bn
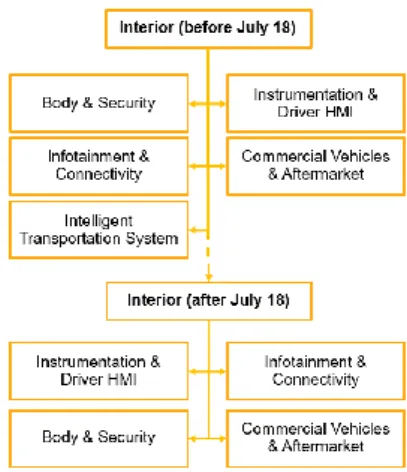
account for a possible partial IPO scheduled for the 2H2019. The Interior division is specialized in high technological automobile parts, including crucial hardware and software components. The demand for these components is rising due to the increase use of technology in the cars. This division tries to cooperate as close as possible with the business partners to understand the costumers needs. Since July 2018, it incorporates the latest acquisition (Osram GMBH), which contributed to its structural reorganization. It used to be composed by 5 BUs, but since December 2018 it changed to 4 BUs (Figure 11).
Rubber group has been historically the core and the most profitable business of
Continental (ROCE of 23.8% / 680 bps above company average in YE18). During FY18, this group represented 40% of total consolidated sales and produced 155 million tyres. Additionally, during 2018, this segment has been challenged by the rise of the price of raw materials, especially natural rubber and butadiene, as they are highly dependent on crude oil prices. Butadiene, a crucial input in the production of synthetic rubber recorded an increase of 60% in the 1H2018. This group is divided into two divisions (% of 2018’s sales of the Rubber group): Tyres (65%) and
ContiTech (35%). The Tyre division represents the biggest stake of Continental
revenues and employs the majority of employees (€11.4m, 26% of consolidated turnover / 23.6% of total workforce in YE18). By opposition to the Automotive group, its main market is the Replacement Equipment (RE) tyres, which represent 71.9% of total turnover, while the remaining sales are referent to Original Equipment (OE) tyres. Nonetheless, it’s a market leader in OE tyres suppliers, with a market share close to 33% in Europe. Its main clients are Audi, BMW, Ford, Jaguar, Volkswagen and many other top players from the Automotive industry. Furthermore, it tries to gain competitive advantage by maximizing safety through short braking distances with an excellent grip and reducing fuel consumption by minimizing rolling resistance. This division is composed by 5 Bus (Figure 12). ContiTech division is specialised in the development and manufacture of components made of rubber and plastics technology, offering a vast variety of functional parts, advanced components and systems made of different raw materials mainly rubber and plastic for plant engineering, mining, agriculture and auto sectors. It’s divided into 7 Bus (Figure 13), with a considerable managerial independence.
Figure 11. Interior division
reorganization
Source: Company data
Figure 12. Tyre division organization
Source: Company data
Figure 13. ContiTech division
organization
4
Continental is currently implementing a strategic reorganization to maintain its agility and flexibility due to the changing environment and the emergence of electric automotive segment. This reorganization started in middle 2018 and is forecasted to be fully implemented by the beginning of 2020.
The main feature is a new umbrella holding structure (Figure 14), which is going to organize Continental activity into: a new Automotive group, the Rubber group (unchanged) and the Powertrain, the latter as an independent group to facilitate a possible IPO. On top of this reorganization, the company is plaining to set up a research unit that will aggregate all research and development of the Automotive group, in order to gain synergies between those divisions.
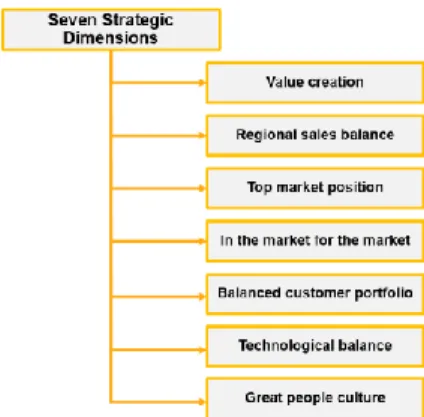
Continental has currently ongoing the Seven strategic dimensions for enhancing the value of the corporation on a sustainable basis (Figure 15). Launched in 2015, this document sets the main strategic long-term plan to
ensure sustainability. The cornerstone of this program is Value creation – This
objective has the aim to enhance value in the long run, in order to ensure sustainability for the company and trust for the shareholders. The financial target is to achieve a Return On Capital Employed (ROCE) of at least 20%. Since 2015, this objective has been always achieved or surpassed, except in FY18, when a ROCE was reported at 17% (Figure 16). The second objective is Regional sales balance (Figure 17), wherein Continental aims to reduce the exposure to specific market fluctuations. In YE18, it was still possible to observe a geographical concentration on Europe market, as it represented 49% (less 5% compared YE14). However, the benchmark is for Europe to account for less than 40%, compensated by the increase in American markets (between 25% and 28% in YE18) and Asia (between 30% and 22.2% in YE18). The third objective is to maintain a Top market position, among the three leading suppliers in all relevant markets, in terms of quality, customer focus and sales. This is a key success factor for the company sustainability and it was already accomplished in most of the sectors of the automotive supplier industry, tyre industry and in ContiTech division. The fourth objective is to be In the market for
the market. The company has a policy to work close to its customers, to meet the
costumers needs and to reduce transportation costs. Continental’s aim is for eight out of ten application developments to be carried out locally. In YE18, they were producing in 38 of the 60 countries in which they have a representation. Furthermore, it’s forecasted to increase the production in Asia to support the objective of a higher penetration on that market. The fifth objective is to maintain a Balanced customer portfolio by reducing Continental’s dependence on the original equipment automotive economy. In 2020, the objective is for the segments end users and other
sectors to amount for 40% (28% in YE18), (Figure 18). For that purpose, the
company invested in 3 branches: (1) in the tyre sector through the increase
3. Corporate Strategy
Figure 14. Continental umbrella
structure in 2020
Source: Company data
Figure 15. Continental long-term
corporate strategy
Source: Continental website
Figure 16. ROCE and CVC Evolution
Source: Company data
Figure 17. Geographical activity
breakdown
production capacity mainly toward the end customer business; (2) in the automotive end costumer sector via specific customer solutions and products and (3) outside the automotive industry both organically and by acquisitions. The sixth objective is
Technological balance. High technology markets have shown great potentials with
high growths, nonetheless they require significant capital expenditures. Currently, the portfolio is a combination of well stablished and pioneering technologies. In terms of advanced technology, Continental is one of the leading suppliers in auto parts (injection systems for low-consumption, supercharged diesel and many others), in the premium tire segment (top scores in neutral test, which meet the highest standards) and in industrial solutions from ContiTech. Moreover, Continental has the goal to deliver to the market, by 2025, fully autonomous driving systems, such as the Cube, a Continental Urban Mobility Experience system for driverless robots in taxis (Figure 19). The last objective is to develop a Great people culture. The company sees their employees as a key driver of success, thus ensures an atmosphere of trust, responsibility and organization, affecting positively firm’s productivity. Continental has multiple initiatives and programs to motivate employees and to help them to progress and to improve efficiency. During 2018, Continental made a survey to 50,000 employees, and 86% agreed and identified themselves with the firm values.
Possible IPO on Powertrain division
As part of the current reorganization, Continental announced a possible partial IPO for the Powertrain division in the second half of 2019. In the beginning of 2019, the Powertrain division was removed from the Automotive group and became a separate group of legal entities, to facilitate the possible IPO process. Additionally, Continental announced that it does not intend to become a purely electric firm in the short future, due to the challenging margins and high competition. This division is highly exposed on the electrisation of the industry, so this IPO would be in line with management’s strategic view. Furthermore, this is the division with the lowest ROCE of the group (3.3% in YE18 and 13.2% in YE17, versus 2018’s Group average of 17.0%), (Figure 20).
Figure 18. Continental YE18 sales in
OE & NOE
Source: Company data
Figure 19. Cube – Test drives
Source: Company website
Figure 20. Powertrain vs. Continental
historical ROCE
Source: Company data 20% 21% 20% 21% 17% -4% 14% 13% 13% 3% -5% 0% 5% 10% 15% 20% 25% 2014 2015 2016 2017 2018 Continental Powertrain division
6
Shareholders Structure
In 2008, the group Schaeffler1 made one of the biggest acquisitions in the industry
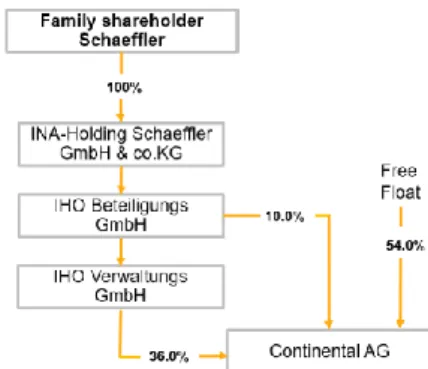
history by acquiring 75.1% of Continental. However, in 2011, it reduced its participation to 60.3%, as the debt from the acquisition was too high in the eyes of its shareholders. In 2013, a second adjustment was made, where the group Schaeffler reduced its share to 46% (Figure 21), justified by the necessity of reducing its leverage. Since the acquisition in 2018, the group Schaeffler is held under an umbrella organization, where INA-Holding Schaeffler GmbH & Co.KG (fully owned by the family Schaeffler) is the top holding. Currently, the group IHO (owned by the Schaeffler family holding company) detains 75.1% of Schaeffler and 46% of Continental (10% by IHO Beteiligungs2 and 35.9% directly by IHO Verwaltungs
GmbH).
As of 31 of December 2018, Continental AG’s authorized a capital stock amounted to 200mn shares listed on the DAX stock exchange (Table 1), wherein the group IHO retains 7.8mn (46%) and the remaining is free float (54%). Additionally, Continental has an Over The Counter (OTC) program in America through Continental’s American Depositary Receipts (ADRs). As of YE18, 7.2m ADRs were outstanding (ten ADRs are equivalent to one share).
Dividend Policy
The group has a floating dividend policy and a historical pay-out ratio between 15% and 33%. Since 2011, both the dividends and the pay-out ratio have been constantly increasing up to € 4.75/ sh, which corresponds to a 32.8 % pay-out ratio (Figure 22). Nonetheless, this increase doesn’t put the capitalization of Continental in risk, as they have a solid capitalization shown by its increasing equity ratio at 45.3% (vs 43.5% in FY17).
Corporate Governance
Continental’s corporate governance follows a two-tier model: with an executive
board and a supervisory board. Furthermore, Continental’s main corporate
governance principals are expressed into the internal Governance Code (GC) (named BASICS), which closely follows and derives from the German GC.
1 The group Schaeffler was founded in 1946 and currently is one of the major players in the Automotive manufacture sector, competing with Continental in automobile segments. It has a workforce of 92,478 employees and a turnover of €14.2bn at YE18.
2 IHO Beteiligungs is wholly owned by IHO Verwaltungs GmbH.
4.
Management and Corporate Governance
Figure 21. Simplified shareholders organogramSource: Schaeffler Annual Report
Table 1 –Continental’s main Shareholders
Source: Thomson Reuters
Figure 22. Dividend and pay-out ratio
evolution
Source: Company data Main Shareholders (Top 5) % of ownership Schaeffler (Maria Elisabeth) 46,00% Harris Associates L.P. [Activist] 4,99% BlackRock Investment Management (UK) Ltd. 3,07%
The Vanguard Group,
Inc. 1,52%
DWS Investment GmbH
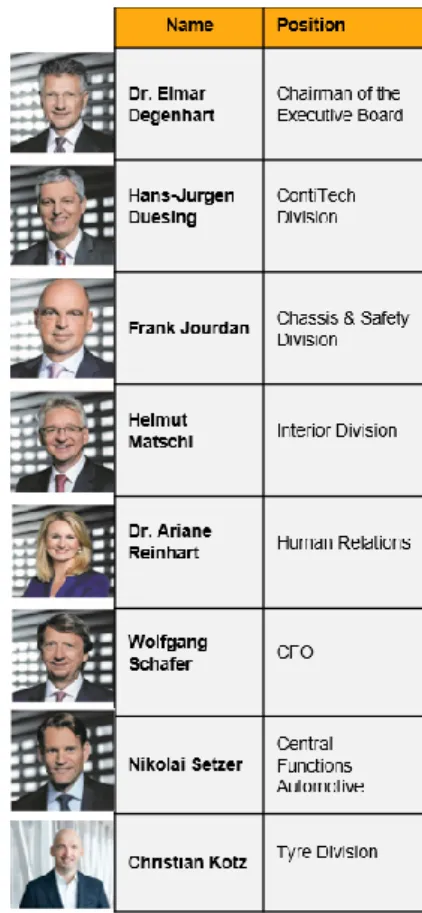
The Executive board has the sole responsibility of managing Continental and is composed by a team of 8 skilled and experience directors (Figure 23 and in detail in Appendix 12) that provide stability and a clear view of its objectives. Dr. Elmar
Degenhart, Chairman of the group since 2009 and with more than 20 years of
experience in management currently leads the executive board. Wolfgang Schäfer,
member of the Executive board, is the CFO among other responsibilities and has
also a vast experience in this industry. Moreover, the executive board is currently composed of six more directors, all committed to the current corporate management strategy.
The Supervisory board headed by Prof. Dr-Ing Wolfgag Reitzle (Figure 24) is responsible for appointing and supervising the Executive Board. It is composed by 20 members, half appointed by the shareholders during the annual shareholders meeting and half by the employees. More than 60% of the members of the board are independent members. Furthermore, it supports the Executive Board in strategic decisions by having regular meetings (4 ordinary and 2 extraordinary in 2018). Lastly, this board has four additional committees: The Chairman’s committee,
which is responsible for preparing the appointment of the Executive Board; the Audit
committee, in charge of auditing the financial accounts, risk management and
compliance; the Nomination committee, responsible to nominate suitable candidates for the Supervisory Board and the Mediation committee, which is only assembled in the case of no consensus in the appointment of the new Executive Board.
To ensure its “outstanding” reputation and the trust from its clients, the company has a 3 Pilar Compliance Management System (CMS): (1) Prevention, through mandatory compliance trainings; (2) Detection, supported by anti-corruption and audit committees and (3) Response, to implement consequences when breaches are found.
All in all, according to Reuters Environmental Social and Governance (ESG) scale, Continental achieves a very good overall score (A), having only a negative point on controversies (D+), (Table 2). Recently, in February 2018, Continental was fined by the European Union a total of € 151m along with Bosh and NGK for cartel practices in the spark plug market and by discussing prices of brake systems with Bosh.
Corporate Social Responsibility (CSR)
Continental is very clear in its commitment towards all stakeholders, as they are the cornerstone for firm sustainability. This important role is under Dr. Ariane Reinhart responsibility, she’s the head of HR and Sustainability department and also member of the Executive Board. She coordinates all CSR strategy, in which Continental has the following areas of impact:
Figure 23. Executive board
composition
Source: Company data
Figure 24. Chairman of the
supervisory board
Source: Company data
Table 2 – Continental’s ESG classifications (scale from
A+(highest/best) to D- (lowest/worst))
Source: Thomson Reuters
Environment Pillar Score A Social Pillar Score A Governance Pillar Score
A-ESG Score A
ESG Controversies Score D+
8
Sustainable Product Portfolio Quality, Continental is fully committed to provide
trustful and sustainable products, examples include the new Hybrid solutions, the “super clean” diesel components and the new EcoContact 6 tyre (with 20% longer lifetime and 15% less fuel consumption than last generation, Figure 25).
Workforce Interest and Human rights, the company considers their employees as
the key resource to achieve its goals. Therefore, the company ensures that all employees have: equal gender rights (objective of reaching 25% of female managers by 2025, Figure 26); a personal development program (Continental was recognized by the ISO 29990 by TÜV Nord in Germany) and all working places follow the United Nation Guidance Principles on Business and Human Rights regardless the location of work.
Lastly, in terms of the Environment, the company has a global Environment, Safety, Security, Health and Fire protection (ESSHF) policy. Currently the main goals are the reduction of waste generation, CO2 consumption and energy used by 20% in YE20 (vs YE13). However, this is very unlikely to be achieved, since waste generation increased by 13%, CO2 reduced by 5% and energy used reduced by 3%, in YE18 vs. YE13.
Figure 25. Eco contact tyre 6
overview
Source: Company data
Figure 26. Women in management
positions
Worldwide macroeconomic slowdown
2017 and 2018 were very positive years concerning global economic expansion (GDP growth of 3.8% and 3.6% Y.o.Y), however according to the latest report of IMF (2019), the Global Economic Outlook will suffer a slowdown (-30bps in 2019 compared to the PY), which has been intensifying overtime. In October 2018, the projections of GDP growth for YE19 were standing at 3.7%, however they were downgraded by 20bps down to 3.5% in January 2019 and currently stands at 3.3% (April 2019). For YE19-YE24, GDP growth is foreseen to be stable featuring a thin rise in YE24, (Figure 27).
The key factors for this slowdown are political uncertainties, the ongoing trade wars and consumer confidence ease. Worldwide inflation is expected to be stable in the time window under analysis featuring a 10bps drop each 2 years until YE24.
In the Eurozone, GDP is expected to grow at 1.3% for YE19 (110 bps lower than
2017), followed by a rise of 20bps in YE20 (Figure 28). This loss of momentum is justified by the political uncertainty, industrial slowdown, effects from trade tensions and social problems (such as the Yellow Vests Protest in the France). Labour market is expected to tighten thanks to the lowest unemployment rate (7.7% according to Eurostat, March 2019). Lastly, inflation continues below the target levels defined by ECB (2%) and is forecasted to fall by 50bps down to 1.3% in YE19, followed by a smooth recovery.
United States’ GDP growth continues with a significant gap compared with the main
countries in Asia (3.7% in 2018) and is foreseen to start slowing down 50bps already in YE19 after posting a good performance in 2018 (GDP grew 2.7% Y.o.Y, Figure 29). From YE19 until YE24, a continuing ease of the growth is expected reaching 1.7% in YE24. The key factors were the imposition of tariffs with US major trading partners, the decrease of the effects from US fiscal policy and the deterioration of the trade deficit, taking into consideration the rise of imports.
Emerging and developing Asia continues to be the geographical area with the
highest economic expansion. It’s GDP is expected to grow by 6.3% in YE19 followed by an ease of 20bps until YE24 (Figure 30). The two main emerging economies in this economy are: China, which recorded the slowest pace in the last 28 years (6.6% in 2018), due to the current trade war, the increase in financial regulations and the lower global demand; and India, which is growing at a higher rate than China since 2014. The momentum in India is not expected to vanish and the gap between China and India should wide until YE24 where it should account for 220 bps.
5. Macroeconomic Overview
Figure 27. Worldwide GDP growth
Y.o.Y and inflation growth
Source: IMF estimations (March 2019)
Figure 28. Euro zone GDP growth
Y.o.Y and inflation growth
Source: IMF estimations (March 2019)
Figure 29. United States and
emerging and developing Asia GDP growth Y.o.Y.
Source: IMF estimations (March 2019)
Figure 30. China and India GDP
growth Y.o.Y.
Source: IMF estimations (March 2019) 2,7% 2,9% 3,1% 3,3% 3,5% 3,7% 3,9% GDP Growth HICP 0,0% 0,5% 1,0% 1,5% 2,0% 2,5% 3,0% HICP GDP Growth 0% 1% 2% 3% 4% 5% 6% 7% EDA GDP US GDP 5,0% 5,5% 6,0% 6,5% 7,0% 7,5% 8,0% China GDP India GDP
10
Disappointing short-term perspectives for the Tyre Industry
The Tyre industry is characterized by a mature market stage, with high barriers, which leads to a high market concentration. In fact, the five biggest players account for half of the market.
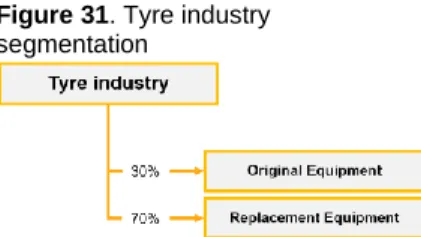
The Tyre industry is divided into two segments (Figure 31): Original Equipment
(OE) Tyres and Replacement Equipment (RE) Tyres. The OE represents 30% of
the total industry and is almost perfectly correlated with the automobile demand (it has a 3-year historical CAGR of 3.92%, Figure 32) and with the GDP growth (in US it was shown a 78% correlation - Bryan and Garnier, 2017). Nonetheless, the largest segment is the RE (represents 70% of the industry), a less cyclical segment, shown by the weaker correlation with economic environment (it has a 36% correlation with the US GDP growth - Bryan and Garnier, 2017) and is less affected by factors related Automotive industry.
Historically, the Tyre industry has shown a very good performance linked to the increase of automotive park, in which tyre volumes were forecasted to grow at a CAGR of 3.4% between 2017 and 2022, (Figure 33). Nonetheless, in the beginning of 2019, new figures pointed to a possible slowdown in the Automotive industry, which directly impacted the OE segment. All in all, the currently outlook point to a flat market in YE19 and a 40bps decrease in CAGR between 2017 and 2022 compared to the previous estimates (Figure 33).
Automotive OE manufacter - shrinking industry
This industry provides all types of auto-parts, from software to mechanical systems. It’s positioned in the middle of the supply chain (between the producers of raw materials and the final car makers), and it has as main costumers the main auto brands, such as FCA, PSA, Alliance, among others.
Historically, this industry is more volatile and presents higher growth rates, compared to the Tyre industry, from 2010 to 2017, it recorded a CAGR of 3.6%. However, the year 2018 shown to be a disappoint, considering that was the first year that the industry shrunk since the crisis of 2008 (Figure 34). Furthermore, the outlook for 2019 is currently pointing between a flat market to a drop of 2% and Moody’s downgraded the automotive outlook from stable to negative.
It’s an industry in a transformation stage due to the current emergence of electric cars, in fact the electric segment is foreseen to grow at a CAGR of 25% from 2018 to 2022 (Figure 35). Despite, the double-digit growth on the electric segment, operate on this segment implies higher production costs (an electric car cost on average more $12k to produce compare to a combustion car, Mckinsey, 2019), high R&D requirements and capital investments. Nonetheless, the outlook is favourable for electric car production costs, where costs are expected to fall by $6k until 2025,
6. Industry Overview and Competitive Positioning
Figure 31. Tyre industrysegmentation
Source: Continental annual report 2018
Figure 32. Automotive demand,
forecast before 2018 (in million units)
Source:The international Organization of Motor
Figure 33. Forecasted global sales
volume of Tyres (in billion units).
Source: Smithers Rapra, Continental
and student calculations
Figure 34. Automobile production (in
million units)
Source: The International Organization
which will make this segment more attractive. In YE2018, the three main OEM suppliers represented 11.8% of the industry, in which Robert Bosch was the leading firm with a turnover of € 45bn; followed by Denso (€43.1bn) and Continental (€ 40bn).
Political instability and decentralization of powerplants
Traditional players are based in developed regions, mainly Europe and the U.S., reions with a stable economy, usually with political stability and backed by resilient economies. Nevertheless, the tyre manufacturers are being attracted towards the developing markets, such as India and China, due to the rise of the Asian markets and to the decrease production costs.
The current political panorama of escalation of protectionism in the main geographies of the industry is currently threating the industry. The main impacts to the industry are caused by: the US trade war with China, where they imposed bilateral-tariffs burdens on imports of essential goods for industry production (natural rubber, synthetic rubber among other products; the US trade war with UE, concerning steel and aluminium; and the Brexit, which will negatively impact Europe economic growth. Overall, the political environment is expected to enhance the costs in production, challenging the industry profitability.
Premium Tyre segment, the niche of traditional companies
To maintain their bargaining pricing power, innovation has become vital for traditional players. It also allows them to rise prices without having a significant deterioration of the demand. It passes by providing new features, recently they have been related to the enhance of security, raising expected lifetime of the tyres or reduce the ecological footprint. One example of innovation in the sector are the tyres that seal punctures until 5mm, not necessitating to either immediate stop or do a roadside tyre change (Figure 36).
Additionally, the integration of technology into tyres is a cornerstone for companies to move into the premium segments, which are expected to grow at 7% (2016-2020). Moreover, R&D investments in the powerplants reduce production costs, resulting into improvement of operational productivity. Between YE10 and YE18 it allowed to improve operational productivity by 18% on average.
Environmental and Sustainability awareness
Tyre and auto parts manufacture involves the utilization of many chemicals, which leads to potential environmental hazards and large amounts of hazardous air pollutants. Efforts have been made towards the decrease in waste by dismantling and recycling of End-of-Life Vehicles (ELVs), which has increased by 5% from 2011 to 2016 (Figure 37). Also, in response to the demand of car manufacturing clients, tyre producers make regular improvements on the rolling resistance, which is responsible for: 4% of total CO2 expected emissions in 2025 and 20% of fuel consumption.
Figure 35. Electric car fleet outlook (in
million units)
Source:future fuel strategies
Figure 36. Contiseal – from Continental AG
Source:Continental
Figure 37. ELV, reuse, recycling and
recovery (in %) Source:Eurostat 54 78 92 107 108 0 20 40 60 80 100 120 2018 2019 2020 2021 2022
12
Consumer preferences are moving towards more ecological segments, due to the increase of environmental awareness. Traditional tyre players are especially careful with the change in social conscious, as they are highly dependent on consumer loyalty. New regulations in the EU regarding tyre industry will increase transparency trough new labelling requirements, allowing the costumer to better understand the product characteristics through standardized and user-friendly measures.
Key Drivers
The main driver of the tyre industry is automobile demand, which have been performing historically well (4.4% CAGR in the last 3 years), backed both by the premium segments, such as the Medium and Heavy Commercial Vehicle (MHCV) and by the rise of the car parking in emerging economies, due to the strong growth of these economies. These two segments have shown up to double digit growth in the last years. Nonetheless, in 2018, the global automobile demand started to fall and by the end of 2018 there was reduction of volume by 1m units instead of expanding by 2.5m units, as previously forecasted.
On the other side, the segment of RE tyres is less correlated with the automotive industry and influenced by other factors like the number of cars in circulation and the life expectancy of tyres. Improvements in rubber quality and better road conditions have increased the average tyre life expectancy up to 30,000 km for automobiles leading to a decrease in replacement turnover. However, mitigated by the fact that cars are driven more frequently, which increases the rotation of replacement tyres to 2.2 years.
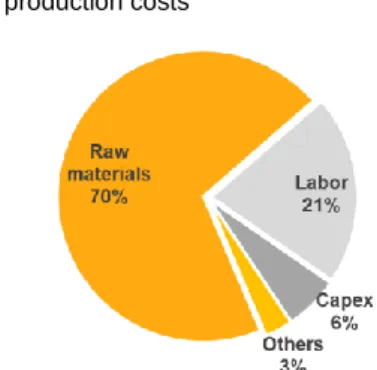
The main drivers of costs for tyres are raw materials (mainly natural rubber and
synthetic rubber) and labour (Figure 38). Natural rubber is obtained from rubber trees, which require warm climates. Synthetic rubber can be produced from petrochemical feedstock with crude oil as the main input. Accordingly, an increase in the oil price leads to a rise on synthetic rubber costs, which increases demand for natural rubber and makes tyre production more expensive.
Peer Analysis Tyres
The companies most representative of the Tyre and Rubber Industry, ordered by sales at YE18 were: (1) Bridgestone (€ 30.4bn); (2) Michelin (€ 22bn); (3) Goodyear (€ 13.9bn) and (4) Continental (€ 11.3bn).
In 2004YE, the main 3 tyre manufacturers (Bridgestone, Michelin and Goodyear) accounted for 54% of the total market, whereas in 2017YE their market share reduced to 38% (Figure 39 and 40). This reduction was due to the entry of new players from emerging countries and the economic expansion of the Asia and Pacific region.
The traditional players are investing in a product differentiation strategy, focusing on brand recognition, product quality and safety. This increases customer loyalty through more reliable and above-average products, which is reflected in higher
Figure 38. Breakdown Tyre
production costs
Source: Bryan, Garnier & Co ests
Figure 39. Market share of the 3 main
Tyre industry players in 2004
Source: Companies data
Figure 40. Market share of the 3 main
Tyre industry players in 2017
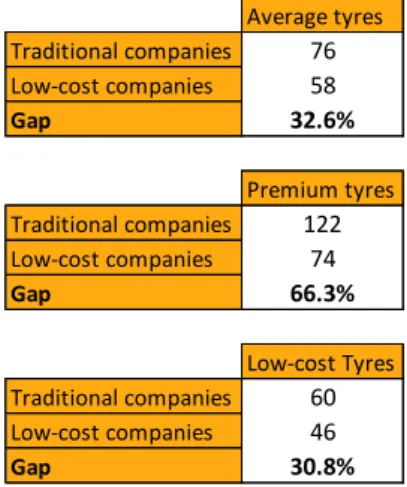
Average Selling Price (ASP) 31% above to the low-cost companies (Table 3). Therefore, to protect gross margins of 30%, traditional players are moving towards premium tyre segment, where product quality is in high demand.
By opposition, the low-cost players follow a cost efficiency strategy, which allows them to deliver products at an ASP of € 58 and still be profitable. Low-cost companies have an average gross margin of 21.9%, due to their light cost structure, low production costs in emerging economies. Additionally, these companies tend to produce tyres with a smaller percentage of natural rubber, and higher percentage of by synthetic rubber, at the expense of overall product quality.
Porter’s Five Forces – Tyre industry (Figure 41) Competition within the industry (High)
The industry has a considerable concentration, with the five biggest companies representing half of the market. Product differentiation is low, translating into high competition and thigh margins. Companies attempt to gain advantage over competitors by investing in other parameters such as performance, reputation and customer service. Additionally, the decrease of demand caused by the decline of the automotive industry and the emergence of low-cost Asian competitors, imply a higher competition compared to the past. Consequently, firms need to fight for market share, where traditional players invest in product differentiation and client loyalty, while low-cost companies compete on price. Overall, all these factors contribute to a high level of competition within the industry.
Bargaining Power of Buyers (Moderate)
As previously mentioned, the costumers of OE segment are chiefly groups operating globally and subsequently contracting very high orders, which allows them to have significant bargaining power over the suppliers. Additionally, on the RE tyre market, large retail chains are able also to put pressure on prices when buying in larger quantities. However, the main Tyre companies have as a very significant dimensioned, which partially offsets the bargaining power of buyers. Overall, the low switching costs to change between different tire brands, result in a moderate bargaining power.
Bargaining Power of Suppliers (High)
The manufacturing and processing of both natural and synthetic rubber is dominated by a few large world players. Hence, the Organisation of the Petroleum Exporting Countries (OPEC) have a significant control on the production of natural rubber and petroleum, which translates in high bargaining power of suppliers. Tyre production is highly sensitive to price fluctuations of rubber and other petroleum derivatives since its production depends heavily on those raw materials, (Figure 42). To mitigate the dependence of these few suppliers of raw materials, some manufactures have
Table 3 - Comparison of retail Tyre
prices, 2017 (€ including VAT)
Source: Bryan Garnier & Co
Figure 41. Porter’s 5 forces Tyre industry Source: Author Average tyres Traditional companies 76 Low-cost companies 58 Gap 32.6% Premium tyres Traditional companies 122 Low-cost companies 74 Gap 66.3% Low-cost Tyres Traditional companies 60 Low-cost companies 46 Gap 30.8%
14
started to perform backward integration, as in the case of Goodyear, where the company produces a part of its rubber needs.
Threat of New Entrants (Low)
The industry has high entry barriers requiring large capital investments and R&D expenses. Most tyres are relatively undifferentiated, obliging firms to produce in large quantities to achieve economies of scale. High capital expenditures are required, leading to a challenging environment for new entrants to match the scale of the existing producers. Furthermore, a substantial amount of R&D is required to develop and test new tyre models, whose approvals are difficult and costly to get due to strict legal and safety regulations. Also, brand recognition makes it difficult to enter in the market with an unknown product, contributing to a low threat of new entrants.
Threat of Substitutes Products (Low)
There are no viable substitutes for tyres. However, the current environmental awareness might lead to an increase of the usage of public transportation and car sharing, which would negatively affect the number of vehicles in circulation, leading to a decrease in demand for tyres. Additionally, counterfeit tyres have a small market share. It’s forecasted that they represent € 1.8bn per year in Europe, bearing low expectations of growth, therefore, they do not represent a significant threat for the industry.
Porter’s Five Forces - Automotive OE industry (Figure 43)
The competition within this industry is very high, due to the fall of demand, current electrification and CO2 limitation. It’s considerably less concentrated compared to the tyre industry, as the three main individual companies hold 11.3% of the market (value 3 times lower compared to the tyre industry). Nonetheless, M&A activity is quite active, leading to an increase of concentration.
It’s an industry where the majority of the costumers are individuals, not having much bargaining power. However, the switching costs are quite low leading to with moderate bargaining power towards buyers.
Regarding the bargaining power of suppliers, the Automotive industry faces the same challenge as the Tyre industry, previously described.
The threat of entrance of new players is high, considering the emergence of electrical cars. Therefore, new players from specific electric fields will enter with competitive advantages from technology and the know-how.
Based in the transformation stage of the industry, the OEM suppliers expect a high threat of substitute products and try to mitigate with high investments in R&D so they don’t become obsolete.
Figure 42. Crude oil ($ per barrel) and
natural rubber ($/Kg) evolution
Source: Bloomberg
Figure 43. Porter’s 5 forces Automotive OE suppliers’ industry
Table 4 – Continental’s SWOT analysis
16
We estimate a target price of €167.45/sh for Continental at 2019YE and a respective HOLD recommendation, based on a upside potential of 9% compared to Continental share price at 24th of April 2019 and a medium risk assessment, (Table 5).
Continental is a worldwide market leader both in the Automotive OEM and in the Tyre industry, currently operating in a challenging market environment with a negative outlook in the near future, due to the downturn of the automotive industry (expected to be flat in FY19). Nonetheless, Continental benefits from a resilient financial profile and a significant growth in the tyre market (2.1% for FY19).
Earnings forecasts
Continental is foreseen to continue posting recurrent profitability, in line with the last decade, however FY19 is forecasted to follow the deterioration of operating profitability seen in 2018 and drop it by 13% (vs. PY). From 2020 to 2023, the firm is expected to recover the momentum seen last years and grow at a 4.7% CAGR, mainly as result of the positive outlook for the industry in the long term. Furthermore, Continental’s financial profile continues solid, where net debt to EBIT is expected to as per the 3 previous years and turn negative in 2021, (Figure 44) 3.
With a light financial cost structure, Earnings Per Share (EPS) are expected to follow operating profitability and decrease by 14% in 2019 down to €12.3/ per sh. This represents a drop 11% higher comparing to YE17-YE18 evolution, explained by the higher effective tax rate at 27% (vs. 23% in 2018), where Germany marginal tax rate stands at 30%. Nonetheless, Dividends Per Share (DPS) are not expected to suffer an impact and continue in line with Continental strategy, growing from € 3.5 per share / 27% pay-out ratio in 2015 up to € 6 per share / 38% pay-out ratio in 2023, (Figure 45 and 46).
Valuation methods
The TP of €167.45/sh was achieved through an intrinsic valuation, based in a DFC method and a FCFF perspective. It was also supported by a relative valuation, which led to a TP of €163.53/sh. Additionally, it was also performed a DFC valuation through a FCFE perspective, which resulted in a TP slightly more conservative at €153.93/sh. Lastly, the consensus (based in 28 analysts of Reuters), also pointed for a hold recommendation, (Table 6).
3 Please note that IFRS 16 impacts were not considered to allow comparability
between the different years.
7. Investment Summary
Table 5 – Valuation summarySource: Author
Figure 44. Operating profit and net
debt to EBIT (without the impact of IFRS 16)
Source: Author
Figure 45. Continental’s earnings per
share (EPS) and dividends per Share (DPS)
Source: Author
Figure 46. Continental’s earnings per
share (EPS) and payout Ratio
Source: Author
Share price at 24th of April €153.26
Target Price (FCFF) €167.45 Upside potential 9%
Target Price (FCFE) €153.93 Target Price (Multiple Valuation) €163.53
Valuation Summary 0,0x 0,2x 0,4x 0,6x 0,8x 1,0x 3 000 € 3 500 € 4 000 € 4 500 € 5 000 € Operating profit Net debt to EBIT
0 € 1 € 2 € 3 € 4 € 5 € 6 € 7 € 11 € 12 € 13 € 14 € 15 € 16 € 17 € EPS DPS 20% 25% 30% 35% 40% 45% 11 € 12 € 13 € 14 € 15 € 16 € 17 €
Key Investment Risks
Investors should be aware that Continental is exposed to market, operational, legal and political risks. To access these risks, it was performed a risk analysis, in which the most relevant ones were analysed individually. It was also performed a complementary analysis through a Monte-Carlo simulation (Figure 47), where it was verified the sensitivity of the most important variables towards the target price. It was concluded that the terminal Growth is the most sensitive variable, having a correlation of 36.2%, followed by the activity of continental, with a correlation of 29.5% and COS, with a negative correlation of 24.3%. (Figure 48).
Table 6 – Reuters consensus (scale 1-sell to 5-buy)
Source: Thomson Reuters
Figure 47.Monte-Carlo simulation on the target price of Continental
Source: Author
Figure 48.Monte-Carlo – Sensitivity analysis on the Price target
Source: Author
Opinion Number of analysts
Buy 6 Outperform 2 Hold 17 Underperform 2 Sell 1 Average 2,64 Hold 0 1000 2000 3000 4000 5000 6000 € 0,00 € 70,40 € 177,45 € 284,50 € 391,56 Fr eq u en cy Target Price 36.2% 29.5% -24.3% -5.8% -2.8% -0.7% -0.6% -100% 0% 100% Terminal Growth Sales Cost of sales Beta MRP Tax Rate Risk Free
18
As previously stated, two types of valuation were used to assess the equity value of Continental AG: an absolute valuation through a DFC model trough two different perspectives (FCFF and FCFE) and a relative valuation through market multiples. The absolute valuation was chiefly driven by the following variables:
Revenues
Continental has a unique business model, positioned as a global player both in the OE automotive market and in the tyre and rubber market. The forecast of its activity was based in the sum of all segments, adjusted for consolidation effects. It’s worth noting that they were based on a critical analysis of the outlook provided by internal analysis from Continental, (Figure 49).
The Automotive segment of Continental is foreseen to suffer a slowdown in 2019, however not as severe as its industry. To compute its growth, it was used the data provided by Continental in the short term and converged to the GDP of the different regions in the long run. Geography wise, it’s forecasted a thin decrease of activity specially in Asia (area that was performing above average in the last years), but generalized throughout all geographies. For YE20-YE23, it’s expected a recovery of the sector that will reflect positively in Continental, (Table 7).
Table 7 – Revenues forecast in € M (Automotive segment)
Source: Author
On the other hand, the tyre segment is less cyclical, foreseen to grow at a 2.1% CAGR in YE19, followed by gain of momentum until YE23 (CAGR of 3%). Its revenues were computed through the multiplication of the volume of tyres for each geography with the ASP of Continental’s tyres. Lastly, it was maintained the same percentage between OE and RE in 2018 (28/72 respectively), considering its low historical range in the previous 5 years, (Table 8).
Table 8 – Revenues forecast (Tyre segment)
Source: Author
Net sales forecast 2016 2017 2018 2019F 2020F 2021F 2022F 2023F
Automotive Europe 12 311 13 100 12 784 12 784 12 912 13 041 13 172 13 369 America 6 402 6 683 6 286 6 292 6 355 6 482 6 612 6 777 Asia 5 171 5 881 7 430 7 392 7 540 7 691 7 845 8 002 Others 739 1 069 537 536 539 544 555 572 Total Automotive (€M) 24 622 26 734 27 036 27 005 27 346 27 759 28 183 28 720
Net sales forecast 2016 2017 2018 2019F 2020F 2021F 2022F 2023F
Tyres (M un) Europe 71 72 81 82 84 86 88 90 America 37 37 38 38 39 40 41 42 Asia 30 32 17 18 18 19 19 20 Others 4 6 9 10 10 10 10 11 Tyres ASP (€) 75 78 78 79 80 81 82 83 Total tyre (€ M) 10 717 11 326 11 352 11 690 12 077 12 489 12 967 13 520
8. Valuation
Figure 49.Continental’s revenues evolution 2016-2023F (in M) Source: Author -10 000 € 0 € 10 000 € 20 000 € 30 000 € 40 000 € 50 000 € 60 000 € Consolidation ContiTech Tyres Automotive
Despite, ContiTech belong to the Rubber and Tyre group, historically its revenues do not follow the same trend of the Tyre segment, thus, it was treated separately. Regarding its performance, it’s foreseen to follow the average activity of Continental and suffer a drop in 2019 followed by a recovery until 2023.
Lastly, Continental’s consolidated sales forecasted resulted from the sum of these three segments, adjusted for consolidation effects (to neutralize intra-group activity), (Table 9 and 10). The consolidation effects were computed as a fix percentage of its weight in total consolidated sales (3-year average, 9% of consolidated sales).
Table 9 – Revenues forecast (ContiTech and total sales)
Source: Author
Main costs (Cost of Sales and R&D)
COS is the main cost of Continental, representing 80% of total operating costs and showing significant stability in recent years. Thus, it was assumed a constant percentage of sales. Additionally, this item is chiefly driven by the raw materials price (represents 61% of total COS), which is forecasted to have a slight increase in 2019, however mitigated by the reduction of labour costs, inherent from the decentralization of the production in Germany.
R&D represent the second most important cost in the structure of Continental. The company has a strict cost control policy, therefore, in 2019 Continental expects that R&D will grow by 10bps up to 8% of Sales, however it’s also foreseen to slightly decrease in the years afterwards, due future synergies by the aggregation of all R&D business units.
Capex & acquisitions and D&A
Continental has the goal of maintaining the Capex below 8% of total sales. From 2019 until 2023 it was forecasted that the capex would continue its trend and grow at a CAGR of 6.6%, (Figure 50). During 2018, the main expansion Capex was used to build new factorings in Thailand and to expand the factorings both in China and Portugal (Figure 51), countries with lower labour costs in comparison with Germany. Additionally, the company was also set-up two new factories and expanded one other in the U.S.A.
Concerning acquisitions, they have been growing at a higher rate, which was reflected in the forecasts (CAGR of 10%). During 2018, the main acquisition was The Tyre and Auto Pty Ltd in Melbourne, Australia for a total of €223m (100% of the capital), which is a Tyre and OE manufacture with 1,200 employees.
Net sales forecast 2016 2017 2018 2019F 2020F 2021F 2022F 2023F
Contitech Europe 2 731 3 061 3 009 3 009 3 039 3 070 3 100 3 147 America 1 420 1 562 1 780 1 782 1 800 1 836 1 873 1 919 Asia 1 147 1 374 1 154 1 148 1 171 1 195 1 219 1 243 Others 164 250 401 401 403 407 415 427 Total ContiTech (€M) 5 463 6 246 6 345 6 340 6 413 6 507 6 606 6 737 Total Consolidation (€M) (252,2) (296,6) (328,7) (358,3) (390,5) (425,7) (464,0) (505,7) Total sales (€M) 40 550 44 010 44 404 44 677 45 445 46 328 47 293 48 470
Table 10 – Summary of Continental consolidated sales in 2018 and 2019F (in €M)
Source: Author
Figure 50.Continental’s CAPEX
evolution 2016-2023F (in M)
Source: Author
Figure 51.Continental factoring in Lousado, Portugal (extension of €100m ongoing).
Source: Website: Revistadospneus.com Sales forecast 2018 2019F Automotive 27 036 27 005 Tyre 11 352 11 690 ContiTech 6 345 6 340 Consolidation (328,7) (358,3) Total sales 44 404 44 677 500 € 1 500 € 2 500 € 3 500 € 4 500 € Capex
20
Depreciation and amortization rates were assumed as an average of the last 3 years of historical rate, considering its stability shown in the past. All in all, its foreseen an expansion capex around 20% between YE18 and YE23.
Working capital (WC)
WC is expected to continue to increase, as per the majority of the previous years, meaning that is expected for current assets to grow more than current liabilities. This is justified in the short term by the higher intake of Raw materials made by Continental which resulted in above average levels of storage and by the increase of activity. The main items, which impact the working capital are: Trade account receivables, which were computed through an historical percentage of sales; Trade account payables and inventories, which were calculated through accounting ratios, considering its average stability.
Debt profile
Continental benefits from a significant diversification of debt, (Figure 52), and comfortable access to the market in case of need. Additionally, in YE18, it had € 3.5bn of committed undrawn lines, which represents 8.5% of total Balance sheet. Overall, debt has shown a reducing historical trend, which is expected to continue in the future (in YE21 net debt is expected to turn negative, Figure 53).
From 2019 to 2023, Continental debt followed the evolution in the Figure 54, where it was considered the following assumptions: (1) Bonds were expected to roll over until 2021, after that no more bonds were forecasted to be issued, considering the levels of cash at that time; (2) the Revolving Credit Facility (RCF) historically has very low utilizations, being used mostly as an committed undrawn liquidity, thus no more draws were assumed; (3) Other bank lines and overdrafts are only short term debt and likely to be renewed every year; and (4) other debt, which is 59% commercial paper, was also assumed to be renewed.
Weighted average cost of capital
The WACC was calculated taking into consideration the geographical distribution of the cashflows from Continental. Thus, with resource to Damodaram data base, the Market Risk Premium (MRP) was calculated for Europe, America and Asia, leading to an average MRP of 6.8%. The rational of the cashflow distribution was also applied for the Risk Free (RF) rate and based in the German, United States and China 10 Year bond, it was achieved an average RF of 1.38%.
Beta Leverage was settled at 0.78, following the pureplay method, as follows: (1) The beta unleveraged resulted of a weighted average of the betas of the industries where it operates and (2) it was passed to beta leveraged featuring the capital structure of Continental and its effective tax rate. Additionally, two more methods were use as complementary analysis (regression method and Blume adjustment), all the three methods recorded a very low range between them: 0.07.
Figure 52.Continental’s debt
composition in YE18 (M€ and %)
Source: Author
Figure 53.Continental’s net debt evolution (in M, 2016-2023)
Source: Author
Figure 54.Continental’s debt evolution (2019-2023)
Source: Author
Table 11 – WACC FY19 summary
Note: The WACC have a small variation
in the different years of the valuation, as result of a dynamic tax rate, which is expected to rise from 27% in FY19 up to 29% in FY23. Source: Author 157 3% 1 900 41% 1082 24% 1468 32% Syndicated facility (RCF) Bonds Other Bank Facilities Other Debt -5 000 -2 500 0 2 500 5 000 Net debt 0 € 1 000 € 2 000 € 3 000 € 4 000 € 5 000 € 2019F 2020F 2021F 2022F 2023F Other Debt
Other Bank Facilities Bonds Short term Bonds Medium & Long term
WACC 2019F
Risk Free (RF) 1.38%
Beta Levered (BL) 0.78
Market Risk Premium (MRP) 6.8%
Cost of Equity (RE) 6.7%
Cost of debt (RD) 5.9%
Tax rate 27.0%
Cost of Debt after taxes 4.32%
E/EV 0.9
D/EV 0.1