114
Copyright © 2015 by Academic Publishing House
Researcher
Published in the Russian Federation
European Researcher
Has been issued since 2010. ISSN 2219-8229
E-ISSN 2224-0136
Vol. 91, Is. 2, pp. 114-126, 2015
DOI: 10.13187/er.2015.91.114 www.erjournal.ru
UDC 33
Corporate Failure Prediction of Public Listed Companies in Malaysia
1 Qaiser Rafique Yasser 2 Abdullah Al Mamun
1 University Malaysia Sarawak, Malaysia Faculty of Economics and Business 2 University of Newcastle, Australia Newcastle Business School
Abstract
This paper aims to extent the prediction model of financial distress among Malaysian public listed companies from period 2006 to 2010. Altman Z-Score Models was used to identify classification on three main zones which are safe, grey or distress zone. The results specify that 56 а of listed companies were classified as ‗distress zone‘з нпа are known as ‗grey zone‘ while 20 а are classified in ‗safe zone‘й Two likely to fail companies was correctly predict at distress zone which Z-Score was lower than 1.81. Moreover, the findings show most of the companies were facing financial distress during global financial crisis on 2008. Industrial transportation and industrial engineering sectors are generally classified as ‗safe zone‘ while food and staplers retailingз real estate investment and services and industrial metals and mining sectors are classified as ‗distress zone‘й
Keywords: Altman Z-Score Models; Corporate failure prediction.
Introduction
After the skyscraper financial scandals in early 2000, the corporate failure has become the mere dream for investor and regulators. Corporate failure is a phenomenon happen in developing countries as well as developed countries due to abrupt grounds. Economic crisis sudden occurred in the middle of 1997 and brought many impacts to Asian corporations which increase number of corporations facing financial difficulties. Financial failure can be form into financial distress, bankruptcy or insolvency. Insolvency can be defined as where a corporate was unable to meet the obligations or working capital is negative. However, bankruptcy defined as when total liability was exceeding fair value of assets (Odipo & Sitati, 2010). According to Thai (2003), corporate failure was developed slowly over many years. Few symptoms can lead to corporate failures which are declining on earning, working capital and increasing in debt.
115
began in 2007 and worsened in first half of 2008, hence it lead little effect on Malaysia and other Asian countries.
There are many company failures in Malaysia capital market at last decade. Corporate failure prediction was very important challenging issue (Zulkarnain, 2006)й In Malaysia‘s studiesз most of the failed companies were classified by Bursa Malaysia (Kuala Lumpur Exchange Stock) under Practice Note 4 (PN 4) and Practice Note 17 (PN 17). Companies which categories into these classifications most probably because the firms are mainly deficit in the company shareholders‘ funds where the financial conditions does not continue trading and listing in the stock exchange. Hence, the companies have been given certain time to regularize and take actions on their financial position which can release the companies from the Practice Note classification (Haniff, Shanmugam, Yap, & Yap, 2011). There are many public listed companies in Malaysia was success obtain Restraining Orders pursuant to Section мтс гмлд of the юompanies‘ ьctз мфсрз where the purpose is to restructure the company debts (Thai, 2003).
Based on the Altman (1968), corporate failure prediction models were extremely valuable to many industry sectors. Altman model which establish in 1968 is known as Altman Z-Score Models formula. It defined as financial model to predict the probability of bankruptcy of a company. Odipo and Sitati (2010) define purpose of the Z-Score model is to measure the financial situation of a corporate and estimate the probability of the company which face bankruptcy within two years. This study provides on relevant financial ratios of a corporate which is useful in predicting the probability of corporate failure. The accuracy classified is 94% of one year before the corporate facing bankruptcy (Altman, 1968). In contrast, Z-Score define 97% of the non-bankruptcy firms in the research. Suppliers of capital, creditors, investors, management and employees are very seriously affected from the business failures. Therefore, this study would like to predict the corporate failure using Altman Z-Score Models (Odipo & Sitati, 2010).
The purpose of this study is to make a contribution to international distress prediction research by responding to the call for international comparisons and uniform models in financial distress prediction. It is worth stressing that a major benefit of a well performing international model would be that its users could carry out their international analyses within the realm of one single model. Different models, their structures, and their outputs are difficult to compare and impairing the decision making process.
Literature review
Corporate failure is a worldwide problem, the number of corporate failure was important for the all countries economic. Bankruptcy can affect firms all around the world and bring lot of impact on the economics of the countries. Corporate failure was an important role in financial theory and accounting (Bhimani, Gulamhussen, & Lopes, 2010). Corporate failure defines as firm was unable to pay back the financial obligations when mature. When a company was face bond default, overdraft on bank or nonpayment for preference stock dividend, the corporate might consider as financial failure (Beaver, 1966). According to Altman (1968), corporate failure defines as company fail to earn a return on risk capital, hence the company was failed to pay its financial obligation when dueй Insolvency on a company means the company‘s total liabilities were greater than the fair value of assets. In the view of accounting, bankruptcy occurs when total of realize and debt obligations greater than expected cash flow (Guo, 2008).
Brabozon et al. (2002) defined range of corporate failure is to earn economic rate of return from capital invested given the business risk. Legal bankruptcy was followed by liquidity of assets in the firm. Brabazon and Neill (2006) stated that financial failure occurs when corporate was fail to repaid liquid from resources in financial. There are reduce on liquidity and serious losses at the end of period declining in financial. Failure in financial was happened when liabilities unable to repaid from liquid financial resources. When liabilities of a firm were unable to repay at the end of period of financial decline, these might lead to financial distress for the company.
116
bankruptcy. Individual, public listed companies, public limited companies and members of partnership have probability of getting bankruptcy (Jacquelyn, 2006).
Corporation which under financial distress can be showed by five criteria which can show as: Firm that was restructured and protect by Scheme of Arrangement and Reconstruction pursuant to Section 176 of Companies Act 1965, corporate that restructure under the Corporate Debt Restructuring Committee, corporate loans was sold to Pengurusan Danaharta Nasional Berhad by financial institutions, corporate which worked on restructure individual with the corporate creditors and firm that classified under Practice Note No. 4 (PN 4), and Practice Note No. 17 (PN 17) by Bursa Malaysia.
In this study, most of the failed public listed companies were classified in Bursa Malaysia which formerly the Kuala Lumpur Stock Exchange. Main reason those companies state in the classification because the companies mainly deficit in their stakeholders funds and companies do not continue trading or listing in the stock exchange market.
Research model
Corporate failure prediction was dominant in business failure studies. Bankruptcy prediction models were applied frequently to examine to financial situation of the selected company. According to Andreev (2006), corporate failure prediction models were proved to obtain high accuracy assessment of financial situation of a corporation. Managers were train by using selected bankruptcy prediction model and proven financial ratios as tools to analysis on bankruptcy prediction. Corrective and prevent action can be taken to prevent bankruptcy in the companies. Therefore, prediction knowledge and skills was importance to continue the company was going concern.
According to Kidane (2004), bankrupcy prediction models used financial informations such like balance sheet and income statement from the corporation. The financial information and various type of financial ratios was act as predictor on the symptoms of corporate failure. Corporate failure prediction models can be categories into three types of models which are Statistical models, Artificial Intelligence and Expert Systems (AIES) models and Theoretic models. Bankruptcy prediction models were show in table 1.
Table 1: Bankruptcy Prediction Models
Category Models
Statistical Models Univariate Analysis
Multiple Discriminant Analysis (MDA) Linear Probability Models (LPM) Logit Model
Probit Models
Cumulative Sums (CUSUM) procedure Partial Adjustment Process
Artificial
Intelligence and Expert Systems (AIES) Models
Recursively Partitioned Decision Trees (Inductive Learning) Model Case Based Reasoning (CBR) Model
Neural Network (NN) Genetic Algorithm (GA) Rough Set (RS) Models
Theoretic Models Balance Sheet Decomposition Measure Gambler‘s Ruin Theory
Cash Management Theory Credit Risk Theories Sources: Kpodoh (2009)
117
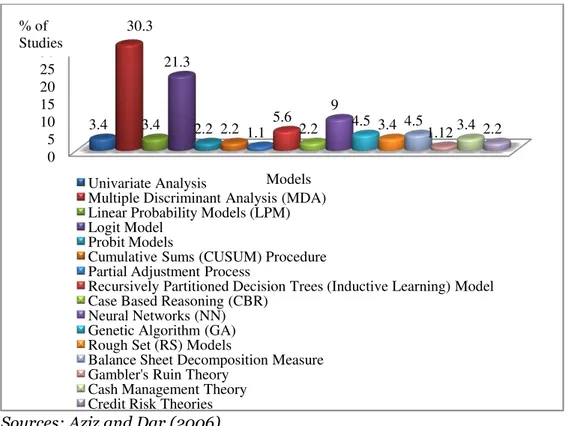
The flowing chart show 3 categories of corporate failure prediction models and it consists of 16 models. According to Aziz and Dar (2006), the percentage of prior studies which is use Multiple Discriminant Analysis (MDA) is 30.3 % and followed by Logit model which is 21.3 % in statistical model. Besides that, the highest studies use in AIES model is Neural Networks (NN) which is 9 %. Balance Sheet Decomposition Measure showed the highest used in Theoretic models which consist of 4.5 %. Proportion of corporate failure prediction models from past studies can be showed at figure 1.
Figure 1: Proportion of Corporate Failure Prediction Models from Past Studies
Sources: Aziz and Dar (2006)
Theoretical framework
The theoretical framework use for bankruptcy prediction is notional one theory. Altman (1968) showed that measuring liquidity, profitability, and solvency are the most significant ratios. This study was mentioned implicitly financial measures in economic concept. Blums (2003) state notional theory was expressed from financial ratio perception as indicators of corporate health. A health firm‘s indicator showed ―good‖ц while if the indicator is poorз the firms are perceived as risk in bankruptcy or unhealthy which consist risk of bankruptcy. There are three types of measurement which is liquidity, profitability and wealth. Higher positive measurement of these measurements shows lower risk of bankruptcy. Notional theory was developed from perception on financial ratios. Financial ratios were act as indicators to determine the corporate health. When the indicators showed good which mean the corporate was perceived as healthy company (Blums, 2003).
Liquidity was indicating as the ability of a firm to meet the corporate current liabilities. Profitability defined as the reservoir of resources which being drained supplemented while wealth are indicate as current magnitude of the reservoir. Company showed low risk of corporate failure when positive sign and high measurement of liquidity, profitability and wealth. Blums (2003) viewed the firm as reservior of liquid assets, which supplied by inflows and drained by outflows. Technique of Multiple Discriminant Analysis (MDA) Models was combines a lot of factors based on important of weight to be given to each factor. Besides that, it also determines composite score to differentiate good customers from bad customers (Satish, 2011).
0 5 10 15 20 25 30 35
Models 3.4
30.3
3.4 21.3
2.2 2.2 1.1 5.6 2.2 9
4.5 3.4 4.5
1.123.4 2.2
Univariate Analysis
Multiple Discriminant Analysis (MDA) Linear Probability Models (LPM) Logit Model
Probit Models
Cumulative Sums (CUSUM) Procedure Partial Adjustment Process
Recursively Partitioned Decision Trees (Inductive Learning) Model Case Based Reasoning (CBR)
Neural Networks (NN) Genetic Algorithm (GA) Rough Set (RS) Models
Balance Sheet Decomposition Measure Gambler's Ruin Theory
Cash Management Theory Credit Risk Theories % of
118
Research MethodologyThese study focus on sector of public listed companies in Sarawak which test on the rank on probability of corporate getting failure. This study compares the entire sector to developed Altman Z-Score Models the sample of data. This study was conduct by used financial ratios from balance sheet and income statement on the sample. Working capital, total assets, total liability and numbers of shares capital can be obtained from balance sheet. Conversely, retained earnings, earnings before interest and taxes, and sales can be obtained from income statement. However, market value equity can get from the share price at end of the years which is on December 31 on every year time in Yahoo Finance. Based on Bursa Malaysia, there are 32 public listed companies in Sarawak from 2006 to 2010, due to there are some listed companies do not have fully data from 2006 to 2010, so the sample data was eliminate to 25 out of 32 public listed companies was been use in this research. There are 7 companies been eliminate due to data was less than 5 years. There are 23 companies are not likely to fail companies and 2 likely to fail companies. The methodology use in this research is quantitative research. The 2 likely to failed companies are categories in PN 17 Company at Bursa Malaysia.
Data Collection
There are total нр public listed companies‘ data in Sarawak гMalaysian Stateд was been use in this research. Sample of companies was categories into 8 difference sectors which are construction and materials, industrial transportation, food producers, real estate investment and services, forestry and paper, industrial engineering, industrial metals and mining and food and staplers retailing. There are 23 not likely to fail companies and 2 likely to fail companies (Table 7 & 8).
All the public listed companies in Sarawak from 2006 to 2010 was classified into 8 sectors which are 8 companies from construction and materials sector, 4 companies from industrial transportation sector, 4 companies are from food producers sector, 2 companies are from real estate investment and services sector, 3 companies are from forestry and paper sector, 2 companies are from industrial engineering sector, a company from industrial metals and mining sector and a company from food and staplers retailing sector.
This study tests the credit risk towards public listed companies in Sarawak. Altman Z-Score Models used to examine the prediction of failed based on secondary data. Altman Z-Score Models developed to identify financial failure firms by using financial data from period 2006 to 2010. Data used in this study is five set of financial ratios and the sample of companies used in this study was selected from firms that listed on Bursa Malaysia from 2006 to 2010. Companies selected are 25 public listed firms from 2006 to 2010 in Sarawak, Malaysia. Altman Z-Score Models was chosen to predict the corporate failed is because one of the ratio market value of equity is divided by total liabilities. Obviously, if a company was not publicity traded, its equity has no market value. Therefore, private firm cannot use Altman Z-Score Models. In this study, the model was widely test around 40 years and it is introduced by Altman at 1968 in United State.
The data show are list of listed companies from list of listed companies from 2006-2010 (5 years). There are only 25 out of 32 companies financial data can be collect from period 2006 until 2010, which is 5 years period. Some of the companies was not yet been listed as listed companies at the moment. The financial data from the 25 companies can be categories into 8 sectors which are 8 companies from construction and materials sector, 4 companies from industrial transportation sector, 4 companies from food producers sector, 2 company from real estate investment and services sector, 2 companies from industrial engineering sector, 3 companies from forestry paper sector, 1 company from for and staplers retailing sector and 1company from industrial metals and mining sector.
Analysis of Data
119
Altman Z-Score ModelsBankruptcy prediction studies by Altman on 1968 has been an effective indicator to determine the public listed companies that has goes to bankruptcy by analyzing company‘s financial performance. According to Kpodoh (2009), a number of variables from financial ratios was analyzed to examine internal liquidity, risk of financial, performance on operating and companies growth. In addition, use of Z-Score Models did not direct tell how managers operate the business. Variable, definition and coefficient factor can be showed in table 2.
Table 2: Variable, Definition and Coefficient Factor
Variable Definition (Ratio) Coefficient Factor
X1 Working capital/total assets 1.2
X2 Retained earnings/total assets 1.4
X3 Earnings before interest and taxes/total assets 3.3 X4 Market value equity/book value of total liabilities 0.6
X5 Sales/total assets 0.999
Sources: Altman (1968)
The financial statements for fiscal years 1968 are presented as below Altman (1968).
Z= 1.2 X1 + 1.4 X2 + 3.3 X3 + 0.6 X4 + 0.999 X5
Where;
X1=Working capital/total assets X2=Retained earnings/total assets
X3=Earnings before interest and taxes/total assets X4=Market value equity/book value of total liabilities X5=Sales/total assets
Z=Overall index
Findings and discussion
The finding on Altman Z-Score data and graph from 2006 to 2010 are likely and not likely to fail companies. Moreover, discussion on each sector classified by zone to determine amount of companies classified as safe, grey and distress zone. On the other hand, average Z-Score for each sector from нллс to нлмл was calculated in each sector to indicate ranking of average sector‘s Z -score categories by each sector was discuss. Discussion on hypothesis was show at last part.
Altman Z-Score for List of Listed Companies from 2006 to 2010
Altman Z-Score for list of listed companies from 2006 to 2010 (5 years period) shown in table 3.
Table 3: Altman Z-Score for List of Listed Companies from 2006 to 2010
# Year
Company Name 2006 2007 2008 2009 2010
1 B.I.G Industries Berhad 1.15 1.01 0.69 0.47 0.49 2 Bintulu Port Holdings Berhad 11.57 11.25 8.09 10.72 10.82 3 BLD Plantation Berhad 1.11 1.52 1.17 1.41 2.05 4 CCK Consolidated Holdings Berhad 3.43 3.59 3.46 4.10 4.58 5 Cahya Mata Sarawak Berhad -0.18 1.71 1.07 1.47 2.01
6 Encorp Berhad 0.18 0.77 0.58 -0.19 -0.16
120
9 Hubline Berhad 1.19 1.15 1.41 0.93 0.87
10 Ibraco Berhad 1.43 1.05 1.66 3.86 2.19
11 Jaya Tiasa Holdings Berhad 2.11 2.16 0.99 0.80 1.04 12 Kim Hin Industry Berhad 3.77 3.67 3.12 3.98 4.00 13 KKB Engineering Berhad 2.71 4.70 3.41 6.39 6.58 14 Naim Holdings Berhad 3.59 3.74 2.01 2.56 3.14 15 Ngiu Kee Corporation (M) Berhad 1.30 1.13 1.30 1.47 1.39 16 Quality Concrete Holdings Berhad 1.78 2.16 1.81 1.59 1.50 17 Rimbunan Sawit Berhad 1.06 1.61 2.02 1.17 0.38 18 Sarawak Consolidated Industries
Berhad
1.10 0.47 0.51 1.65 1.39
19 Sarawak Oil Palms Berhad 1.37 2.72 2.61 2.34 2.86 20 Subur Tiasa Holdings Berhad 5.49 3.08 1.72 1.74 2.05
21 Swee Joo Berhad 1.55 1.43 0.61 0.11 -1.80
22 Ta Ann Holdings Berhad 5.41 3.14 1.41 1.59 1.85
23 Weida (M) Berhad 1.99 1.47 1.04 1.39 1.19
24 Yung Kong Galvanising Industries Berhad
0.94 1.11 1.12 0.90 1.11
25 Zecon Berhad 0.77 0.91 0.72 0.58 0.69
There are 25 companies data was gather from annual report on listed companies in Sarawak at Bursa Malaysia from period 2006 to 2010. Bintulu Port Holdings Berhad show Z-Score are fluctuation from 2006 to 2010.
Altman Z-Score for List of Data of Not Likely to Fail Companies
According to Altman (1968), the researcher was discriminant between bankruptcy companies and non-bankruptcy companies. Hence, this research was use to discriminant likely to fail companies and non-likely to fail companies. Lists of likely to fail companies obtained from PN 17 Company at Bursa Malaysia. PN 17 Company was relating to companies financial distress, hence the companies fall into this categories need to summit proposal to the Approving Authority to restructure and revive on the company to maintain the company (Business Company Information, 2009).
121
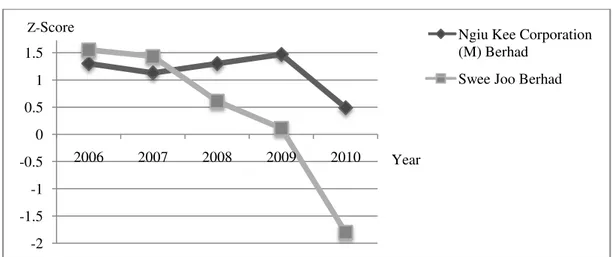
Figure 2: Graph for Likely to Fail Companies
Figure 2 shows likely to fail companies were classified as PN 17 Company and suspend from Bursa Malaysia to restructure and revive in order to maintain the status of listing (Webmaster, 2008). There are 2 companies was classified as PN 17 Company in listed companies in Sarawak are Ngiu Kee Corporation (M) Berhad and Swee Joo Berhad. Besides that, Ngiu Kee Corporation (M) Berhad and Swee Joo Berhad were classified as distress zone in Altman Z-Score Models which the Z-Score for both of the companies was below 1.81. The Z-Score for Swee Joo Berhad show there are drop slightly from 2006 to 2010. At 2010, the Z-Score was -1.80. However, Ngiu Kee Corporation (M) Berhad show fluctuation and start to decrease slightly at 2010.
Classified of Companies by Zones
In Table 4 companies were classification into sector to determine amount of companies in each zone. Average Z-Score was obtained from 2006 to 2010 which is 5 years period. Using Altman Z-Score Models, the table 4 described the placement of all sectors in 3 main zones.
Table 4: Placement of All Sector in 3 Main Zones
# Year
Company Name Avg. Sector Zone
1 Kim Hin Industry Berhad
3.71 Construction and Materials
Safe
2 Naim Holdings Berhad 3.01 Construction and Materials
Safe
3 Hock Seng Lee Berhad 2.36 Construction and Materials
Grey
4 Quality Concrete Holdings Berhad
1.77 Construction and Materials
Distress
5 Cahya Mata Sarawak Berhad
1.22 Construction and Materials
Distress
6 Sarawak Consolidated Industries Berhad
1.03 Construction and Materials
Distress
7 B.I.G Industries Berhad 0.76 Construction and Materials
Distress
8 Zecon Berhad 0.73 Construction and Materials
Distress
9 Bintulu Port Holdings Berhad
10.49 Industrial Transportation
Safe
10 Harbour-Link Group Berhad
1.97 Industrial Transportation
Grey -2
-1.5 -1 -0.5 0 0.5 1 1.5 2
2006 2007 2008 2009 2010
Ngiu Kee Corporation (M) Berhad
Swee Joo Berhad
122
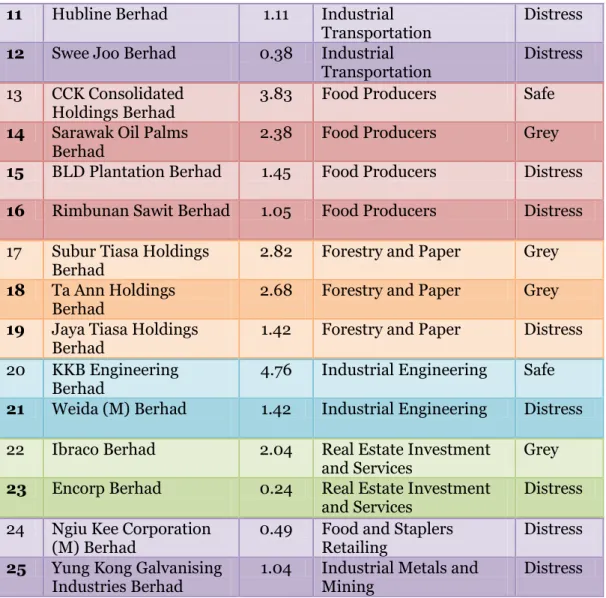
11 Hubline Berhad 1.11 Industrial Transportation
Distress
12 Swee Joo Berhad 0.38 Industrial Transportation
Distress
13 CCK Consolidated Holdings Berhad
3.83 Food Producers Safe
14 Sarawak Oil Palms Berhad
2.38 Food Producers Grey
15 BLD Plantation Berhad 1.45 Food Producers Distress
16 Rimbunan Sawit Berhad 1.05 Food Producers Distress
17 Subur Tiasa Holdings Berhad
2.82 Forestry and Paper Grey
18 Ta Ann Holdings Berhad
2.68 Forestry and Paper Grey
19 Jaya Tiasa Holdings Berhad
1.42 Forestry and Paper Distress
20 KKB Engineering Berhad
4.76 Industrial Engineering Safe
21 Weida (M) Berhad 1.42 Industrial Engineering Distress
22 Ibraco Berhad 2.04 Real Estate Investment and Services
Grey
23 Encorp Berhad 0.24 Real Estate Investment and Services
Distress
24 Ngiu Kee Corporation (M) Berhad
0.49 Food and Staplers Retailing
Distress
25 Yung Kong Galvanising Industries Berhad
1.04 Industrial Metals and Mining
Distress
Average Z-Score obtain to calculate sector classification by each zone and determine how many companies were classified as each zone on each sector. Hence, there are 14 companies were classified as distress zone, 6 companies were known as grey zone and 5 companies were known as safe zone. Number of sector which classified in each zone can be clearly showed in table 5.
Table 5: Sector Classification by Zone from 2006 to 2010
# Sector Amount Safe Grey Distress Total
% Amount % Amount % %
1 Construction and Materials 2 25 1 12.5 5 62.5 100 2 Industrial Transportation 1 25 1 25 2 50 100
3 Food Producers 1 25 1 25 2 50 100
4 Forestry and Paper - 0 2 66.67 1 33.33 100
5 Industrial Engineering 1 50 - 0 1 50 100
6 Real Estate Investment and services
- 0 1 50 1 50 100
7 Food Staplers Retailing - 0 - 0 1 100 100
8 Industrial Metals and Mining
- 0 - 0 1 100 100
123
Table 5 shows number of companies classified at each sector and zone. The result indicate that most of the companies are in distress zone, there are 14 companies with 56 % over total sample, followed by grey zone and safe zone with 6 and 5 companies. The percentage prediction on grey zone is 24 % while safe zone was only consist of 20 %. This shows proportion of low performance of the sectors which classified at distress zone. Food staplers retailing sector and industrial metals and mining sector has 100 % of its companies under distress zone, followed by construction and materials sector by 62.50 %. On the other hand, under the grey zone, forestry and paper place the most company by 66.67 %, followed by real estate investment and services sector which is 50 %. Furthermore, industrial engineering sector are most company by 50 % overall on safe zone.
RankingЫofЫьverageЫSector‟sЫZ-Score
The illustration of the Z-Score for each sector for 6 years period, Average Z-Score for each industry was obianed to calculate the average Z-Score from 2006 to 2010 on each sector. The data was show at appendix. Average Z-Score for 5 years period and ranking on each sector was shows at table 6.
Table сх ьverage Sector‘s Z-Score
Sector Average Z-Score Average Rank
2006 2007 2008 2009 2010
Industrial Transportation 4.04 3.90 3.04 3.47 3.00 3.49 1 Industrial Engineering 2.35 3.09 2.23 3.89 3.89 3.09 2 Forestry and Paper 4.34 2.79 1.37 1.38 1.65 2.31 3 Food Producers 1.74 2.36 2.32 2.26 2.47 2.23 4 Construction and Materials 1.80 2.05 1.49 1.82 1.96 1.82 5 Food and Staplers Reatiling 1.30 1.13 1.30 1.47 1.39 1.32 6 Real Estate Investment and
Services
0.81 0.91 1.12 1.84 1.02 1.14 7
Industrial Metals and Mining 0.94 1.11 1.12 0.90 1.11 1.04 8
Observing the finding by Z-Score on each sector, table above shows the illustration of average Z-Score for each sector for 5 years period. On average, it shows industrial transportation sector and industrial engineering sector have highest Z-Score with an average 3.49 and 3.09 (safe zone), whereas the lowest average of Z-Score are real estate investment and service sector and industrial metals and mining sector with an average 1.14 and 1.04. The trend of the Z-Score on most of the sectors was decrease on 2008 which is industrial transportation section, industrial engineering sector, forestry and paper sector, food producers sector and construction and materials sector. This is because there are global financial crisis at 2008. On 2009, some of the sector was start to recovery from the crisis and it can show on the increase Z-Score on 2009.
Conclusion
Altman Z-Score Models of corporate failure prediction for companies in Sarawak was successfully developed in this study. Besides that, Altman Z-Score Models also identify the probability of financial ratio in Altman Z-Score Models can predict the probability bankruptcy of public listed companies in Sarawak.
124
fail companies. The percentage of failure makes the investigation and prediction of company failure is a useful tool for financial managers and analysts since there are so valuable for predict on corporate failure.
Christopoulos et al. (2009) state that Altman Z-Score Models are useful in predicts corporate failure because it matches on accounting and market value data. Besides that, Altman Z-Score was successful predict the financial distress companies such as Swee Joo Berhad as financial distress companies from 2006 to 2010, the companies was classified as PN 17 Company at 30 August 2010 and officially delisted at 26 September 2011. In addition, Ngiu Kee Corporation (M) Berhad known as financial distress companies also successful classified as distress zone from 2006 to 2010. According to Bursa Malaysia (2011), Ngiu Kee Corporation (M) Berhad was classified as PN 17 Company at 1 July 2010.
According to Zulkarnain (2006), symptoms of distress were existence before Global Financial Crisis on 2008, hence we can conclude that if financial distress symptoms have been detected earlier, the impact of financial crisis can be minimal and corporate can saved from bailing as financial distress firms.
References:
1. Abbas, Q., & Rashid, A. (2011). Predicting bankruptcy in Pakistan. Theoretical and Applied Economics, XVIII(9 (562)), 103-128.
2. Abor, J., & Appiah, K. O. (2009). Predicting corporate failure: Some empirical evidence from the UK. Benchmarking: An International Journal, 16(3), 432-444.
3. Adiana, H. A. N. (2008). Predicting corporate failure of Malaysia's listed companies: Comparing Multiple Discriminant Analysis, Logistic Regression and the Hazard model. International Research Journal of Financial and Economics (15), 201-217
4. Adibah, W. I. W., Adzrin, R. A. R., Annuar, K. K., & Rusliza, Y. (2005). Corporate failure prediction: An investigation of PN4 companies. National Accounting Research Journal.
5. Alkhatib, K. (2011). Predicting corporate bankruptcy of Jordanian listed companies: Using Altman and Kida models. International Journal of Business and Management, 6(3), 208-215.
6. Allen, F., Brealey, R. A., & Myers, S. C. (2008). Principles of Corporate Finance (9th ed.). Singapore: The McGraw-Hill Companies.
7. Altman, E. I. (1968). Financial Ratios, Discriminant analysis and the prediction of corporate bankruptcy. The Journal of Finance, 23(4), 589-609.
8. Andreev, Y. A. (2006). Predicting financial distress: A multinomial Logistic approach to Spanish firms. Autonomous University of Barcelona, Bellaterra.
9. Aziz, M. A., & Dar, H. A. (2006). Predicting corporate bankruptcy: Whither do we stand? , Longhborough University, United Kingdom.
10. Bagatiuk, O., & Dzhamalova, V. (2009). The determinants of bank failure: The evidence from Ukraaine and Russia. Unpublished Master Essay, Lund University.
11. Bandyopadhyay, A. (2006). Predicting probability of default of Indian corporate bonds: Logistic and Z-Score model approach. The Journal of Risk Finance, 7(3), 255-272.
12. Beaver, W. H. (1966). Financial raios as predictors of failure. Journal of Accounting Research, 4, 71-111.
13. Bhimani, A., Gulamhussen, M. A., & Lopes, S. D.-R. (2010). Accounting and non-accounting determinants of default: An analysis of privately-held firms. J. Account. Public Policy, 29, 517-532.
14. Black, F., & Scholes, M. (1973). The pricing of options and corporate liabilities. The Journal of Political Economy, 81(3), 637-654.
15. Blocher, E. J., Ko, L. J., & Lin, P. P. (1999). Prediction of corporate financial distress: An application of the composite rule induction system. The International Journal of Digital Accounting Research, 1(1), 69-85.
16. Blums, M. (2003). D-Score: Bankruptcy prediction model for middle market public firms. Macalester College.
125
18. Brabazon, A., Matthews, R., Neill, M. O., & Ryan, C. (2002). Grammatical evolution and corporate failure prediction. University of Limerick, Ireland.
19. Brabazon, A., & Neill, M. O. (2006). Biologically Inspired Algorithms for Financial Modelling. New Yorks.
20. Bradley, D. B. I. (2004). Small business: Causes of bankruptcy. 205-219.
21. Bursa Malaysia. (2009). Bursa Malaysia Securities Berhad. Retrieved November 7, 2011, from http://www.bursamalaysia.com/website/bm/regulation/rules/ listing_requirements /downloads/bm_main_pn29.pdf
22. Bursa Malaysia. (2011). Company Announcements. Retrieved December 16, 2011, from http://www.bursamalaysia.com/website/bm/listed_companies/company_announcements/annual _reports/index.jsp
23. Christopoulos, A, G., Gerantonis, N., & Vergos, K. (2009). Can Altman Z-Score Models predict business failures in Greece. Research Journal of International Studies (12), 21-28.
24. Chung, K. C., Holdsworth, D. K., & Tan, S. S. (2008). Insolvency prediction model using Multivariate Discriminant Analysis and Artificial Neural Network for the finance industry in New Zealand. International Journal of Business and Management, 3(1), 19-29.
25. Dawis, D. S., Hermawan, M. S., & Tirok, J. (2011). The degree of company vulnerability using Altman model: A survey of public listed companies in Indonesia. Journal of Applied Finance and Accounting, 2(2), 88-99.
26. Feelders, A. J., & Pompe, P. P. M. (1997). Using machine learning, Neural Networks, and statistics to predict corporate bankruptcy. Microcomputers in Civil Engineering, 12, 267-276.
27. Fraser, L, & Ormiston, A. (2001). Understanding Financial Statement (9th ed.). New Jersey: Pearson Education.
28. Grice, J. S., & Ingram, R. W. (2001). Tests of the generalizability of Altman's bankruptcy prediction model. Troy State University.
29. Guo, W. Y. (2008). Financial ratios as predictors of failure: Evidence from Hong Kong using Logit Regression. Rotterdam School of Management.
30. Haniff, M. H. M., Shanmugam, M., Yap, B. C. F., & Yap, J. R. (2011). The predictive abilities of financial ratios in predicting company failure in Malaysia using a Classic Univariate approach. Australian Journal of Basic and Applied Sciences, 5(8), 930-938.
31. Hislop, M. (2004). Secondary Data. Retrieved December 12, 2011, from http://www.forestry.gov.uk/pdf/tboxsecondarydata.pdf/$FILE/tboxsecondarydata.pdf
32. Jacquelyn. (2006). What Do You Know About Bankruptcy. Retrieved November 4, 2011, from http://kclau.com/wealth-management/bankruptcy/
33. Khong, R. W. L., Ong, S. W., & Yap, V. C. (2011). Corporate failure prediction: A study of public listed companies in Malaysia. Managerial Finance, 37(6), 553-564.
34. Kolodner, J. L. (1992). An introduction to Case-Based Reasoning. Artificial Intelligence Review, 6, 3-34.
35. Kpodoh, B. (2009). Bankruptcy and financial distress prediction in the mobile telecom industry. Unpublished Master' Degree in Business Administration.
36. Lev, B. (1973). Decomposition measures for financial analysis. Financial Management, 56-63.
37. Low, S. W., Nor, F. M., & Yatim, P. (2001). Predicting corporate financial distress using Logit model : The case of Malaysia. Asian Academy of Management Journal, 6(1), 49-61.
38. Newton, G. W. (2000). Bankruptcy and Insolvency Accounting (6th ed. Vol. II). United States: John Wiley & Sons, Inc.
39. Nolin, K. A., Sundlof, R., & Wikstrom, D. (2009). Automotive captives a risky business. Unpublished Master Thesis in Business Administration, Lund University.
40. Odipo, M. K., & Sitati, A. (2010). Evaluation of applicability of Altman's Revised model in prediction of financial distress: A case of companies quoted in the Nairobi stock exchange. University of Nairobi.
41. Ohlson, J. A. (1980). Financial ratios and the probabilistic prediction of bankruptcy. Journal of Accounting Research, 18(1), 109-131.
42. Page, E. S. (1954). Continuous inspection schemes. Biometrika, 41, 110-114.
126
44. Poon, W. C., Yap, B. C. F., & Yong, D, G, F., (2010). How well do financial ratios and Multiple Discriminant Analysis predict company failures in Malaysia. International Research Journal of Financial and Economics(54), 166-175.
45. Taffler, R. J. (1982). Forecasting company failure in UK using Discriminant Analysis and financial ratio data. J. R. Statise Soc. A, 145(3), 342-358.
46. Thai, S. B. (2003). Predicting corporate failure in Malaysia during financial crisis using Logistic model approach. Unpublished Degree of Master of Science, Universiti Putra Malaysia.
47. Webmaster. (2008). Bursa PN4 and PN 17 Companies. Retrieved November 4, 2011, from http://protradeshares.com/bursa-malaysia/25/bursa-pn4-pn17
48. Wilcox, J. W. (1970). A simple theory of financial ratios as predictors of failure. Journal of Accounting Research, 9(2), 389-395.
49. Zulkarnain, M. S. (2006). Prediction of corporate financial distress: Evidence from Malaysian listed firms during the Asian financial crisis. Universiti Putra Malaysia, Selangor.
Table 7: Number of Not Likely to Fail Companies
Sr. #
Not Likely to Fail Company Sector
1. B.I.G Industries Berhad Construction and Materials 2. Bintulu Port Holdings Berhad Industrial Transportation 3. BLD Plantation Berhad Food Producers
4. CCK Consolidated Holdings Berhad Food Producers
5. Cahya Mata Sarawak Berhad Construction and Materials
6. Encorp Berhad Real Estate Investment and Services 7. Harbour-Link Group Berhad Industrial Transportation
8. Hock Seng Lee Berhad Construction and Materials 9. Hubline Berhad Industrial Transportation
10. Ibraco Berhad Real Estate Investment and Services 11. Jaya Tiasa Holdings Berhad Forestry and Paper
12. Kim Hin Industry Berhad Construction and Materials 13. KKB Engineering Berhad Industrial Engineering 14. Naim Holdings Berhad Construction and Materials 15. Quality Concrete Holdings Berhad Construction and Materials 16. Rimbunan Sawit Berhad Food Producers
17. Sarawak Consolidated Industries Berhad Construction and Materials 18. Sarawak Oil Palms Berhad Food Producers
19. Subur Tiasa Holdings Berhad Forestry and Paper 20. Ta Ann Holdings Berhad Forestry and Paper 21. Weida (M) Berhad Industrial Engineering 22. Yung Kong Galvanising Industries Berhad Industrial Metals and Mining 23. Zecon Berhad Construction and Materials Sources: Bursa Malaysia (2011)
Table 8: Number of Likely to Fail Companies
Sr. # Likely to Fail Company Sector