ENGENHARIAS, TECNOLOGIA, GESTÃO E TURISMO
ENGINEERING, TECHNOLOGY, MANAGEMENT AND TOURISM
INGENIERÍA, TECNOLOGÍA, ADMINISTRACIÓN Y TURISMO
millenium
91
Millenium, 2(7), 91-101.
APLICAÇÂO WEB PARA ANÁLISE DE TESTES DE AVALIAÇÃO
WEB APPLICATION FOR THE ANALYSIS OF ASSESSMENT TESTS
APLICACIÓN WEB PARA ANÁLISIS DE PRUEBAS DE EVALUACIÓN
Paula Prata
1Luís Duarte
2Maria Eugénia Ferrão
31
Instituto de Telecomunicações; Departamento de Informática, Universidade da Beira Interior, Covilhã, Portugal
2
Departamento de Informática, Universidade da Beira Interior, Covilhã, Portugal
3 Universidade da Beira Interior, CEMAPRE - Centro de Matemática Aplicada à Previsão e Decisão Económica e Departamento de
Matemática, Covilhã, Portugal
Paula Prata - [email protected] | Luís Duarte - [email protected] | Maria Eugénia Ferrão - [email protected]
Corresponding Author
Paula Prata
Universidade da Beira Interior - Departamento de Informática Rua Marquês d'Ávila e Bolama
6201-001 Covilhã, Portugal [email protected]
RECEIVED: 13th March, 2018
ACCEPTED: 13th September, 2018
Prata, P., Duarte, L. & Ferrão., M. E. (2018). Web application for the analysis of assessment tests. Millenium, 2(7), 91-101.
DOI: https://doi.org/10.29352/mill0207.08.00176
m
92
7
RESUMO
Introdução: Um teste de aferição permite a avaliação de uma dada competência ou capacidade de um individuo. Estes testes são
importantes quer no âmbito de instituições de ensino, quer no âmbito empresarial para o recrutamento de recursos humanos.
Objetivos: O artigo tem como principal objectivo apresentar a aplicação web designada "Evaluate" para a análise de testes de
aferição.
Métodos: Descreve-se o desenho e implementação da aplicação que permite fazer a gestão de questões ou itens de aferição, a
partir dos quais é possível a construção de testes de avaliação. A partir dos resultados dos alunos na resolução desses testes, são calculadas as principais estatísticas descritivas usadas na análise de testes de aferição das aprendizagens ao abrigo da teoria clássica dos testes. A aplicação “Evaluate” foi desenvolvida em Python usando a framework Django e foi testada com provas de aferição reais.
Resultados: Para cada teste são atribuídas cotações aos itens e, a partir das respostas dos alunos, são obtidas diversas estatísticas
tais como: índice de dificuldade e de discriminação, correlação ponto-bisserial, coeficiente de consistência interna do teste. A aplicação permitir ainda a análise gráfica do desempenho dos alunos por cada item e no teste como um todo.
Conclusões: A aplicação “Evaluate” é uma ferramenta que contribui para um melhor conhecimento dos instrumentos de aferição
usados na avaliação de conhecimentos, permitindo identificar inconsistências e consequentemente introduzir melhorias no processo.
Palavras-chave: Teoria clássica dos testes; Avaliação electrónica; Análise de dados.
ABSTRACT
Introduction: An assessment test enables the evaluation of an individual’s competence or ability. Such tests are important for both
teaching and professional training institutions, as well as for the recruiting of human resources in the enterprise.
Objectives: The present paper introduces the “Evaluate” web application, for the analysis of assessment tests.
Methods: The design and implementation of the application is described, which allows the management of assessment items, used
to constitute evaluation tests, upon which results the main descriptive statistic values used under the classical test theory in the analysis of assessment tests are calculated. The application was developed in Python, within the Django framework, and tested with real assessment tests.
Results: Scores are assigned to each assessment item, and various statistics — such as difficulty and discrimination index,
point-biserial correlation, test internal consistency coefficient — can be obtained upon the answers of the subjects, as well as a graphic analysis of the performance of each subject on each assessment item, as well as on the test as a whole.
Conclusions: The “Evaluate” application makes a meaningful contribution to a better knowledge of assessment tools used in
competence evaluation, by allowing the detection of inconsistencies and the consequent improvement in the process.
Keywords: Classical test theory; E-assessment; Data analysis
RESUMEN
Introducción: Una prueba de evaluación permite la evaluación de una determinada competencia de un individuo. Estas pruebas
son importantes tanto en el ámbito de las instituciones de enseñanza, tanto en el ámbito empresarial para la contratación de recursos humanos.
Objetivo: El artículo tiene como principal objetivo presentar la aplicación web designada “Evaluate” para análisis de pruebas de
evaluación.
Métodos: Se describe el diseño e implementación de la aplicación que permite hacer la gestión de cuestiones, a partir de los cuales
es posible la construcción de pruebas de evaluación. A partir de los resultados de los alumnos en la resolución de estas pruebas, son calculadas las principales estadísticas descriptivas utilizadas en el análisis de pruebas de evaluación de los aprendizajes bajo la teoría clásica de las pruebas. La aplicación “Evaluate” fue desarrollada en Python usando el framework Django y fue probada con pruebas de evaluación real.
Resultados: Para cada prueba se asignan cotizaciones a los ítems y, a partir de las respuestas de los alumnos, se obtienen diversas
estadísticas por cada ítem e por cada prueba. La aplicación permite además el análisis gráfico del desempeño de los alumnos por cada ítem y en la prueba como un todo.
Conclusiones: La aplicación “Evaluate” es una herramienta que contribuye a un mejor conocimiento de los instrumentos de
medición usados en la evaluación de conocimientos, permitiendo identificar inconsistencias y consecuentemente introducir mejoras en el proceso.
Prata, P., Duarte, L. & Ferrão., M. E. (2018).
Web application for the analysis of assessment tests. Millenium, 2(7), 91-101.
DOI: https://doi.org/10.29352/mill0207.08.00176
m
7
93
INTRODUCTION
Assessment or evaluation tests are an essential instrument in all teaching and learning processes, namely within the scope of formative assessment with e-assessment platforms. By their use, we can compare the targeted objectives with the results achieved along the joint work of teachers and students, which enables the adjustment of strategies and the improvement of work methodologies.
Furthermore, assessment and evaluation in higher education related literature demonstrates that the students generally exhibit a positive attitude towards the adoption of e-assessment, and that there is a strong correlation between the results achieved with paper and pencil traditional tests, with those obtained with e-assessment, where most questions are of the closed answer type (Ferrão, 2010). This evidence incentive the adoption of e-assessment practices in other contexts. The field of work known
as Computerized adaptive testing (CAT) is defined by the International Association for Computerized Adaptive Testing (CAT)1
aiming at “the redesign of psychological and educational measuring instruments for delivery by interactive computers”. CAT can be used for tests of ability or achievement and for measures of personality and attitudinal variables. Its objective is to select, for each examinee, the set of test questions from a pre-calibrated item bank that simultaneously most effectively and efficiently measures that person on the trait”. Considering that in the digital world, any conceptual assessment framework faces two main challenges: (a) the complexity of knowledge, capacities and skills to be assessed; (b) the increasing usability of computer and web-based assessments, which requires innovative approaches to the development, delivery and scoring of tests, Ferrão and Prata (2014; 2015) explore the adoption of computerized adaptive testing (CAT), aiming at reducing the test size, and simultaneously controlling the impact of such reduction upon the measurement error, in other words, at the production of tests so structured as to generate results which reflect faithfully the degree of knowledge acquisition of the students. In Costa & Ferrão (2015) the authors conceptually present three essential modules of a CAT platform — Informatics (procedures related to test delivery and data collection), Statistical methods (procedures related to data modelling, scoring and calibration) and Topic contents (Items bank and procedures related to items bank manager) — upon which the Adaptive Test Developer operates. There are two statistical approaches to the analysis of the tests, both as a whole, as well as on a question/item basis: the classical test theory (CTT) and the item response theory (IRT) (Hambleton, Swaminathan, & Rogers, 1991). For the purpose of this paper the methods chosen are in accordance with the classical test theory (CTT) (Lord & Novick, 1968).
The present paper2 introduces the “Evaluate”, a web application which provides its users — docents and other professionals
involved in assessment processes — with a statistical analysis of the tests. The application belongs to the aforementioned Informatics and Statistical methods modules, and it permits the management of students, questions and assessment tests. Upon input of each student’s evaluation grid, a parameter analysis can be performed, either on a question by question basis or on the entire test as a whole.
The paper is structured as follows: both the CTT foundations and the parameters that can be computed with the current version of “Evaluate” are referred in section 2; some related works are referred in section 3; a brief description of the requirements analysis, the proposed architecture, the data model and some representative use cases illustrate the application design in section 4; the “Evaluate” implementation and results obtained with sample questions and tests are presented in section 5 and section 6 presents the conclusions and possible courses of action in future research.
1. CLASSICAL TEST THEORY
The definition of measurement is “a procedure for the assignment of numbers (scores, measurements) to specified properties of experimental units, in such a way as to characterize and preserve specified relationships in the behavioural domain” (Lord & Novick, 1968) (p.17). A relevant statistical approach used in educational measurement is the CTT. According to such approach, it
is assumed that variable X(T) represents the student’s learning. The observable variable X is generally obtained by test
administration. If the tests were instruments with absolute precision, the observed value X, regardless of the test used, would
be equal to true value X(T). In a hypothetical situation where the student is repeatedly tested T times, the formula (1) X = X(T) + εt,
(t = 1, ..., T), represents the relationship between the true and the observed values. In that formula, ε represents the measurement error, which is assumed to be non-systematic, homoscedastic, and non-correlated with the true value (Guilford & Fruchter, 1978).
The application “Evaluate” comprises an item bank, i.e. a set of questions or assessment items, thus allowing the user to build a test meeting some specifications. For each test, the correction criterion is inserted, that is, the number of points for each item and the value assigned to the corresponding response for each student. The student’s score on the test is computed. Based on these data, several descriptive statistics are computed for the purpose of studying the properties of the test and its items, as for
1
http://iacat.org/
2 A Portuguese version of this paper was published in the proceedings of the International Conference on Engineering - A vision for the Future, ICEUBI 2017,
Prata, P., Duarte, L. & Ferrão., M. E. (2018). Web application for the analysis of assessment tests. Millenium, 2(7), 91-101.
DOI: https://doi.org/10.29352/mill0207.08.00176
m
94
7
example the average, standard deviation, and variance of the students’ scores. The histogram of the standardised scores can be drawn. Finally, the internal consistency of the test is calculated using the Cronbach alpha coefficient.
Considering the student j, their score on the test is computed by applying the formula (2) ∑ , where n is the
number of items that compose a test, percij is the score in percentage obtained by each student j (=1, 2, …, m) on item i (=1, 2,
…, n), and ci is the number of points assigned to that item i.
The average of the scores is given by formula (3) ⁄ ∑ , and the standard deviation is given by formula (4)
√ ∑ where, m, xj, and are defined above. The variance of X is given by formula (5) where s
is the standard deviation of the variable X.
The alpha Cronbach coefficient (Guilford & Fruchter, 1978) is used to quantify the internal consistency of a test, a statistic based on the correlation between the different items in the same test, which expresses the degree of test consistency across all responses for all items. The alpha Cronbach takes values between 0 and 1, where 0 represents the total absence of test
consistency and 1 indicates that the test is 100% consistent. This coefficient is calculated by equation (6):
( ∑ ) where is the variance of item i. The smaller the variance across items, the more - Cronbach approaches the
value 1, that is, the more consistent the test will be. From among the several existing tables used to categorize the internal consistency of a test according to Cronbach's alpha coefficient, the one shown in table 1 (Vieira, 2015) was adopted.
The items characteristics are quantified through the discrimination and difficulty indexes. The discrimination index measures the capacity of the item to distinguish the high performance group of students from the low performance group of students, and its values vary from −1 to 1. The difficulty index is provided by the proportion of correct answers to item i (Guilford & Fruchter, 1978). Therefore, high values indicate easy questions. Generalising the definition of the difficulty index to non-dichotomous items, the level of difficulty of a question is given by the average of the classification obtained by the set of students on this
question (Guilford & Fruchter, 1978), and is calculated with equation (7): ∑ , where m corresponds to the
total number of students who answered the item and markj represents the mark that each student obtained in item i. It should
be noted that in a dichotomous model, in which the score is either right or wrong (1 or 0), the difficulty of a particular item in one test is given by the percentage of students who, in the said test, got the item right. To categorize the difficulty of an item, the classification presented in table 1, taken from (Ramsay, 2018), was followed.
Table 1 - Classification of the test internal consistency according to the Cronbach’s Alpha, item difficulty designation and discrimination index designation.
Cronbach’s Alpha Test internal consistency
α >= 0.9 Excellent 0.9 > α >= 0.8 Good 0.8 > α >= 0.7 Acceptable 0.7 > α >= 0.6 Questionable 0.6 > α >= 0.5 Poor < 0.5 Unacceptable
Item difficulty Item difficulty designation
0 - 20% Very difficult 21 - 60% Difficult 61 – 90% Moderately difficult 91 – 100% Easy
Point-biserial correlation Discrimination index designation
Between 0 and 0.3 (0 and -0.3) Very bad Between 0.3 and 0.5 (-0,3 and -0.5) Bad Between 0.5 and 0.7 (-0.5 and -0.7) Moderate Between 0.7 and 0.9 (-0.7 and -0.9) Strong
Prata, P., Duarte, L. & Ferrão., M. E. (2018).
Web application for the analysis of assessment tests. Millenium, 2(7), 91-101.
DOI: https://doi.org/10.29352/mill0207.08.00176
m
7
95
T
here are numerous approaches to the calculation of the discrimination degree, which can be divided into two main types: i)the use of criterion groups and ii) the correlation of the item with the total of the items. We adopted one approach of each type. The D index uses criterion groups, i.e., it calculates the difference of the scores between a higher group (for example the 27% better tests) and a lower group (the 27% worse tests) (Guilford & Fruchter, 1978). This percentage of 27% is a commonly used value for the size of the two groups, which can be changed in accordance with the user’s preference. The D index is calculated
with the formula (8) ∑ ∑ where m’ is the number of students in the criterion group (e.g. if the test is answered by
100 students and the criterion group size is 30%, m’ is equal to 30); xj corresponds to the grade obtained in the item by the
student j (= 1,2, ... m’) belonging to the upper group (that is, of the best grades); tj corresponds to the grade obtained in the item
by the student j (= 1,2, ... m’) belonging to the lower group. The higher the D index, the more discriminating that item is. A zero or negative D index indicates that the item is non-discriminatory.
Within the correlation type approaches, “Evaluate” adopts the point-biserial correlation, which also provides a measure for the degree of discrimination (Guilford & Fruchter, 1978), by quantifying the correlation between the values obtained for any given item and the total test scores. In order to apply this coefficient to non-dichotomous variables, a correct value which defines the minimum percentage required to consider an answer as correct, is associated with the test, though changeable by the user. The
point-biserial correlation is given by equation (9): √ ⁄ where xa is the mean of the students’ score who answered
the item correctly, xt is the total mean of the test, s is the standard deviation of the test, p is the proportion of students who scored on the item, and q (= 1-p) is the proportion of students who did not answer the item correctly. The item discrimination given by the point-biserial correlation is classified according to table 1 Ratner, 2018).
2. RELATED WORK
The development of learning assessment platforms has received the attention of research teams all over the world, especially in
countries where large scale assessment is current practice. For instance, TAOTM (Testing Assisté par Ordinateur) (TAO, 2018) is
one of the best known since the OECD adopted it for PISA (Programme for International Student Assessment). According to (Kirsch & Lennon, 2017) the PIAAC (Programme for the International Assessment of Adult Competencies) “marks an inflection point in the evolution of large-scale comparative assessments” because it is the first fully computer-delivered survey, involving a multistage adaptive testing and the development of an open-source platform. Another well known platform is Concerto (Concerto, 2018) which enables the creation of online adaptive tests using the IRM approach. The platform Moodle is also currently used in the context of learning analytics research. For example, Strang (2016) imported data from Moodle to SPSS statistical package in order to conduct data analyses on students’ performance. The Strang’ study is focused on the predictive power of learning analytics data and its relationship with student performance. The author applied similar descriptive and correlational statistics as those used by the Evaluate application.
3. APPLICATION ANALYSIS AND DESIGN
This section presents the analysis and design of the Evaluate application, namely a summary of the requirements analysis, application architecture, as well as adopted technologies and data model. By way of illustration, two use cases are briefly described: how to create a test and how to retrieve information about tests, students or questions.
3.1 Requirements Analysis for Evaluate
The “Evaluate” application has the following functional requirements:
- Add, edit and remove questions, tests, students and users available in a database;
- Upload and process of assessment grids;
- Statistical analysis of any given test (mean, standard deviation, Cronbach’s Alfa);
- Graphical display of the values obtained in the test analysis;
- Statistical analysis of any given question, providing graphical representation;
- Database search for tests, questions and students;
- Creation of tests accessible to any user.
- Restriction of test access privileges to one single user.
The non-functional requirements are the following:
- The application is to be accessible from any browser, multi-user, and independent of the user’s technological expertise;
- Whenever the test values are changed all statistical information about the test and questions must be recalculated;
Prata, P., Duarte, L. & Ferrão., M. E. (2018). Web application for the analysis of assessment tests. Millenium, 2(7), 91-101.
DOI: https://doi.org/10.29352/mill0207.08.00176
m
96
7
3.2 Architecture and Data Model
“Evaluate” has a three-tier client/server architecture: the presentation tier is implemented in HTML and CSS, the logic tier is implemented in python and the data tier uses a SQLite database. The Django framework was used as development environment (Django, 2014; 2018).
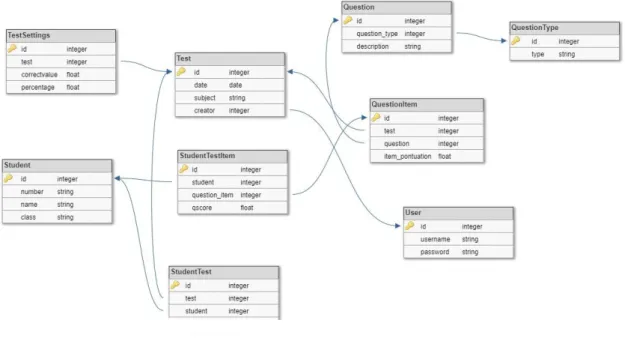
The application data model, shown in figure 1, contains as main entities users, tests questions and students. The database table User stores the access credentials of each user. Table Test stores the data for each test such as creation date, subject and which user creates it; should the creator field be NULL, the test is public. The table TestSettings, associated to table Test, stores the values of correctvalue and percentage for a given test. The attribute correctvalue represents the score above which the answer is considered correct. The attribute percentage represents the value for the parameters of the higher/lower intervals for the criterion groups used to calculate the discrimination D index. For a given test, different values of these two attributes can be defined to study their impact in the computed statistics. The database table Question stores the text and type of the questions. One question may belong to several tests and the type of the question depends on the kind of answer sought (open answer, multiple choice, etc.). The table QuestionType stores the possible question types. The table QuestionItem links table Question with table Test, and contains the score assigned to each question in a given test (attribute item_pontuation).
Figure 1. Data model
Finally, the table Student stores student data such as number, name and course in which the student is enrolled. The table StudentTest represents the many-to-many relationship between the entities Student and Test: a student may be submitted to several tests and a test may be applied to several students. Table StudentTestItem enables the association between a student (table Student) and a test question stored in table QuestionItem.
3.3 Use cases
When creating a new test, the user may choose to login with their identity credentials or not. In the first case only the user will have access to the test data; in the latter, the test will be public.
After selecting “NewTest”, the user will be asked to input the initial test data, namely the date and subject. Next, the user has three options to proceed:
1. “Manually” - To manually enter the test questions, the question score, the students who have answered the questions in the test and the score obtained by each student in each question;
2. “Upload Grid” - To upload a CSV file, containing the test evaluation grid. The header of this file has two rows, the first one contains the question identifier and the second the question score. Each question will so be described in one column, from the second column onwards. The first column is reserved for the student identification header. In the data section, each row presents the data for one student. The student identification will be in the first column and their score for each question on the respective question column.
Prata, P., Duarte, L. & Ferrão., M. E. (2018).
Web application for the analysis of assessment tests. Millenium, 2(7), 91-101.
DOI: https://doi.org/10.29352/mill0207.08.00176
m
7
97
3. “Upload Index” – To upload a CSV file, named index, which contains the evaluation grid for the situation in which all questions are dichotomous, that is, they are marked as correct or incorrect (1 or 0). The structure of that file is as follows: the first row has the score assigned to each question; in the remaining rows the first column has a sequential line number, the second column has the number of students who answered according to the following pattern. For example, in a test with four questions, the line “34 231110”, means that the answer pattern number 34 corresponds to 23 students and these students got right the first, second and third questions and got wrong the fourth question. After the test creation is completed, the user may check the data correction in the webpage “Test Detail” that exhibits all test data.
To check all information regarding tests, questions and students, the user can access any of the options: “Test”, “Student” and “Question”. For each option, all elements, namely tests, students or questions, can be selected, or alternatively any particular element may be selected from that list. The user may choose to use a search bar to look for given values of any available parameters, to select a particular element or group of elements from each list.
4. IMPLEMENTATION
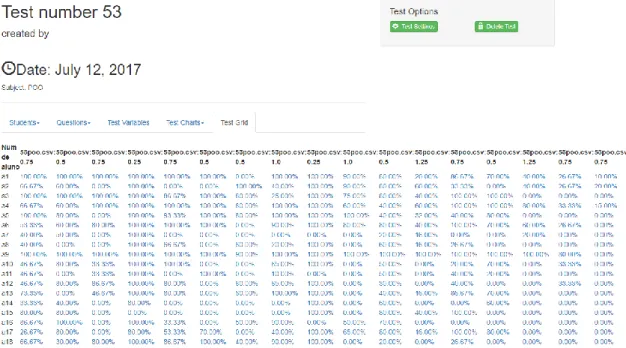
This section introduces the results that can be obtained with the “Evaluate” application in terms of tests and items analysis. To check the application functionalities, some assessment tests from several subjects and several teachers were used. The curricular unit of Object Oriented Programming (POO), taught in the Computer Science degree, was used to illustrate the Evaluate application. After students solved the test, a teacher corrected them creating an assessment grid that is inserted in the application as shown in figure 2. Eighteen students were submitted to the test, named “test 53”, which contains 17 questions and was assigned a 12 points scored (see figure 3).
Figure 2. Evaluation grid for test number 53
As can be seen in figure 2, the grid contains in the first row the question identifier and in the second row the assigned question score. The following rows contain, for each student, the score, in percentage, obtained in each question. Access to the option “Test Setting” is given in the upper right corner. In this option the user can redefine the values of the correctvalue and percentage variables, as introduced in section 4.2. Correctvalue is the value above which the answer is considered correct, defaulting to 100%; the percentage variable is the value of the interval for the criterion groups, and it defaults to 27%.
Figure 3 presents on the left the list of students that answered the test 53. By selecting a student in that list, that student’s assessment results can be retrieved. The questions list of test 53 can be seen on the right side of figure 3. The details of each question can be accessed by selecting the associated link in this list.
Prata, P., Duarte, L. & Ferrão., M. E. (2018). Web application for the analysis of assessment tests. Millenium, 2(7), 91-101.
DOI: https://doi.org/10.29352/mill0207.08.00176
m
98
7
Figure 3. Details of test 53 and its list of questions
4.1 Test Analysis
The statistical analysis of the test can be obtained by selecting the “Test variables” option that will display the values of mean, standard deviation and Cronbach’s Alpha coefficient calculated according to the scores obtained by the students in the test. The values obtained with test 53 can be seen on the left hand side of figure 4, and are namely: mean = 5.03; standard deviation = 2.63; Cronbach’s Alpha = 0.99. The formula used in the computation of each of these values can be visualised by clicking on the green “!” icon.
Figure 4. Test variables and approval chart of test 53
Finally, by choosing the option “Test Charts” the graphical representation of the test results can be accessed. The graphic that represents the approved and failed percentages of the students subjected to test 53 is to be found on the right hand side of figure 4. The graphic on the left side of figure 5 shows the histogram of the standardised score values (e.g. Guilford & Fruchter, 1978). It is also possible to build a graphic showing the difficulty level of each test question. Figure 5 on the right shows that most test 53 questions were difficult.
Prata, P., Duarte, L. & Ferrão., M. E. (2018).
Web application for the analysis of assessment tests. Millenium, 2(7), 91-101.
DOI: https://doi.org/10.29352/mill0207.08.00176
m
7
99
Figure 5. Histogram of test 53 scores and difficulty level of its questions
4.2 Items Analysis
By accessing any given question, and selecting the option “Question variables”, the user is granted access to the detailed analysis of any given item, namely to the difficulty level and the discrimination index, the latter calculated by both the point-biserial correlation and the D index. Figure 6 displays the results obtained for question 191, test 53, which, as can be observed, exhibits moderate degrees of both difficulty and discrimination.
Figure 6. Variables of question 191, test 53
A graphical analysis for each test item is also provided, which displays separately the respective approval and failure rates in a pie chart, and a histogram of the obtained scores. Figure 7 shows the approval chart and score histogram for question 191, test 53.
Prata, P., Duarte, L. & Ferrão., M. E. (2018). Web application for the analysis of assessment tests. Millenium, 2(7), 91-101.
DOI: https://doi.org/10.29352/mill0207.08.00176
m
100
7
4.3 Discussion
After a first test analysis, the score of each question can be adjusted in order to reach different goals. If the user concludes that the test is too difficult or too easy, a sensitivity analysis can be conducted in order to change each item score and verify in real time the effects of that change. Thus, for each change, the effects in the percentage of approved students, in the test consistency and in the difficulty and discrimination levels of the items can be observed. If some questions reveals as non-discriminating, the user can choose to remove them from the test. If the test has poor or questionable consistency, the point-biserial correlation can be used to identify items that cause most inconsistencies and try to minimize the problem changing the scores assigned to those items. Any change in the scores of an evaluation grid will be reflected in the statistical values calculated to the items, to the test and in the generated graphics. The application “Evaluate” has shown to be a powerful tool to real time analysis of tests results, allowing adjusting and improving the assessment process.
CONCLUSIONS
The application “Evaluate” introduced in this paper implements the main descriptive statistics values used in the analysis of learning processes, in conformity with the CTT model. With “Evaluate”, teachers and trainers can easily and intuitively analyse the assessment tests and respective items, as resolved by the examinees; they can identify problems and inconsistencies and on the basis of these improve the evaluation process. This study is part of a wider project that proposes itself to explore complementarity between CTT and IRM, when building an adaptive testing platform. Following the simulation study presented in Ferrão & Prata (2014), we plan to extend the Evaluate application to accommodate IRM. In addition, more work is needed in order to understand the relationship between the item exposure rates, item usage and item bank requirements. Further work also comprises the study of item leverage on overall scores and on the test length reduction.
ACKNOWLEDGEMENTS
This work was partially funded by FCT- Fundação para a Ciência e a Tecnologia through projects number: UID/EEA/50008/2013 and FCT/MCTES (UID/MULTI/00491/2013. We are grateful to the referees for their valuable suggestions.
REFERENCES
Costa, P. M. & Ferrão, M. E. (2015). On the complementarity of the classical test theory and item response models: Item
difficulty estimates. Ensaio: Avaliação e Políticas Públicas em Educação, 23(88), 593–610.
http://dx.doi.org/10.1590/S0104-40362015000300003
Django (2018). In Django Docs Model instance reference. Retrieved from: https://docs.djangoproject.com/en/2.0/ref/models/instances/
Django (2014). In Nested SQL queries in Django. Retrieved from: http://www.lexev.org/en/2014/nested-sql-queries-django/ Ferrão, M. E. (2010). E-assessment within the Bologna paradigm: evidence from Portugal. Assessment & Evaluation in Higher
Education, 35(7), 819–830. Retrieved from: https://www.tandfonline.com/doi/abs/10.1080/02602930903060990 Ferrão, M.E., & Prata, P. (2014). Item Response Models in Computerized Adaptive Testing: A Simulation Study. In: Murgante, B.,
et al. (Eds.) Computational Science and Its Applications – ICCSA 2014, Lecture Notes in Computer Science, 8581, 552-565. Cham: Springer Nature. https://doi.org/10.1007/978-3-319-09150-1_40
Ferrão, M. E. & Prata, P. (2015). Invited Paper Session 079 Statistical Methods in Computerized Adaptive Testing: Statistical issues in the item bank development for adaptive testing. In 60th ISI World Statistics Congress.
Guilford, J.P. & Fruchter, B. (1978). Fundamental Statistics in Psychology and Education. 6th ed. New York: McGraw-Hill.
Hambleton, R., Swaminathan, H. & Rogers, H. J. (1991). Fundamentals of Item Response Theory. Newbury Park, California: SAGE Publications.
Kirsch, I., & Lennon, M. L. (2017). PIAAC : a new design for a new era. Large-Scale Assessments Education, 5(11), 1-22. https://doi.org/10.1186/s40536-017-0046-6
Lord, F. M. & Novick, M. R (1968). Statistical Theories of Mental Test Scores. Oxford, England: Addison-Wesley. Ramsay, C. (2018). In Schreyer Institute Item Analysis and Difficulty. Retrieved from:
http://sites.psu.edu/itemanalysis/difficulty-2/
Ratner, B. (2018). The Correlation Coefficient: Definition. DM STAT-1 CONSULTING [Newsletter]. Retrieved from: http://www.dmstat1.com/res/TheCorrelationCoefficientDefined.html
Prata, P., Duarte, L. & Ferrão., M. E. (2018).
Web application for the analysis of assessment tests. Millenium, 2(7), 91-101.
DOI: https://doi.org/10.29352/mill0207.08.00176
m
7
10
1
Strang, K. D. (2016). Do the critical success factors from learning analytics predict student outcomes? Journal of Educational Technology, 44(3), 273–299. https://doi.org/10.1177/0047239515615850
Testing Assisté par Ordinateur (2018). Open Source Assessment Platform -TAO Testing. Retrieved from: https://www.taotesting.com/
University of Cambridge.The Psychometrics Centre/Concerto. (2018). The Open-Source Online Adaptive Testing Platform. Retrieved from: https://www.psychometrics.cam.ac.uk/newconcerto