Strictly Confidential
“Ballast Water Management Retrofit Program”
by
Carolina Maria Castro Bagulho de Santana Lopes, #767
A Project carried out under the supervision of:
Lars Henriksen, Academic Advisor in Copenhagen Business School
“Ballast Water Management Retrofit Program”
Abstract
Stringent existing and upcoming Ballast Water Management regulation subjected shipowners to install solutions on their vessels that treat the ballast water before discharge. The intent of this project is then to choose, from the wide array of technical and operational Ballast Water Treatment Systems available in the market, the optimal solution for Maersk’s retrofit program. The investment in retrofitting carries significant upfront costs and a high degree of uncertainty remains on the systems’ availability and performance reliability. The discounted cash flow method was used to compute the net present value of the system’s lifecycle costs and real option analysis was introduced to account for the value of managerial flexibility in avoiding an ill-chosen investment strategy through an option to abandon.
Table of Contents
1. Brief Context ... 4
1.1 Client ... 4
1.2 Market overview ... 5
1.3 The Business Project challenge ... 7
2. Reflection on the work done ... 7
2.1 Problem definition ... 7 2.2 Methodology ... 8 2.2.1 Hypothesis ... 8 2.2.2 Work plan ... 8 2.2.3 Analysis ... 9 2.3 Recommendations ... 16 2.4 Concerns ... 18
3. Reflection on Learning ... 19
3.1 Previous Knowledge ... 193.1.1 Masters content applied in the Business Project ... 19
3.1.2 Masters content applied in the Work Project ... 21
3.2 New knowledge ... 22
3.3 Personal experience ... 23
3.4 Benefit of hindsight ... 24
References ... 26
1. Brief Context
1.1 Client
A.P. Moller–Maersk Group, also known as Maersk, is a Danish conglomerate of worldwide businesses that was established in 1904. It is based in Copenhagen, Denmark and operates in over 130 countries with a workforce of around 89,000 employees.
Maersk is publicly traded and ranked 148th on the Forbes Global 2000 list for its $46.9bn market capitalization as of May 20151.
Maersk’s focus is on the shipping and oil and gas industries, such that the structure of the company involves the following five core businesses: Maersk Line, APM Terminals, Maersk Oil, Maersk Drilling and APM Shipping Services, which latter comprises Maersk Supply Service, Maersk Tankers, Damco and Svitzer.
Maersk Line, founded in 1928, is the global container division and largest operating unit at Maersk and one of the world’s biggest shipping companies, given its fleet of over 600 vessels, of which 253 are owned, with a combined capacity of roughly 3mn TEU2.
At a group level, Maersk’s profit for the year 2014 was USD 5.2bn (USD 3.8bn in 2013) and the underlying result3 was USD 4.5bn in 2014 (33% increase compared to USD 3.4bn). Remarkably, Maersk Line is by far the most profitable container shipping company, with an operating margin of 11.8% in 2015 first quarter, which is nearly 10% higher than its average rival.
Furthermore, the Group Procurement coordinates and carries out procurement for Maersk by developing long-standing, mutually beneficial relationships with a large number of suppliers across the world since 2001. It is responsible for sourcing goods and services for Maersk, which main tasks are selecting suppliers, negotiating agreements and making sure that both operational purchasing and relationship building are carried out on a day-to-day basis.
1 Forbes, The World’s Biggest Public Companies 2015 Ranking
2 Twenty-foot Equivalent Unit is an inexact unit of cargo capacity often used to describe the capacity of
containerships.
3 The “underlying result” is equal to the result of continuing business excluding net impact from divestments and
1.2 Market overview
As about 90% of worldwide trade is carried out by sea, the shipping industry is paramount for the import and export of goods at the necessary scale for global economy.
The shipping industry potential for further growth is continuously stronger due to increased economic liberalization and efficiency that fuel cross-border trade and consumption through competitive freight costs. Nonetheless, shipping is a commodity cycle driven industry and its complexity comes from the extreme difficulty in navigating through its numerous twists and turns. This high market volatility creates not only the upside of potential for high profits, but also the downside of risk for large losses.
The shipping industry is underwater due to the sluggish economic growth and global trade resulted in overcapacity and heightened competition. While experiencing financial challenging times due to the low profit margins ensuing from fierce competition, shipowners are forced to have a strong focus on cost minimization. Furthermore, as one of the pioneers of private equity investment in shipping said, Wilbur Ross, “shipping’s fragmentation makes it very difficult to idle capacity when supply exceeds demand”. Thus, “shipping’s structural problems can only be solved by massive consolidation” because if the industry was made up of fewer companies with larger fleets it would be easier for individual operators to deal with downturns since these would be more willing to lay up some of their ships in bad markets to boost prices.
There are over 50,000 merchant ships trading internationally, which are technically sophisticated and high value assets, given that each can cost over USD 200 million to build, and whose operation generates an estimated annual income of over half a trillion US dollars in freight rates4. The ship building finance business has witness a pronounced shift from bank loans towards capital markets, in 2008 banks provided 84% of ship finance, but this had fallen to 63% by 20145 and the total equity and bonds issued by shipowners amounted to $20.9bn6. This opening up to the financial markets enabled shipowners to enjoy the benefits of cheap financing and has been transformational both in terms of fleet size and market capitalization. Additionally, the market is fundamentally changing from a once opaque and un-investible to a sophisticated market that should eventually become less volatile.
4 International Chamber of Shipping 5 Marine Money
The International Maritime Organization (IMO) regulates the shipping industry and is a United Nations specialized agency with responsibility for the safety and security of shipping and the prevention of marine pollution by ships. Although shipping has been the least environmental damaging form of commercial transport, the recent trade volume expansion is increasing that harmful contribution and that is increasingly troubling stakeholders, who are requiring shipowners to live up to sustainability standards, which may ultimately prompt regulation. An example relates to ballast water that is essential for safe and efficient modern shipping operations but the species it carries are harmfully spreading and causing serious and often irreversible damage such that it has urged a global response and regulatory intervention. Thus, a Ballast Water Management (BWM) Convention was adopted by IMO that forces shipowners to treat their ballast water before releasing it back to the sea that comply with the performance standards (D2), in order to limit the spread of the Aquatic Invasive Species (AIS) transferred in the practice of using water as ballast to stabilize vessels. Since then, suppliers of treatment technologies have started to develop and commercialize BWM treatment solutions and a new market surged, the Ballast Water Treatment System (BWTS) market.
The BWTS market is highly competitive and comprises players of varying industry backgrounds, traditional suppliers of marine equipment, suppliers originating from the water and wastewater industry, shipbuilders and shipowners, opportunity seekers and start-ups. The delay in ratification is dragging the pace at which the market could be growing because demand is low since shipowners are unwilling to purchase BWTSs before regulation enters into force, especially for retrofits due to the incremental installation cost. Consequently, low demand is pressuring prices down and BWTSs’ suppliers are not generating any revenues.
The future of the market for BWTSs is difficult to predict as much uncertainty surrounds the market. However, given that the BWTS market is highly legislation-driven an optimistic upward curve in the market quote will only be driven by USCG type approval or BWM ratification, whichever comes first. Once there is a globally accepted BWTS, hopefully before regulation compliance deadlines, demand will increase exponentially and so will prices throughout the following 3-5 years, which is the period when the global merchant fleet is retrofitted. After retrofitting is complete, the market is expected to experience a significant demand and price decline (Appendix A). Thus, the retrofit peak is perceived as the big business of the BWTSs market such that some vendors plan to leave the market right after. Hence, there will be a market consolidation leaving only 15-20 players in the BWTSs market.
1.3 The Business Project challenge
From the 68,000 worldwide merchant ships, the estimate is that 62,000 have to comply with the BWM convention7 and Maersk’s fleet is no exception. Since most newbuilds already come with the BWTSs installed, the real challenge lies in the retrofit of existing vessels. Maersk has to choose which BWTSs to install in its 253 container vessels and 151 tankers. The BWTSs of choosing has to be a globally accepted solution, which means it has to be approved by all legal regimes with regulations about ballast water treatment. Thus, the challenge for the team was to evaluate the 51 commercially available BWTSs in the market both in terms of performance and cost so that at least one was chosen to retrofit Maersk’s fleet.
2. Reflection on the work done
2.1 Problem definition
Noting that about 10 billion tons of ocean water is moved around in ballast water tanks every year, the shipping industry plays a major role in lessening this big ecological and socioeconomic threat. Thus, this will significantly impact shipowners like Maersk that will have to install BWTSs in their fleet, which entails a capital expenditure of a multi-billion dollar magnitude. On the contrary to the desire of industry members, the regulatory environment is fragmented, unclear and gives no investment certainty due to conflicting requirements of international and national legal regimes. The main problem is that there is still no globally accepted solution that enables trade in all waters and compliance deadlines are imminent. Which is Maersk’s, one of the biggest shipping companies in the world, foremost concern. However, the regulatory approvals of the BWTSs are only sorting criteria in the screening of the BWTSs to be evaluated, whilst the greater complexity of the purchase decision lies in this evaluation of the BWTS’s suitability to the vessels both in terms of performance and life cycle cost. The optimal BWTS is one that lives up to the regulatory performance standards at competitive price and whose costs can be optimized.
7 IMO, 2015
2.2 Methodology
2.2.1 Hypothesis
The direction of the Business Project was guided by an initial answer to the management question that embodies the business project challenge: How should Maersk comply with ballast water management regulations in the most cost-efficient way? The intuitive first statement subject to validation through the ensuing analysis that formulated the hypothesis was that Maersk should, in the near future, purchase and install the cheapest, type-approved and vessel suitable BWTSs in its entire fleet to comply with the BWM regulations and ensure worldwide operational flexibility.
2.2.2 Work plan
To answer the management question, the following working questions are developed to structure the project:
• How can Maersk comply with BWM regulations?
• What suitable BWT technologies are there available on the market? • How will the development in BWM regulation affect the BWTS market?
• What BWM solution should Maersk purchase based on BWTS’s performance and cost? • How should Maersk strategically approach the market for BWTSs?
The work plan was then defined to answer the aforementioned questions and to build up to a holistic and solid recommendation. First analyses of the regulatory environment, the BWTS’s technologies and products and Maersk fleet were made, then a Purchase Decision model creation that integrated the strategy developed and later analyses of the BWTS’s market and suppliers.
At first, Maersk Group Procurement thought that the retrofit program of Maersk’s fleet would include liners, tankers and supply vessels. However, Maersk Supply Service (MSS) expectations are that their vessels will be spared from installing BWTSs’ since they only have near-shore based operations. So, although at the current moment supply service vessels are subject to BWM Convention compliance, some changes to the convention are expected to be suggested after ratification, as more than 10 years have passed since adoption and restrictions have become outdated or better thought through, e.g. to ease the requirements for vessels operating near-shore. Thus, for now, MSS prefers to take a step back and wait before incurring
to such a financially demanding investment if there is a possibility of evading it and was therefore removed from the Business Project scope.
Moreover, the data about tankers was not available making the model only ascertained to liners and the purchase decision and strategy recommendations are only for Maersk Line. Nonetheless, the abovementioned analyses, including the Purchase Decision model, were developed for both liners and tankers.
2.2.3 Analysis
Maersk Group Procurement developed an internal approach to the purchase decision that has six steps: establish scope, team and goals; collect and analyze internal data, collect and analyze supply market data; develop strategy; execute strategy; implement and manage category. But the Business Project’s focus is solely on the internal and supply market data collection and strategy development (Appendix B).
Both primary and secondary data were collected and the data sources supporting the analysis are both quantitative and qualitative. The primary data was collected through meetings and interviews with people from Maersk and external industry experts, whereas the secondary data was collected from reports, documents, articles, etc. The two internal information sources were Hardik Bhatt from Maersk Group Procurement and Lasse Emil Andersen from Maersk Maritime Technology, whom provided all the necessary insights and data from Maersk Line and Maersk Tankers, whose business unit’s representatives were unfortunately not possible to interview as these were clients, even if internal, of Procurement. In particular, the data sets of the 253 liners and the 51 BWTSs used in the model were obtained from Maersk and Lloyd’s Register Marine.
The main regulatory body driving the ballast water issue is IMO, who in 2004 adopted the BWM Convention to reduce the risk of invasion of non-native species to host environments introduced by ship’s ballast water discharge. Once the BWM Convention enters into force, which will happen one year after not less than 30 states nor less than 35% of world’s merchant shipping gross tonnage have ratified, shipowners will be required to have installed BWTSs in their ships to comply with the ballast water performance standards (D2). Given the current ratification status at 44 states representing 32,86%, as of May 2015, full ratification is expected to happen in the near future. The other influential, yet national, legal regime driving this issue
is the United States Coast Guard (USCG), whose final rules and guidelines were published on 23rd March 2012 and entered into force on 21st June 2012.
More than ten years have passed since adoption and there is still no ratification, which main reason is related to the divergent guidelines and requirements of IMO and USCG both for the approval process and the treatment performance standards and consequent inexistence of a globally accepted BWTS. Out of the 51 systems considered in this analysis, 37 have received an IMO approval certificate, while none received an USCG final type approval just yet. However, the main findings from the regulation analysis signal that this scenario is about to change as 17 suppliers have applied for a USCG type approval, the USCG is expected to grant its first type approval(s) in late 2015 and the BWM Convention is expected to be ratified shortly after that. During the on-going approval process, the USCG has granted an Alternate Management System (AMS) approval to a long range of systems that serves as an interim solution for compliance until the first final approval is granted but the former is in no way indicative of the latter.
The major goal of this Business Project was to develop a two-dimensional model that outlined a rational for the BWTS purchase decision-making. The Purchase Decision model was then built based on a five-step process: the first step is categorization of the Maersk fleet with the purpose of finding similar features related to the BWTS’s requirements; secondly, a preliminary screening that removes all systems that do not live up to very basic yet crucial requirements; the third step includes the comprehensive estimation and quantification of the performance and life cycle costs of each system, which is illustrated in a decision matrix in the fourth step; lastly, the robustness of the decision model will be tested through a sensitivity analysis (Appendix C).
The fleet is categorized to ensure a good fit between the specificities of each vessel category and the to-be-installed BWTS. There are certain criteria that BWTS is restricted to and these may vary across and within liners and tankers. The chosen vessel sorting criteria are: total ballast pump capacity, power and space availability and safety restrictions. The vessels with same values for these criteria were grouped and assigned a type number, which grouping decreased the number of sorting points from 253 liners to 54 groups. Since data about Maersk’s tankers was not available, safety restriction is disregarded in the subsequent analysis, as only BWTS that are installed in tankers are required to be EX compliant8. So, it is important that a
vessel is able to supply sufficient amount of power to run the BWTS, sufficient space to install it and that the ballast pump capacity of the vessels matches the one of the BWTS. But how much is sufficient?
To define the thresholds of the sorting criteria a three-dimensional coordinate system was built (Figure I), in which the different vessel groups were plotted so that the thresholds could be placed according to the observed distribution, i.e. assuring that areas with a concentrated number of vessels were not divided. For the sake of simplicity two thresholds per sorting criteria were set, which rational lies in the capacity assumption that states each vendor supplies BWTSs in one or two sizes: small or large9. However, the most accurate solution would be to have as many thresholds as there are groups. By setting these thresholds the large box becomes divided into 8 small boxes and 54 vessel groups are assembled into 8 categories.
Figure I: Three-dimensional Plot of all Container Vessels
Source: Own Analysis
In order to take into account the remaining years in operation of the vessel before being scraped or sold off, and minimize life cycle cost of the BWTS, each category of vessels is further divided into age groups. At the beginning there were 3 age groups in intervals of 5 years but after having a look at the data – 55 liners were older than 15 years old –the oldest age group span was then extended from 10-15 years to more than 10 years so that one fifth of the data was not neglected. A vessel that within a few years is expected to be scraped or sold off can benefit
9 Due to the limited amount of data about configurations and BWTS prices a capacity assumption had to be made.
According to which a BWTS with at least 1000 m3/h pump capacity is large and with less is small.
Space available m2 Power available kWh Bal las t w ate r p u mp c ap ac ity m3/ H Ballast wate r pump capac ity m3/H Pow er avai lab le k Wh S p ac e m2
Power available Ballast Water Pump Capacity Space available
Thresholds
from a CAPEX minimized BWTS investment, whereas for a vessel with a long life expectancy it is most valuable to OPEX minimize.
Moreover, knowing the remaining lifetime also enables to compute the profit for that period which is key when deciding whether it is worth pursuing with the investment. That is, for some old vessels it may not be profitable to install a BWTS, since neither the expected profit generated nor the increased value of the vessel on the second hand market will be sufficient to cover the investment on a BWM solution. Old vessels without a BWTS will be in low demand, whereas old vessels with BWTS will be in high demand, which means that there will be price discrepancies that should be accounted for. Since it has proven difficult to estimate the expected difference between second hand vessels with and without BWTSs the maximum price that a system is allowed to cost is equal to the expected profit that the vessel would generate if it continues to operate. Although the further division into age groups of the categories results in 24 possible combinations, the liners only fill in 12 categories (Appendix D).
Moving on to the second step, 4 filters were selected for the preliminary screening of BWTSs: a technology filter, which ensures the necessary safety requirements of not using untested or too dangerous procedures; a regulatory filter that requires IMO approval and later USCG approval; treatment time filter, which has to be lower than the vessel’s minimum time in port to not become a bottleneck; and a vessel filter that comprises all vessel category specific thresholds.
Subsequently in step five, the BWTSs that passed the preliminary screening are further evaluated from both technical performance and cost perspectives. Each BWTS was given a performance score based on the grading of 7 representative factors: the power requirement, pressure drop, treatment time, other services required, water salinity limitations, treatment point and tank coating impact. The first three were graded using the descending standardized technique that gives a 10 to the BWTSs with lowest value and 1 with the highest, while the ones in between are graded on a linear basis (Appendix E). The other 4 factors cannot be graded on a continuous linear scale, namely the, are graded based on a thumb-rule that grades 1 if existent and 10 if not. The final performance score is the weighted sum of the grades of all 7 factors, which weights are assigned according to the individual impact of that factor on the overall performance of the BWTS.
Additionally, the shortlisted BWTSs’ life cycle costs were estimated, which is not only the initial capital expenditure of the investment in the BWTS but also the operational costs
associated. The BWTS’ life cycle cost is the present cost of the remaining lifetime of the vessel category, which breaks down into 5 cost components: price, installation and personnel training as one-time expenses; and maintenance and operations as ongoing expenses.
The initial investment is the cost associated with purchasing the BWTS, which prices vary depending on the system provider and the system size. Maersk made a price index for a 500 m3/h system from all suppliers available and it was found that there is not necessarily a proportional relationship between system size and system cost, i.e. on average a 5.000 m3/h system costs 252% more than a 500 m3/h system. Moreover, the installation costs are insignificant for the vessels not requiring retrofit and therefore assumed to be zero. However, for vessels that do require retrofitting, the cost of installment is approximately equal to the initial cost associated with the investment itself10. Finally, the personnel training costs are minor compared to the total costs of the BWTSs thus, these are assumed to be included in the price of the systems11.
Estimating the present cost of each BWTS’s ongoing expenses requires an estimation of an appropriate discount rate, the weighted average cost of capital (WACC). The risk free rate, market risk premium and levered beta are used to derive the expected cost of equity. The risk free rate chosen was the 20-year Treasury Bond, which yields 2,62%12 as of 4th of May 2015, since it reflects the international exposure of the investment and its duration of around the lifetime of a modern vessel. The Russel Global index fulfills the requirements of an optimal market risk premium, as it is an international value weighted index that tracks 98% of all publicly traded companies in the world, includes the value of capital gains and dividends, and is diversified in terms of size of the underlying business. So, its excess return for the period of 1997-2014, 5,9%, was used as market risk premium. Furthermore, since Maersk is a conglomerate that includes companies from a wide range of industries such as shipping and oil and gas it would be inaccurate to use the company’s risk profile of cash flow as proxy for the retrofit program. Instead, an appropriate beta is the unlevered beta of pure players within the shipping industry and the one used is Aswath Damodaran’s unlevered beta adjusted for cash estimation of the shipping industry of 0,9413. Which has to subsequently be re-levered in order to reflect the financial risk of the investment with the Maersk’s group leverage ratio of 40%14,
10 Peter L. Rasmussen, BIMCO 11 Lasse E. Andersen, MMT
12 http://www.treasury.gov/resource-center/data-chart-center/interest-rates/Pages/TextView.aspx?data=yield 13 Damodaran, 2015
which assumes that the program financing is similar to Maersk’s group capital structure. Then, a proxy for the cost of debt of the retrofit program is the callable bond with maturity in September 2024 that is trading at an ask yield of 3,43% that partly finances Maersk’s operations15. Finally, the WACC was founded to be 8,17%16 and used to discounted the annual projected cash flows, assuming a life span of 18 years, which is the average operation duration given Maersk’s fleet composition.
The estimation of costs of maintenance and operation depend on the amount of ballast water transported on the vessel, which can be estimated as a function of the total cargo transported annually (Endresen et al., 2004), and are assumed to remain constant in real terms17 and the nominal amount to increase by 1,33% throughout the years, which has been the inflation rate for manufactured goods of machinery and equipment for the period 2010-201518.
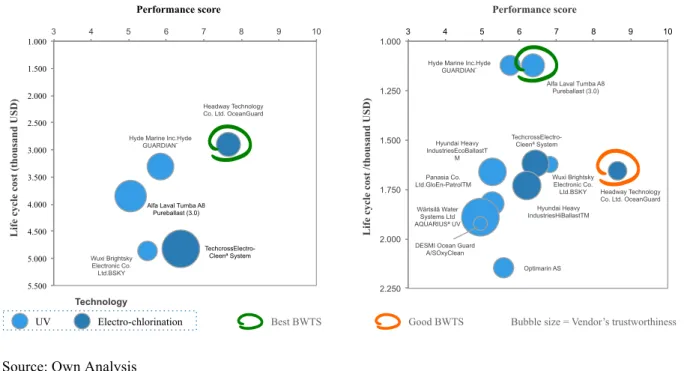
Based on the performance score and life cycle cost estimations, a decision matrix is constructed to illustrate the shortlist of BWTSs’ assessment for each category, in Figure II the decision matrixes of two categories are exhibited.
Figure II: Decision Matrixes for Vessel Categories Mature-4 and Old-1
Source: Own Analysis
15 Bloomberg, May 6th, 2015
16 As the investment bank Jefferies LLC, it is assumed that the marginal tax rate is 0% because Maersk is taxed by
the tonnage tax system.
17 By keeping the real operational costs fixed it is implicitly assumed that the annual amount of ballast water used
remains constant.
18 Prices and Consumption, Statistics Denmark
Headway Technology Co. Ltd. OceanGuard
TechcrossElectro-Cleenª System Hyde Marine Inc.Hyde
GUARDIAN¨
Wuxi Brightsky Electronic Co. Ltd.BSKY
Alfa Laval Tumba A8 Pureballast (3.0) 1.000 1.500 2.000 2.500 3.000 3.500 4.000 4.500 5.000 5.500 3 4 5 6 7 8 9 10 Li fe c yc le c os t (th ou san d U S D ) Performance score Headway Technology Co. Ltd. OceanGuard Wuxi Brightsky Electronic Co. Ltd.BSKY TechcrossElectro-Cleenª System Alfa Laval Tumba A8
Pureballast (3.0)
Hyundai Heavy IndustriesHiBallastTM Hyde Marine Inc.Hyde
GUARDIAN¨ Optimarin AS Hyundai Heavy IndustriesEcoBallastT M Panasia Co. Ltd.GloEn-PatrolTM Wärtsilâ Water Systems Ltd AQUARIUSª UV
DESMI Ocean Guard A/SOxyClean 1.000 1.250 1.500 1.750 2.000 2.250 3 4 5 6 7 8 9 10 Li fe c yc le c os t / th ou san d U S D ) Performance score
Bubble size = Vendor’s trustworthiness UV Electro-chlorination
Technology
The selection process for category Mature-4 is very straightforward since the cheapest BWTS is also the best performer, Headway Technology. However, for category Old-1 one is the best performer and other two are the cheapest. Since this is an investment whose return is a compliant license for Maersk to continue operating as it was before, with substantial cash outflows and no incremental cash inflows, cost is the decisive factor when choosing the BWTS to be purchased and installed. Thus, the choice stands between the Alfa Laval and Hyde Marine, among which Alfa Laval is the best performer and therefore preferred.
One weakness of the decision matrix is that the result is static and does not show how sensitive the performance score and the life cycle cost estimations are to changes in the input variables of the model. Since there is high uncertainty about the weighting of the input factors, and the amount of ballast water used, a sensitivity analysis is conducted and the robustness of the Purchase Decision model is tested with a Monte Carlo Simulation (Appendix F). Looking into the analyzed results for category New-5 (Figure III), the selected BWTS had a higher base value performance score but the average is lower, which means that if the given weightings would change this BWTS could not be the best performer anymore due to its scoring higher variation. Nonetheless, the life cycle cost estimate is robust and relatively insensitive towards changes in the amount of ballast water used due to its low operational costs. Thus, the choice of the BWTS for this category remains unchanged.
Figure III: Monte Carlo Simulation’s analyzed results for Category 5 New Vessels
Source: Own Analysis 7,5 6,3 6,7 7,7 7,2 6,5 8,3 8,3 8,3 7,9 7,3 7,5 0 1 2 3 4 5 6 7 8 9 10
Alfa Laval Pure Ballast (3.0) Headway OceanGuard Hyde Marine Guardian P er for man ce s cor e 2.368 1.594 1.741 2.746 1.618 1.962 3.124 1.642 2.185 0 500 1.000 1.500 2.000 2.500 3.000 3.500
Alfa Laval Pure Ballast (3.0) Headway OceanGuard Hyde Marine Guardian Li fe c yc le c os t (th ou san d U S D )
Then, a vendor profiling of the pre-selected BWTSs is done based on trustworthiness, financial strength and service network coverage. The trustworthiness score is the part of suppliers profiling that accounts for the experience in the BWTS market, how many units of their systems have been built and operated, and for the strategic relationship with Maersk, which relies on Maersk’s supplier segmentation (Appendix G). The key elements to be analyzed when evaluating financial strength are the capability of meeting short-term cash needs, capability of paying debt obligations, and the likelihood of financial distress, which can be assessed by computing liquidity and solvency ratios and the Altman Z-score (Appendix H).
All in all, two different BWTSs from different suppliers and using different technologies were chosen for the liners retrofitting and each category was recommended specific BWM solution composition (Appendix I).
The cost associated with equipping liners with BWTSs and operating them for the rest of the vessels’ lifetime has been estimated to be USD 466 million. This total cost breaks down into the BWTS purchasing cost of USD 254 million, which is the largest component making up 55% of the total, the installation cost of USD 168 million and the operational cost of USD 44 million (Appendix J).
If the division of costs components across the different age groups is explored, there is evidence of the cost minimizing strategy. The operational cost is a larger component for old vessels than that of new and mature vessels, which is largely due to the fact that for old vessels, whose life span is shorter, the investment is CAPEX optimized, while new and mature vessels have longer life spans and their investments are OPEX optimized.
2.3 Recommendations
Maersk is recommended to start preparing for the retrofit program immediately given the forthcoming USCG’s compliance deadline of the first dry-docking after 1st January 2016, that takes about 9 months to plan an investment in BWTSs and at least 3 months to deliver a BWTS once order is placed19. Thus, Maersk should coincide the installation of BWTSs with the existing dry-docking schedule, for which there is a five-year window. Likewise, the cash outflows will be distributed throughout those five years, peaking in 2017 and 2018 (Appendix K), for which outlay and possibly more, due to the possibility of BWTSs’ price increase, Maersk should financially prepare for.
19 Peter Lundahl Rasmussen, BIMCO
Maersk Line is recommended to purchase 89 BWM Solutions from Alfa Laval and 153 from Headway Technologies, which chosen BWTSs are found to be the most suitable for container vessels due to their high technical performance and competitive prices and categorization. Buying BWTSs from two different suppliers based on two different technologies allows for diversification of risk. Given the high degree of competition and expected consolidation in the BWTS market, diversification through several suppliers is important to prevent vendor lock-in but only to the extent that does not hinder bargaining power. Collectively, Maersk Line and Maersk Tankers comprise the overall purchase decision for the retrofit program and if their orders are bundled a discount is expected as proportionally large as the amount of BWTSs ordered. Thus, the next step is to evaluate the available BWTSs’ feasibility for the fleet of Maersk Tankers so that bargaining power can be leveraged.
As for strategy implementation, the BWTSs should be purchased on an on-going basis, coinciding the installation schedule with the IOPP renewal survey schedule, because operational feedback can be a game changer on which BWTSs actually meet the legal performance standards and are easy to handle. Hence, Maersk is recommended to purchase BWTSs on a yearly basis so that the strategy can be changed without incurring in significant losses.
However, this strategy is based on the rational assumption that USCG will release multiple vendor approvals altogether or within a short notice. If USCG only approves one or very few BWTSs, the market shifts from a buyers’ market to a sellers’ market as, the total capacity of the market is restrained giving vendors who received approvals will a very high bargaining power. In this case, Maersk would be forced to purchase the only system that has received the USCG approval for the vessels that have their IOPP shortly after the approval is announced. Nevertheless, it is still recommended that Maersk purchases only the necessary number of systems because the expectation is that once a system receives an USCG approval, other vendors will have living proof of what is actually required to receive an approval and will adjust accordingly. Consequently, more BWTSs will come on the market as globally accepted solutions shortly after the first system receives an approval, which will lead to a slowdown in the BWTS’s unit price rise.
2.4 Concerns
The foremost weakness of this Business Project regards the data validity and reliability as, due to the lack of data, many guesstimates were used as inputs. Besides that, the output of the Purchase Decision model is also contingent on the trade-off between simplification and accuracy inherent to modeling. So, one has to be aware that modeling is about creating a simplified version of reality while understanding what its limits are, as it is not accurately representative of reality. Thus, looking back at the model built, which goal was to build a less cumbersome and more efficient decision-making process, there are limits to its underlying assumptions that may be subject to some variations, namely regarding Maersk’s preferences and market development.
There is in fact a trade-off between simplification and accuracy, which should be determined according to Maersk’s preferences. For instance, categorizing the vessels according to two thresholds per sorting criteria is another simplification and the most accurate approach would be to have as many thresholds as there are groups since this would mean that one category would only include vessels with an exact same sorting criteria value rather than a range.
The preliminary screening filters strictness may be changed according to Maersk’s risk aversion profile. In regard to the technology filter this is now set to remove the BWTSs based on untested or dangerous technologies. Currently, two out of the four existing technologies were found premature and unsafe but this only removed 4 out of the 51 BWTSs being considered. However, one of these technologies can be interesting for the old vessels and a variation is to make this filter looser to include all technologies prominent in the market in the performance evaluation. Another variation that can be made is regarding the treatment time filter, which threshold can be changed from the minimum time in port to an incremental time in port to the one needed for discharge and uptake whose opportunity cost is lower than the price discount of a slower BWTS.
Moreover, although the present cost calculation is based on the assumption that all BWTSs are purchased today, the BWTSs will be installed throughout the five-year retrofit period. Thus, a more accurate present cost computation would be to consider each vessel’s first renewal survey of IOPP certificate after 1st of January 2016 as the purchase date of the respective BWM solution. From then onwards, project the cash outflows for the remaining vessel lifespan and discount them to today to obtain the present cost.
3. Reflection on Learning
3.1 Previous Knowledge
3.1.1 Masters content applied in the Business Project
The discounted cash flow (DCF) analysis says that a company, project or asset is worth all of the cash that it could make available to investors in the future. Thus, all future cash flows are estimated and discounted by the appropriate discount rate to obtain the present values, which sum of both incoming and outgoing cash flows is the net present value (NPV). This is mostly used in finance to estimate the attractiveness of an investment opportunity, which if the net present value is positive may be a good one. Given that all incremental cash flows related to the retrofit program are outgoing, the output of its DCF is a net present cost (NPC).
The inputs necessary to compute the NPV are the cash flows and a discount rate, starting with the former one would have to project the cash flows of the project for the respective time horizon since this is a finite project. If it was a company one should compute the cash flows for the time needed to get to a steady state and then compute the terminal value of cash flows for instance through the perpetuity growth model.
The discount rate is computed based on the Capital Asset Pricing Model (CAPM), which states that investors need to be compensated for time value of money and risk. The time value of money is represented by the risk free rate, which has to reflect the duration and the geographic risk exposure of the underlying cash flow of the project and moreover, reflect the same market as the modeled market portfolio (Holthausen & Zmijewski, 2012). Usually government securities are chosen, namely the ones with no default nor reinvestment risk, and since valuation horizons are usually long, long-term rates are preferred. The next step is to compute a market risk premium, which can be computed as the geometric average of the historical premium stocks had earned over riskless securities and assumes that premiums will revert back to a historical norm.
Subsequently, the beta is the measure of idiosyncratic risk that can be estimated by regressing stock returns against market returns but this reflects the past thereby having a higher standard-error than the alternatively computed bottom-up beta. The latter involves using a peer industry group average unlevered beta adjusted for cash and apply the company financial leverage to obtain the leverage beta, assuming that debt carries no market risk and has a beta of zero. Now
the cost of equity can already be computed but since the appropriate discount rate is one that reflects the expected return for both the firm’s equity and bondholders, the Weighted Average Cost of Capital (WACC), the cost of debt calculation follows. The cost of debt is the rate at which one can borrow and reflects not only the idiosyncratic default risk but also the level of interest rates in the market. The most widely used approach of estimation is to look up the yield to maturity on a straight bond outstanding from the firm (Damodaran, 2015). Finally, the weights used to compute the cost of capital should be the market value weights for debt and equity (Appendix L).
It is important to bear in mind that the estimation of the discount rate is sometimes closer related to art rather than exact science, that is, there are a variety of paths and extensions to take and make depending on the assumptions made. Likewise, in this premature market of BWTSs the computation of cash flows involved much estimation based on many assumptions.
Performing a sensitivity analysis helps reducing that uncertainty by examining the impact that different values for the assumptions might have on a project’s NPV. There are several different approaches to make a sensitivity analysis: single variable analysis that involves varying the base input variables one at a time and see the how it affects the model outputs; scenario analysis involves constructing worst case, best case, and most likely case scenarios; and Monte Carlo simulation (MCS) that uses a probability distribution to represent the uncertainty or risk associated with key variables. The latter is usually the preferred method when there is enough information or data available to identify potential value ranges for the input variables.
The Monte Carlo method propagates uncertainties in model inputs into uncertainties in model outputs through statistical sampling by generating thousand and even hundreds of thousands of trials. Hence, it is a type of simulation that explicitly and quantitatively represents uncertainties by specifying inputs as probability distributions, which result is itself a probability distribution (Mun, 2010).
Since sensitivity analysis enables better decision-making under uncertainty, the MCS was used to make a sensitivity analysis to the life cycle costs computed for each BWTS since these were the decisive factor of the purchase decision, which ultimately impact the net present cost of the retrofit program.
3.1.2 Masters content applied in the Work Project
One of the recommendations given to Maersk was to adopt an ongoing basis go-to-market strategy, however the uncertainty regarding capacity availability worries Maersk. According to the final presentation feedback, Maersk is reluctant about following the ongoing basis go-to-market strategy recommendation and is leaning towards the all-at-once go-to-go-to-market strategy instead. However, there is an alternative solution that can address this issue and give Maersk the best of both worlds: a contract with the suppliers of the BWTSs that entitles Maersk secured capacity for the entire retrofit program and the right but not the obligation to cease it. This would, on the one hand, ensure sufficient capacity for Maersk and on the other hand, protect Maersk against possible performance shortage having the regulatory performance standards as benchmark.
This alternative solution would therefore allow Maersk to change the investment decisions in the future conditionally on information that only becomes available then, namely the BWTSs purchase decision provisional on operational feedback. In the bad state of the world, the purchased BWTSs would underperform and would have to be replaced, which would double the investment. However, if Maersk had this information from the already purchased installed BWTSs and could change the purchase decision it would choose other BWTSs for the vessels that had not yet been retrofitted. This has an implicit double investment only for the vessels already retrofitted rather than for the whole fleet, which are substantial savings. In the good state of the world, the BWTSs installed would comply with the performance standards and the investment made would go smoothly and successfully.
Uncertainty and managerial flexibility are sources of value from the options embedded in real investment projects. Many practitioners and academics have agreed that these options not only need to be considered explicitly as their value can be substantial but there is no clear unanimity on whether these options can be valued or not with any precision.
In essence, the value of real options stems from the fact that when investing in risky assets, one can learn from observing what ensues and adapt its conduct in order to increase the investment’s potential upside and to decrease the possible downside. There are three potential actions to be taken based upon updated knowledge: the first is to build upon good fortune and increase potential profitability; the second is to scale down to the extent of abandoning the investment to reduce potential losses; and the third is to adjourn further investments when there
is ambivalence regarding the future outlook. These respectively describe the options to expand, to abandon and to defer.
The option that Maersk could most benefit from would in its investment strategy would then be the option to abandon, since it gives Maersk the right but not the obligation to countermand the orders placed for the retrofit program only paying for the BWTSs delivered at the cost of a premium, which is negotiated between Maersk and the suppliers. This is equivalent to an American put option on a stock since at any time up to the expiration date the option of selling the underlying asset at the strike price can be exercised.
The discounted cash flows approach used to compute the net present cost of the retrofit program in the Business Project ignores the proposed option to abandon. So, to find the true value of the investment one has to adjust it by adding the value of the embedded real option (Myers, 1984; Brennan and Schwartz, 1985).
3.2 New knowledge
This Business Project was developed in collaboration with Maersk Group Procurement, whose role has drastically developed in stepping up to today’s challenging world, from a cost containment - to a value-driven orientation with supplier collaboration as a key cornerstone. Among the many levers that companies need to employ in order to successfully develop and maintain such collaborations across the value chain are supplier segmentation and mutually-agreed upon interaction models or supplier-specific action plans that set the rules of engagement. Supplier segmentation is a process of differentiating the supply base to determine the appropriate level of engagement based on the depth of business relationship and dependency and length of commitment. However, the segmentation effort should focus on the suppliers’ abilities to deliver on practical business objectives in a way that creates value20. Although segmentation varies widely from company to company, the number of levels tends to be limited to either three or four with strategic being at the top and transactional at the bottom where the vast majority of the supply base resides (Appendix M).
Given that in the current global business environment, success depends more than ever on supplier relationships21, when making the profile of the short-listed suppliers the strategic
20 Inside Supply Management, 2011 21 CSCMP’s Supply Chain, Q4 2012
relationship defined by segmentation was a main factor to consider. Also on the profiling of suppliers, the financial strength evaluation included the computation of an Altman Z-score, which is the output of a credit-strength test that is based on a meaningful predictive model combining the most significant indicators of bankruptcy (Altman, 2000).
The Z-score is a linear combination of five common business ratios, weighted by coefficients estimated by identifying a set of firms that had declared bankruptcy and a matched sample of firms that survived with matching industry and approximate size. The formula was originally designed for publicly held manufacturing companies with assets of more than $1 million but it has been used in a variety of contexts to predict the probability that a firm will go bankrupt within two years. The benefit of using this score as a complement of the liquidity and solvency ratios, which are some of the prevailing bankruptcy indicators, for the financial soundness assessment is that the analysis of combination of ratios removes possible ambiguities and misclassifications observed in traditional ratio analysis (Appendix H).
All in all, the supplier segmentation model and the Altman Z-score were an extension of my knowledge in the management and finance fields, respectively, which illustrate the qualitative and quantitative substance of this Business Project.
3.3 Personal experience
The Business Project was the perfect work finale of a pre-experience master since, by positioning students as external consultants of a corporate partner with a real business challenge, it was somewhat a bridge between academic and corporate life. It was a final rehearsal during which soon-to-be graduates could recognize own strengths and weaknesses in order to develop the former and improve the latter. With that being said, self-evaluation is critical for individual growth and to foster future performance.
Maersk was the client company and although shipping was a big industry in Denmark it is not in Portugal and it is not of my particular interest so, I was not familiar at all with the business. My adaptability skills together with being a fast learner enabled me to rapidly remove the knowledge lag between my fellow Danish team members and me. Moreover, my global mindset made me aware of expertise and working styles discrepancies and that there are more than one way to successfully solve something so that I was used to agreeing on the target and not necessarily on the process of how to get there, which was of great importance for the
group’s interpersonal dynamics. I took an active role in situational assessment, time management and work division by establishing internal deadlines within the team and in managing expectations with both the client and the academic advisor.
Conversely to all team members, I did not had a consulting background which made me less aware of some problem solving frameworks that enabled to structure the strategic thinking but on the other hand enabled me to see the greater picture and give out of the box suggestions. Being a perfectionist can be seen as a double-edged sword in the sense that is positive when it reflects in being highly attentive to detail such that I was the one editing all deliverables but is negative if it drags the pace of work by taking longer in a task than it required to. When with tight deadlines and heavy workload this is definitely something that needs to be improved and one way to do it is by determining beforehand how long that task should take. Another pitfall that could be improved is related to my personality trait of being impatient towards inefficiency, which is very common in group works and meetings. I understood that this could be improved by assuming a leadership position and taking on more responsibility on structuring meetings to ensure that stay within scope, communicating the briefing with agenda and the necessary preparation work and following up with the conclusions and action plan.
3.4 Benefit of hindsight
Recalling the three out of the six sourcing steps that the Business Project focuses on, the collection and analysis of external supply market data and the strategy development were the two steps where most value was added to Maersk and the collection and analysis of internal data the least due to externalities.
One could say that the Business Project team had a competitive advantage compared to Maersk in collecting external data because it has to be very careful with signals that external communications can hint to the market whereas a group of students doing a project are much more unnoticed. Especially for the regulation analysis, where a lot of uncertainty still surrounds the current situation, interviewing people working in the regulatory bodies driving this issue and industry experts gave privileged insight to findings and expectations that determined the recommendation about the timing of the retrofit program. Yet, there was some data that only Maersk could only obtain through a request for information or for quotations (RFI/RFQ), which the one available was outdated and confidential. Maersk planned to run one in the near future
but it did not manage to do it before the Business Project completion, which resulted in data restrictions as the team was only given access to some very basic price indexes. Nonetheless, the team proposed some data request add-ons to the last handout in order to enhance Maersk data collection and ultimately strategy execution.
Another improvement to the fourth sourcing step of strategy execution and related to data collection and analysis is regarding Maersk internal data. This could have definitely been done differently and better, Maersk has to understand that although collecting the accurate data takes time and is expensive in the short term this will be beneficial in the long term, e.g. 3-D scanning the vessels will ensure suitability between the vessel and the installed BWTS.
The strategy of the purchase decision was aggregated in a model where the fleet was categorized and the BWTSs were evaluated based on the performance and cost dimensions. The rationale behind the decision-making modeling was written in the report delivered as well as the results obtained. However, the most value adding delivery was the excel model as evidenced by their request for a follow up meeting after the final presentation in order to walk the managers of this BWTS project at Maersk through the model.
Taking into consideration the overall Business Project challenge resolution, in my opinion, there was too much prominence of technicalities in which business students are no experts. Thus, if Maersk had done some of the technical work at an earlier stage, there would have been more time to further explore topics such as considerations of procurement contracting theories related to negation strategy or incentives to source internally or externally. Instead of simply making an auction and looking for the supplier that makes the lowest bid, it could be interesting for Maersk to consider alternatives such as vertical integration so as to secure production capacity, for which the team’s management knowledge would have been better leveraged.
References
ABS. 2014. “Ballast Water Treatment Advisory 2014”
Altman, Edward. 2000. “Predicting financial distress of companies: revisiting the z-score and zeta models”.
A.P. Møller-Mærsk A/S .2014. “Annual Report 2014”
Bimco. 2015. “The Shipping Market in 2014 and Looking Forward” Bloomberg assessed 6th of May 2015
Clegg, H. and Montgomery, S. 2005. “7 Steps for Sourcing Information Products. Information Outlook”.
Damodaran, A. 2015 “Betas by Sector (US)” DNV. 2012. “Shipping 2020”
Ellram, L. M. 1995. “Total Cost of Ownership”. International Journal of Physical Distribution & Logistics Management.
Endresen, Ø. et al. 2004. “Challenges in global ballast water management”. Marine Pollution Bulletin.
Frost & Sullivan. 2014. “Legislation will Drive Global Ballast Water Treatment Systems Market [Webinar]”.
Frost & Sullivan. 2010. “Shipping Industry Sets Sail: Multi-billion Dollar Ballast Water Treatment System Market”.
Ghoshal, S. and Westney, D. E. 1991. “Organizing Competitor Analysis Systems”. Strategic Management Journal.
International Maritime Organization. 2015. “International Convention for the Control and Management of Ship’s Ballast Water and Sediments (BWM)”.
International Maritime Orgnaization .2014. “IMO Update on the BWM Convention. Where do we stand for 2014-2015? [PowerPoint Presentation]”.
International Maritime Organization. 2012. “International Shipping Facts and Figures – Information Resources on Trade, Safety, Security, Environment.”
Lloyd's Register Marine. 2014. “Understanding Ballast Water Management. Guidance for Shipowners and Operators”
Lloyd’s Register Marine. 2010. “Ballast Water Treatment Technology, Current Status” Lewin, Joel. 2015. “Shipping industry anchors itself in the capital markets”. Financial Times. Maersk Group Procurement. 2015. “Ballast Water Treatment System: Kick-off Meeting [PowerPoint Presentation]”.
Mun, Jonathan. 2010. “On the Shores of Monaco”. In Modeling Risk: Applying Monte Carlo Risk Simulation, Strategic Real Options, Stochastic Forecasting, and Portfolio Optimization. Myers, Stewart. 1984. “Finance Theory and Financial Strategy”.
Schroder, Paul W. and M. Powel, David M. 2012. “Rules of Engagement: A Better Way to Interact with Suppliers”. CSCMP’s Supply Chain Quarterly.
Appendices
Appendix A: Total Ballast Water Treatment System Market Revenue Forecast
Source: Frost & Sullivan, 2014
Appendix B: The Six Sourcing Steps
Source: Maersk Group Procurement, 2015
Appendix C: Five-step process for BWTS purchase decision-making
Source: Own Analysis
Appendix D: Categorization of Maersk Line’s container vessels
Category number # Vessels # New # Mature # Old
1 89 4 32 53 2 17 0 0 17 3 0 0 0 0 4 53 0 48 5 5 26 22 4 0 6 14 0 0 14 7 16 16 0 0 8 27 0 8 19 Missing data 11 -100% -50% 0% 50% 100% 150% 200% 0 1 000 2 000 3 000 4 000 5 000 6 000 7 000 8 000 9 000 10 000
2011 2012 2013 2014 E2015 E2016 E2017 E2018 E2019 E2020 E2021 E2022 E2023
M il li on U S D
NewBuilds Revenue Retrofit Revenue Growth rate
1. Establish Scope, Team & Goals
2. Collect & Analyze Internal Data 3. Collect & Analyze Supply Market Data 4. Develop
Strategy 5. Execute Strategy
6. Implement & Manage Category
Source: Own Analysis Category # Vessels Avg. Age (years) Ballast pump capacity (m3/h) Power available (kWh) Space availabl e (m2) Average profit remaining life time per vessel
(thousand USD) 1 New Vessel 4 4,8 1000 112,5 10 12094 1 Mature Vessel 32 7,5 1000 112,5 10 14950 1 Old Vessel 53 16,1 1000 112,5 10 4846 2 Old Vessel 17 16,6 1000 112,5 31,2 6140 4 Mature Vessel 48 7,6 2000 112,5 10 33772 4 Old Vessel 5 17,0 2000 112,5 10 1806 5 New Vessel 22 3,4 2000 596,7 10 27280 5 Mature Vessel 4 9,3 2000 596,7 10 32552 6 Old Vessel 14 14,1 2000 112,5 31,2 15551 7 New Vessel 16 3,3 1000 596,7 31,2 52525 8 Mature Vessel 8 8,4 2000 596,7 31,2 72319 8 Old Vessel 19 15,5 2000 596,7 31,2 12053
Source: Own Analysis
Appendix E: Descending Grading System Formulas
The higher the value, the higher the grade:
𝐺𝑟𝑎𝑑𝑒 = 𝑋 10 − 1
𝑤𝑜𝑟𝑠𝑡 𝑝𝑒𝑟𝑓𝑜𝑟𝑚𝑎𝑛𝑐𝑒 − 𝑏𝑒𝑠𝑡 𝑝𝑒𝑟𝑓𝑜𝑟𝑚𝑎𝑛𝑐𝑒× 𝑝𝑒𝑟𝑓𝑜𝑟𝑚𝑎𝑛𝑐𝑒 𝑋 − 𝑤𝑜𝑟𝑠𝑡 𝑝𝑒𝑟𝑓𝑜𝑟𝑚𝑎𝑛𝑐𝑒 + 1
The lower the value, the higher the grade:
𝐺𝑟𝑎𝑑𝑒 = 𝑋 10 − 1
𝑤𝑜𝑟𝑠𝑡 𝑝𝑒𝑟𝑓𝑜𝑟𝑚𝑎𝑛𝑐𝑒 − 𝑏𝑒𝑠𝑡 𝑝𝑒𝑟𝑓𝑜𝑟𝑚𝑎𝑛𝑐𝑒× 𝑝𝑒𝑟𝑓𝑜𝑟𝑚𝑎𝑛𝑐𝑒 𝑋 − 𝑏𝑒𝑠𝑡 𝑝𝑒𝑟𝑓𝑜𝑟𝑚𝑎𝑛𝑐𝑒 + 10 Source: Own Creation
Appendix F: Monte Carlo Simulation
The Monte Carlo is each time conducted with 10.000 iterations. The performance score and the annual amount of ballast water used are assumed to have a triangular distribution.
Sensitivity of the weightings
Sensitivity analysis of weightings that combined have to sum to 100% is not straightforward. In order for one factor’s weight to increase another factor’s weight has to decrease with the same amount. Thus the weightings are interdependent. Using the following formula solved this interdependency problem:
𝑊𝑒𝑖𝑔ℎ𝑡 𝑖𝑛 𝑀𝑜𝑛𝑡𝑒 𝐶𝑎𝑟𝑙𝑜 𝑆𝑖𝑚𝑢𝑙𝑎𝑡𝑖𝑜𝑛 = 𝑊𝑒𝑖𝑔ℎ𝑡𝑖𝑛𝑔 𝑋 𝑊𝑒𝑖𝑔ℎ𝑡𝑖𝑛𝑔
For the Monte Carlo Simulation of the weightings it is chosen that the weighting of each factor can change with up to 5 percentage points, e.g. the weighting attributed to the factor pressure drop is 20%, and in the Monte Carlo simulation we let the minimum weighting be 15% and the maximum weighting be 25%.
Sensitivity of the ballast water used
For the Monte Carlo Simulation of the life cycle cost, the amount of ballast water used can deviate by +/-25%. Since the other cost components of the life cycle cost are not dependent of the annual amount of ballast water used a correction for interdependency will not be made.
Appendix G: Supplier Segmentation
Source: Maersk
Appendix H: Financial Strength
Current ratio measures a firm’s ability to comply with its short-term requirements, if higher than or equal to zero then it can pay, otherwise it can’t – CR = Current Assets / Current Liabilities.
Quick ratio measures a firm’s ability to pay its current liabilities without relying on the sale of its inventory, if higher than or equal to zero then it can comply – QR = (Current Assets – Inventory) / Current Liabilities.
Debt to equity ratio translates the amount of assets that are financed with debt. The higher the ratio, the highest will be the proportion of assets financed by debt – Debt/Equity = Total Liabilities / Stockholders Equity.
Interest coverage ratio (or Times Interest Earned) measures the ability of the company to comply with its debt obligations – TIE = EBIT / Interest Expense.
The Altman Z-score original variable component definitions and weighting factor:
• T1 = Working Capital / Total Assets – is a measure for the liquid assets relative to the size of
the firm.
• T2 = Retained Earnings / Total Assets – is a measure of profitability calculated by the
company's age and earning power.
• T3 = Earnings Before Interest and Taxes / Total Assets – is a measure of operating efficiency
excluding tax and leveraging factors. This ratio indicates the importance of operating earnings for long-term viability.
• T4 = Market Value of Equity / Total Liabilities – is a measure which can be used to show up
security price fluctuation as a possible red flag.
• T5 = Sales/ Total Assets – is a measure for total asset turnover
𝑍 = 1.2𝑇!+ 1.4𝑇!+ 3.3𝑇!+ 0.6𝑇!+ 0.999𝑇!
Z > 2.99 -“Safe” Zones
1.81 < Z < 2.99 -“Grey” Zones Z < 1.81 -“Distress” Zones
Thus, the higher the score, the lower the probability that the company will be in financial distress and according to the zones of discrimination companies with an Altman Z-score of 1,8 above are not likely to go bankrupt.
Appendix I: The BWTS Selected for Each Vessel Category
Category # Vessels BWTS BWM Solution
Composition
New-1 4 OceanGuard Headway Technology 2 x 500 m3/h
New-5 22 OceanGuard Headway Technology 1 x 5000 m3/h
New-7 16 OceanGuard Headway Technology 2 x 500 m3/h
Mature-1 32 OceanGuard Headway Technology 2 x 500 m3/h
Mature-4 48 OceanGuard Headway Technology 1 x 5000 m3/h
Mature-5 4 OceanGuard Headway Technology 1 x 5000 m3/h
Mature-8 8 OceanGuard Headway Technology 1 x 5000 m3/h
Old-1 53 PureBallast 3.0 Alfa Laval 1 x 1000 m3/h
Old-2 17 PureBallast 3.0 Alfa Laval 1 x 1000 m3/h
Old-4 5 OceanGuard Headway Technology 1 x 5000 m3/h
Old-6 14 OceanGuard Headway Technology 1 x 5000 m3/h
Old-8 19 PureBallast 3.0 Alfa Laval 2 x 1000 m3/h