Universidade de Lisboa
Faculdade de Ciências
Departamento de Química e Bioquímica
Effects of metabolism
upon neuronal activity and synaptic performance
Clara Cunha Matos Patrício
Dissertação
Mestrado em Bioquímica
Bioquímica
Universidade de Lisboa
Faculdade de Ciências
Departamento de Química e Bioquímica
Effects of metabolism
upon neuronal activity and synaptic performance
Clara Cunha Matos Patrício
Dissertação
Mestrado em Bioquímica
Bioquímica
Orientadores: Doutor Pedro Lima & Doutora Ana Sebastião
2013
AGRADECIMENTOS
Ao meu orientador, Doutor Pedro Lima, pela oportunidade, pelo encorajamento e sobretudo pelas longas horas passadas à distância de um “TOQUEI!” no setup, a ensinar-me a entrar no mundo da electrofisiologia e a discutir os resultados.
À minha co-orientadora, Doutora Ana Sebastião, pela oportunidade que me deu e pelo sentido de joy em ciência.
Ao Doutor Pedro Costa, por ter posto à minha inteira disposição todos os recursos do laboratório de fisiologia da Faculdade de Ciências Médicas e pelas preciosas dicas, que se revelaram sempre spot on.
À Doutora Luísa Lopes, que me aceitou no seu laboratório e grupo sem condicionamentos, e que me ensinou como se fosse uma sua aluna.
À Doutora Ana Isabel Santos e à Gracinda Meneses por, respectivamente, disponibilizar e cuidar dos modelos animais (os famosos ratos!).
Ao André Bastos e ao Bruno Bragança, pelo óptimo ambiente de laboratório e por aceitarem os meus bizarros comportamentos nos “maus dias de patch”.
A todo o grupo de neurociências do Instituto de Medicina Molecular, especialmente à Vânia Batalha, à Diana Ferreira e à Sara Carvalho, que me fizeram sentir bem-vinda e parte do grupo. Uma palavra especial à Joana Coelho, que altruistamente me acompanhou e orientou em todo o trabalho feito no IMM – obrigada!
Ao Doutor Luís Marques, pela disponibilidade e tempo despendido.
E finalmente aos meus pais, família, amigos e ao Fábio que sempre tiveram o cuidado de me acompanhar e dar força no percurso da tese, o qual por vezes teve obstáculos, curvas e rectas que pareciam sem fim. Com a vossa ajuda espero estar perante a porta do jardim.
OBRIGADA!
The garden of neurology holds out to the investigator captivating spectacles and incomparable artistic emotions. In it, my aesthetic instincts found full satisfaction at last. Like the entomologist in the pursuit of brightly colored butterflies, my attention hunted, in the flower garden of the grey matter, cells with delicate and elegant forms, the mysterious butterflies of the soul, the beating of whose wings may some day – who knows? – clarify the secret of mental life. - Santiago Ramón y Cajal, from his autobiography “Recollections of my Life ”
INDEX
Agradecimentos ... iii Index ... v Abbreviations ... viii Figures ... ix Tables ... x Resumo ... xi Abstract ... xii 1 Introduction ... 1 1.1 Nervous system ... 1 1.2 Hippocampus ... 11.2.1 Localization and structure ... 1
1.2.2 Function(s) ... 3
1.2.3 Neuronal circuits ... 4
1.2.4 Hippocampal subregions & the dorsoventral axis ... 4
1.3 Central Nervous system Metabolism ... 6
1.3.1 Metabolism and insulin ... 6
1.3.1.1 Into the nervous system ... 8
1.3.2 Insulin ... 9
1.3.2.1 Receptor’s activation and signal transduction (Kv1.3) ... 9
1.3.2.2 Insulin, diabetes mellitus and Alzheimer disease ... 10
1.3.2.3 Insulin in neurophysiology ... 12
1.3.2.3.1 Insulin as a neuroprotector ... 12
1.3.2.3.2 Insulin as a neuromodulator ... 12
1.4 Neuronal excitability & Ionic channels ... 14
1.5 Potassium currents and channels ... 15
1.5.1 Potassium channel structure and groups ... 16
1.5.2 Voltage-dependent potassium channels ... 18
1.5.2.1 Structure, activation and selectivity ... 18
1.5.2.2 Voltage-dependent potassium channels groups ... 19
1.5.3 Kv1.3 channel ... 23
1.5.3.1 Kv1.3’s structure ... 23
1.5.3.2 Kv1.3’s electrophysiological and pharmacological properties ... 25
1.5.3.3 Kv1.3’s localization and function ... 26
1.6 Experimental Model ... 29
1.6.1 Voltage-gated potassium currents in hippocampal CA1 pyramidal cells ... 29
1.7 Framework of the Project ... 30
2 Goals ... 33
3 Materials & Methods ... 35
3.2 Electrophysiology ... 35
3.2.1 Animals ... 35
3.2.2 Hippocampal CA1 pyramidal neurons preparation ... 35
3.2.3 Recording Setup and perfusion ... 36
3.2.4 Voltage protocols ... 37
3.2.5 Data analysis and statistics ... 38
3.2.5.1 Exponential fitting ... 38
3.2.5.2 Voltage dependence of activation – “Activation profiles” ... 39
3.2.5.3 Current density ... 40 3.2.5.4 Margatoxin effect ... 40 3.2.5.5 Statistics ... 41 3.3 Imunohistochemistry ... 41 3.3.1 Animals ... 41 3.3.2 Fixation ... 41
3.3.3 Antibodies and detection ... 42
3.3.4 Data analysis and statistics ... 45
4 Results ... 49
4.1 Whole-cell K+ currents in CA1 pyramidal neurons ... 49
4.1.1 Currents features (kinetics) ... 49
4.1.1.1 Currents kinetics in CA1 pyramidal neurons from dorsal and ventral hippocampus ... 50
4.1.1.2 Currents kinetics in CA1 pyramidal neurons from fasting and fed rats ... 50
4.1.2 Current voltage-dependence ... 52
4.1.2.1 Current voltage-dependence in CA1 pyramidal neurons from fasting and fed rats 54 4.1.2.2 Current voltage-dependence in CA1 pyramidal neurons from dorsal and ventral hippocampus ... 54
4.1.3 Current density ... 57
4.1.3.1 Current density in CA1 pyramidal neurons from dorsal and ventral hippocampus ... 57
4.1.3.2 Current density in CA1 pyramidal neurons from fasting and fed rats ... 57
4.1.4 Margatoxin-sensitive K+ currents ... 59
4.1.4.1 MgTx-sensitive currents in CA1 pyramidal neurons from dorsal and ventral hippocampus ... 60
4.1.4.2 MgTx-sensitive currents in CA1 pyramidal neurons from fasting and fed rats 61 4.2 Kv1.3 protein expression in CA1 pyramidal neurons ... 63
4.2.1 Subcellular distribution in CA1 region (pyramidal cells) ... 63
4.2.2 Kv1.3 expression in CA1 hippocampal region ... 67
4.2.2.1 Kv1.3 expression in CA1 region from dorsal and ventral hippocampus ... 67
4.2.2.2 Kv1.3 expression in CA1 region from fasting and fed rats ... 70
5.1.1 Is the Kv1.3 expression and whole-cell current in CA1 pyramidal cells dependent
on the rat’s feeding cycle? ... 73
5.1.2 Is the Kv1.3 expression and whole-cell current even throughout dorsal-ventral axis of hippocampal CA1 pyramidal cell layer? ... 76
5.1.3 Are CA1 pyramidal cells from the dorsal and ventral hippocampus evenly dependent on the rat’s feeding cycle? ... 77
5.2 Conclusive remarks ... 79 5.3 Future perspectives ... 80 References ... 83 6 Supplementary material ... 93 6.1 Dorsal-ventral asymmetries ... 94 6.2 Results summary ... 103
ABBREVIATIONS
The main abbreviations used in this dissertation are listed below.
AD – Alzheimer disease
CA1-3 - Cornu Ammonis areas 1-3 CNS – central nervous system DG – Dentate gyrus
DH – Dorsal hippocampus DMT1 – type-1 diabetes DMT2 – type-2 diabetes FBS – Fetal bovine serum IA – A-type current
IGF – Insulin growth factor IDR - Delayed rectifier current IM – M-type K+ current InsR (or IR) – Insulin receptor IRS1 - Insulin receptor substrate 1 GLUT – Glucose carrier
Kv1.3 – voltage-dependent K+ channel 1.3 LZR - Lean Zucker Rat
MgTx – Margatoxin OZR - Obese Zucker Rat PBS - Phosphate buffered saline PCR - Polymerase Chain Reaction
SDS-PAGE - Sodium dodecyl sulfate poly-acrylamide gel electrophoresis S.E.M. – Standard error of the mean
So - Stratum oriens Sp - Stratum piramidale Sr - Stratum radiatum
TMD – Transmembranar domain VH – Ventral hippocampus ZDF - Zucker Diabetic fatty
FIGURES
Figure 1: Diagram of the rat’s hippocampus.. ... 2
Figure 2: Rat hippocampus histology. ... 3
Figure 3: Insulin and its receptor. ... 9
Figure 4:Signal transduction pathways induced by insulin receptor (InsR) activation. 10
Figure 5: Insulin receptor (represented as IR) modulated pathways in neurons, which
are involved in learning and LTP formation. ... 13
Figure 6: Schematic diagram of a voltage-activated potassium channel.. ... 19
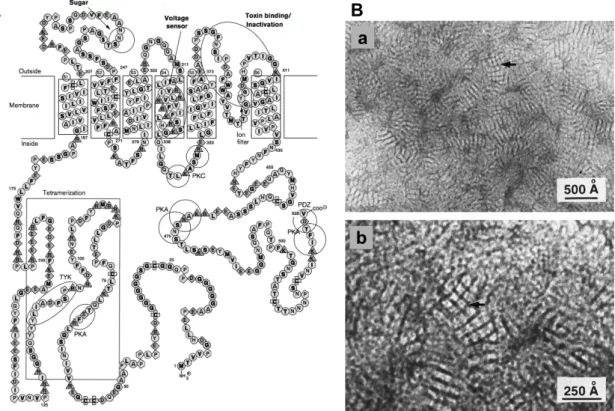
Figure 7: Kv1.3 structure A Diagram showing major functional domains within the
amino acid sequence. ... 24
Figure 8: Kv1.3 current inhibition by margatoxin (MgTx).. ... 26
Figure 9: Kv1.3 expression in mousse hippocampus and hippocampal primary culture..
... 29
Figure 10: Framework of the project. ... 31
Figure 11: K
+(voltage-dependent) current components evoked in CA1 pyramidal
neurons from wistar rat hippocampus. ... 39
Figure 12: Examples of coronal (A) and sagittal (B) slices from P56 mouse brain, used
as references when acquiring the experimental slices to this project. ... 44
Figure 13: Technical approach to measure pyramidal cell layer Kv1.3 fluorescence
illustrated by an example.. ... 47
Figure 14: Time-course of K
+currents (kinetics). ... 51
Figure 15: Voltage-dependence of activation of K
+current components acquisition
procedure, illustrated by example from a fasting rats’ dorsal hippocampal neuron
... 53
Figure 16: K
+current components activation profiles. ... 56
Figure 17: K
+current components current density. ... 58
Figure 18: Margatoxin (3nM) effect upon (voltage-clamped) whole-cell K
+currents
from CA1 pyramidal cells. ... 62
Figure 19: I
slowinhibition (in percentage) by 3nM margatoxin (MgTx). ... 63
Figure 20: Immunohistochemical localization of Kv1.3 channel in rat hippocampal
CA1 pyramidal cells. ... 65
Figure 21:: Immunohistochemical localization of Kv1.3 channel in CA1 region from
hippocampal coronal (rostral and caudal) slices. ... 68
Figure 22:: Immunohistochemical localization of Kv1.3 channel in CA1 region from
hippocampal sagittal slices.. ... 69
Figure 23: Dorsal and ventral Kv1.3 distribution, assessed by integrated fluorescence
density. ... 70
Figure 24: Dorsal and ventral Kv1.3 distribution, assessed by integrated fluorescence
TABLES
Table 1: Glucose carriers (GLUT) family. ... 7
Table 2: Potassium channels groups. ... 17
Table 3: Potassium voltage-dependent channels subfamilies (α-subunit, channel names,
gene locus, functional correlates and tissue distribution). ... 21
Table 4: K
+voltage-dependent currents - main electrophysiological and
pharmacological properties.. ... 23
Table 5 Kv1.3 expression. ... 28
Table 6: Solutions used in 3.2.2Hippocampal CA1 pyramidal neurons preparation and
3.2.3Recording Setup and perfusion ... 38
Table 7: Solutions used in 3.3Imunohistochemistry ... 44
Table 8: Antibodies used in 3.3Imunohistochemistry ... 45
Table 9: K
+current components activation profiles parameters for each study group... 54
Table 10: Margatoxin (MgTx, 3nM) sensitive currents’ time constants (τ
slow). ... 59
Table 11: Margatoxin (MgTx) effect upon I
slowcurrent voltage dependence (assessed by
activation profiles parameters), for each study group.. ... 60
Table 12: Main dorsal-ventral asymmetries described in the literature, classified
RESUMO
O objectivo desta dissertação é avaliar o efeito do metabolismo (ciclo de alimentação) na atividade neuronal. O trabalho centra-se nas correntes de potássio whole-cell em neurónios piramidais da região CA1 do hipocampo de ratos wistar, particularmente aquelas mediadas pelo canal Kv1.3. Dois objectivos foram estabelecidos: (1) avaliar se a expressão de Kv1.3 e respectiva corrente iónica são afectadas pelo metabolismo e (2) avaliar se o eixo dorsal-ventral do hipocampo é homogéneo no que toca à expressão de Kv1.3 e à sua corrente iónica. Para este efeito, foram usadas abordagens de electrofisiologia e de biologia molecular.
Resultados surpreendentes revelam que os neurónios de ratos em período pós-prandial têm diferentes propriedades biofísicas (dependência da voltagem mais despolarizada e cinética mais lenta) e farmacológicas (maior contribuição de correntes sensíveis à margatoxina, possivelmente com dependência de voltagem alterada) em relação a células de ratos em jejum. Propõe-se a existência de um sistema de regulação complexo, de acordo com o ciclo de alimentação, nos neurónios em estudo. Esse sistema envolveria modificações nas populações de canais iónicos que são expressas na membrana neuronal (nomeadamente do Kv1.3, que a margatoxina inibe seletivamente), bem como vias metabólicas capazes de alterar as propriedades biofísicas destes canais (por exemplo alterando a sua fosforilação constitutiva).
Mais, os resultados apresentados indicam que o hipocampo dorsal é mais afectado pelo condicionamento metabólico do que o polo ventral, sugerindo que as funções associadas às duas porções do hipocampo são afectas de forma diferente com o ciclo de alimentação. Estes resultados podem dar suporte neuronal para a noção intuitiva de que a consolidação da memória é afetada pelo ciclo de alimentação.
Mostra-se ainda que os neurónios piramidais da região CA1 têm características biofísicas e farmacológicas irregulares ao longo do dorso-eixo ventral do hipocampo (as células dorsais têm uma cinética mais lenta, maior densidade de corrente e maior sensibilidade para a margatoxina), associadas a uma expressão diferencial do canal Kv1.3 (maior densidade na parte dorsal). Estes resultados vêm dar mais profundidade a evidências recentes que desafiam a premissa clássica de que os neurónios piramidais de CA1 são uma população electrofisiologicamente homogénea ao longo do eixo longitudinal do hipocampo.
Concluindo, as nossas observações sugerem fortemente que a fisiologia dos canais iónicos, bem como a expressão de proteínas no neurónio, alteram-se durante os ciclos metabólicos de jejum/pós-prandial, inclusive ao longo do eixo dorsal-ventral do hipocampo. Fica assim em causa a ideia do cérebro ser uma entidade insensível a variações metabólicas.
ABSTRACT
This study aims to assess the effect of the feeding cycle onto neuronal performance. The work focused on whole-cell K+ currents in pyramidal neurons from CA1 region of wistar rats’ hippocampus, particularly those underlined by Kv1.3 channels. Two goals were established: (1) to assess if Kv1.3 expression and associated ionic currents are affected by metabolism and (2) to evaluate if the dorsal-ventral axis of the hippocampus is homogeneous regarding the Kv1.3 expression patterns and currents. For this purpose, electrophysiology and molecular biology approaches were used.
Striking results reveal that fed rats’ neurons have different biophysical (more depolarized voltage-dependence and slower kinetics) and pharmacological (larger margatoxin-sensitive currents, possibly with altered voltage-dependence) properties than fasting rats’ cells. It is proposed that a complex regulatory system according to the feeding cycle exists in these neurons. This system would involve modifications in ionic channels populations expressed in the neuronal membrane (namely Kv1.3, that margatoxin selectively inhibits) as well as metabolic pathways capable of altering the biophysical properties of these channels (for example by enhancing their constitutive phosphorylation).
Furthermore, the dorsal hippocampus was more extensively affected by metabolic conditioning than the ventral pole, suggesting that functions associated with the two portions of the hippocampus are differently affected by the feeding cycle. These results may give neuronal backing for the intuitive notion of memory consolidation being affected by the feeding cycle.
Additionally, CA1 pyramidal neurons had uneven biophysical and pharmacological profiles throughout out the length of the hippocampus - dorsal cells have slower kinetics, larger current density and larger sensitivity to margatoxin. Such uneven features are associated with a differential expression of Kv1.3 channel (higher density in the dorsal portion) throughout the dorsal-ventral axis of the hippocampus. These impressive results give further depth to recent evidence challenging the classical assumption that CA1 pyramidal neurones are an electrophysiologically homogenous population along the longitudinal hippocampal axis.
All together, our observations strongly suggest that ion-channel physiology, as well as neural protein expression, change during fast-fed metabolic cycles and within the dorsal-ventral axis of the hippocampus, challenging the idea of a metabolically sealed brain.
1 INTRODUCTION
1.1 NERVOUS SYSTEM
This project focuses on central neurons from a particular brain region – the hippocampus (CA1 pyramidal cells).
1.2 HIPPOCAMPUS
The hippocampus is one of the brains’ better-characterized cortical structures. Its name derives from its resemblance with the sea-horse shape (from the greek “hippo” meaning horse and “campus” meaning sea monster). This structure is implicated in learning and memory. A pathological condition affecting this site has serious clinical implications, as it is a target in neurodegenerative disorders (such as Alzheimer disease) and in temporal lobe epilepsy, among others (Jarrard, 1978, Jarrard, 1991).
1.2.1 Localization and structure
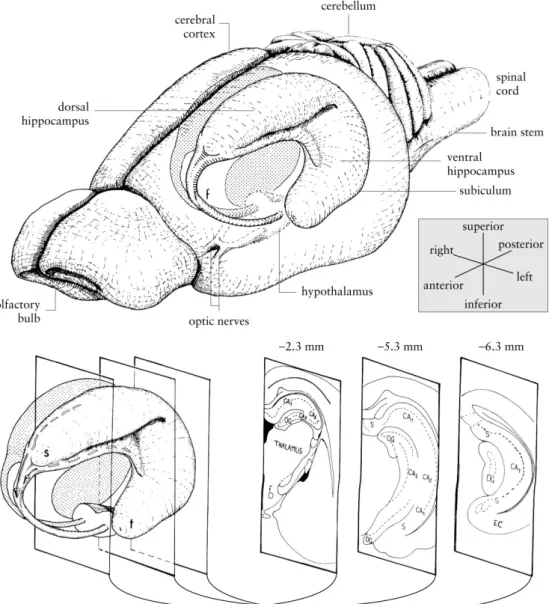
The hippocampus (Figure 1) is the major brain structure within the hippocampal formation (which it is part of along with the dentate gyrus, the subicular areas and the fimbria-fornix), in the medial temporal lobe of the brain. In the inside of the temporal lobe, it assumes a dorsal position relative to the hypothalamus and its septal-temporal axis has a semi-circular shape around the thalamus. The hippocampus has a cylindrical reniform shape and is duplicated in the two hemispheres.
Figure 1: Diagram of the rat’s hippocampus. In the upper part, the three-dimensional localization of the
hippocampus and surrounding structures; in the bottom panel, three coronal sections of the left hippocampus are presented (with their approximate anteroposterior coordinate relative to bregma). CA1, CA2, CA3 are the cornu ammonis 1-3 fields, DG stands for dentate gyrus, EC for entorhinal cortex; f for fornix; s for septal pole of the hippocampus, S for subiculum and t for temporal pole of the hippocampus. Adapted from (Cheung and Cardinal, 2005).
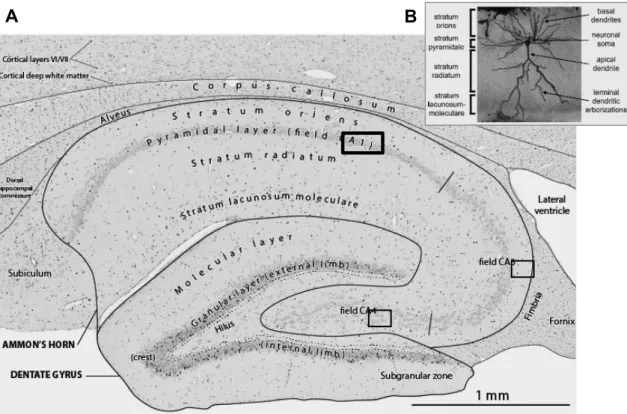
At the cellular level, the hippocampus is described as having layer histology (Figure 2). 3 layers appear more prominently – the polymorphic layer (stratum oriens), the pyramidal layer (stratum pyramidale) and the molecular one (stratum radiatum and stratum lacunosum-moleculare).
Pyramidal neurons are the most abundant neurons in the hippocampus and their cytoarchitecture is stratified into the distinct layers. Pyramidal cell’s bodies have an inverted conic (pyramidal) shape, with the diameter ranging between 20-40µm to 40-60 µm – the somas are comprised in the pyramidal layer, which forms a curved sheet with variable thickness (2 to 3 body cells). These cells have a fine apical dendrite (Ø 5-10µm) that extends through the entire molecular layer, whereas various basal dendrites stretch for 200-300µm to form the polymorphic layer. These cells’ morphology suffers slight modifications from the CA3 to the
CA1 regions (regions are defined in 1.2.3Neuronal circuits) – somas become smaller and the apical dendrites become longer, thinner and more with a more regular formation pattern (Alshuaib et al., 2001).
Figure 2: Rat hippocampus histology A Section of the dorsal hippocampus, stained by ³H-thymidine.
Small black dots mark cell’s nucleus. Adapted from Brain Development Maps (Website: ©2013 BrainDevelopmentMaps.org [Internet])B Rat hippocampal CA1 pyramidal neuron evidenced by Golgi-stained in section. The neuronal soma is located within the pyramidal layer (stratum pyramidale), basal dendrites overlap with the polymorphic layer (stratum oriens) and the apical dendrite crosses the molecular layer (stratum radium and stratum lacunosum-moleculare). Similar cells exist in other regions of the rat hippocampus, such as CA3, the dentate gyrus and subiculum. Adapted from (Shepherd et al., 2006).
The well-known and relatively simple structure of the hippocampus contributes for its utilization as an experimental model in diverse neuroscience scopes, namely the study of memory and learning, synaptic function and neuronal integration. Another advantage of this model is that it is fairly easy to isolate from the brain.
1.2.2 Function(s)
The hippocampus function has been widely studied (Bannerman Dm Fau - Rawlins et al.), as it is involved in memory, learning, information processing and subsequent consolidation and regulation of behaviour (D. Grant and Jarrard, 1968, Pothuizen et al., 2004). It is part of the limbic system, which also includes the parahippocampal gyrus, the fornix and fornix column, the olfactory bulbs, the amygdala, and the limbic cortex, among others.
From the famous “H.M. patient” (as Henry Molaison is usually refered to) (Scoville and Milner, 1957, Milner et al., 1998) onwards, the hippocampus’ role on memory formation has been corroborated by a full-hand of studies (Zola-Morgan et al., 1986, Jarrard, 1991, Squire, 1992, Nyberg et al., 1996, Stern et al., 1996, Rempel-Clower et al., 1996, Rombouts et al., 1997, Fernández et al., 1998, Moser and Moser, 1998). It is clear now that the hippocampus plays a critical role in encoding and retrieval of spatial memory (navigation) (O'Keefe and Dostrovsky, 1971, O'keefe and Nadel, 1978, Olton et al., 1978, Morris et al., 1982, O'Keefe and Speakman, 1987, Maguire et al., 1998, Morris et al., 1990, Nadel, 1991, Muller, 1996, Maguire et al., 1997, Alvarado et al., 2002, Jarrard et al., 2012). Moreover, some studies, in both humans (Zola-Morgan et al., 1986, Nyberg et al., 1996, Rempel-Clower et al., 1996, Stern et al., 1996, Rombouts et al., 1997, Vargha-Khadem et al., 1997, Fernández et al., 1998) and rats (Rawlins, 1985, Davidson and Jarrard, 1993, Rudy and Sutherland, 1995, Bunsey and Eichenbaum, 1995, Eichenbaum, 1996, Wallenstein et al., 1998), state that the hippocampus is also involved in the associative learning (mnemonic functions) that is non-relying on spatial strategies (Eichenbaum, 1996, Eichenbaum, 2004). The fact that different hippocampus-dependent memory functions are in place is understood as a consequence of diverse neuronal circuits that are constrained within the hippocampus structure (Moser and Moser, 1998).
1.2.3 Neuronal circuits
The major hippocampal neuronal circuit has been established – it is the one that connects the dentate gyrus, the CA3, the CA1 and the subiculum in an excitatory loop transversal to the hippocampus (Figure 2). As far as it is known, it is repeated all the way throughout the longitudinal axis of the hippocampus (Anderson et al., 1971). This circuit is essential for the consolidation of explicit memory, one of the four processes involved in the explicit knowledge formation (encoding, consolidation, storage and retrieval).
Still, neuronal networks within the hippocampus segments also appear to be heterogeneous - different neuronal constitutions have been described in the dorsal and ventral parts of the hippocampus (Gage et al., 1978, Gage and Thompson, 1980, Verney et al., 1985, Blasco-Ibáñez and Freund, 1997, Moser and Moser, 1998), in tandem with diverse excitability features (Racine et al., 1977, Gilbert et al., 1985) and functional correlates (Hughes, 1965, Nadel, 1968, Stevens and Cowey, 1973, Sinnamon et al., 1978, Volpe et al., 1992, Olsen et al., 1994, Kjelstrup et al., 2002, Bast et al., 2009, Fanselow and Dong, 2010, Felice et al., 2012, Tanaka et al., 2012).
1.2.4 Hippocampal subregions & the dorsoventral axis
Customarily, the hippocampus is divided in four subregions (Figure 2): CA1-3 and the dentate gyrus (sometimes CA4 is also referenced, and it is called hilus when considered part of
the dentate gyrus). CA1 region is the equivalent of Cajal’s hippocampus superior region and extends along almost all the hippocampus’ length.
Yet, from as far as the 1960’s, evidences in studies using cats started to reveal differences on the dorsal and ventral hippocampus’ outputs in the surrounding areas (stimulating either part of the structure) (Elul, 1964, Siegel and Flynn, 1968, Edinger et al., 1973, Kazarian et al., 1995), as well as on pathways with the surrounding brain regions (Siegel and Tassoni, 1971, Pasquier and Reinoso-Suarez, 1977) and some functional corollaries (D. Grant and Jarrard, 1968, Johnson et al., 1977). Studies on serotonin and norepinephrine suggested an uneven distribution of these neurotransmitters (uptake and binding affinities) along the rat hippocampus’ dorsal-ventral axis, (as well as the medial-lateral direction in the case of noradrenalin) (Gage et al., 1978, Gage and Thompson, 1980). These early studies have set the ground for the hypothesis that the hippocampus is anatomically, biochemically and functionally diverse throughout its dorsal-ventral axis. While some authors consider two parts (dorsal and ventral), other set three or more portions apart. As reviewed earlier, the intermediate hippocampus may have integrative functions of its own.
By the 2000’s, a series of behaviour tests had already been performed to discern the hippocampal functions – the involvement in spatial memory was established (Jarrard et al., 2012) and growing evidence suggested that it was the dorsal hippocampus that played the main role in learning and memory, while the behaviour-regulator roles of ventral hippocampus were beginning to be disclosed. This rose another set of questions regarding its heterogeneity along the longitudinal axis, namely regarding its neural substrates. Molecular and physiological differences provide the basis for the specific properties of dorsal and ventral hippocampus (Marcelin et al., 2012).
1.3 LATELY THE NUMBER OF ESSAYS
FOCUSING ON DORSAL-VENTRAL
ASYMMETRIES HAS ESCALATED
RAPIDLY. SOME OF THE MOST RELEVANT
RESULTS FOR THIS STUDY ARE
SUMMARIZED IN DORSAL-VENTRAL
ASYMMETRIES
Table 12 (Supplementary material: 6.1 Dorsal-ventral asymmetries), but more extensive
reviews can be found in (Moser and Moser, 1998, Bannerman Dm Fau - Rawlins et al., Eichenbaum, 2004, Van Strien et al., 2009, Fanselow and Dong, 2010, Poppenk et al., 2013).
1.4 CENTRAL NERVOUS SYSTEM
METABOLISM
Although not all the nervous system’s metabolic pathways have been disclosed, a major part of the energy metabolism is now known. It is an intricate highly regulated system involving various cell types, namely neurons, astrocytes and endothelial cells, as well as their interactions, giving reason to it sometimes being named as “neurovascular unit” (Byrne and Roberts, 2009).
1.4.1 Metabolism and insulin
This study will focus on the neuronal effects of carbohydrates metabolism rather than on the slower fatty acids one (the diet used for the animals of the present study contained 75.1% carbohydrates of total Atwater Fuel Energy of the rat’s diet).
Carbohydrates obtained in food are the organism’s provider of energy, apart from its own reserve. The organism is capable of storing carbohydrates, as glycogen, within the muscle and liver, and, as lipids, in fat cells. As availability of glucose reduces, the muscle resorts to glycogen to produce energy (for example during major effort such as intense exercise), whereas fat cells constitute a longer-term reserve. Glucose, which is the monosaccharide that results from the degradation of the ingested complex carbohydrates, is the main fuel of the brain.
There are two protein families involved in glucose’s transport through cell membranes: • Transporters – responsible for glucose’s absorption at the small intestines’ lumen and
reabsorption at the renal tubule; they are Na+/glucose symporters, promoting glucose’s transport against its concentration gradient (driven by high extracellular concentrations of sodium);
• Carriers – known as the “GLUT” (facilitative glucose transporters) family, they exist in every cell’s membrane and are classified accordingly, from GLUT1 to GLUT14, in three classes (Table 1).
Glucose homeostasis is controlled hormonally, by insulin and counter regulatory (or opposing) hormones. Insulin is an anabolic hormone, produced by β cells of the islets of Langerhans of the pancreas. It is released in a pulsatile manner according to the feeding cycle, since glucose stimulates its release and lack of glucose stimulates its storage. After eating, there is an abundance of glucose in the blood stream (“fed condition”). Under these circumstances, the insulin role is to prevent an abnormal rise of blood glucose levels. To accomplish this, insulin: 1) inhibits glucose’s release by the liver - the liver has the capacity to arrest the glucose on his cells by enzymatic (hexokinase or glucokinase) phosphorylation of the glucose molecule and possible storage as glycogen; 2) activates glucose uptake in the skeletal muscle cells (among others) and glycogenesis within it (conversion of glucose to glycogen); and 3)
stimulates storage of glucose in fat cells (conversion of glucose to triglycerides) once glycogen reserves are restored. Mechanisms 2 and 3 are mediated by a translocation of GLUT4 to the respective cell’s membrane, as in other circumstances the transporters are mainly trapped in the intracellular space and are therefore inactive.
This hormone also plays a critical role in protein and fat metabolism as, for example, it induces the amino acid transfer into the muscle and other cells, promoting their absorption and inhibiting their catabolism inside the cells (Fulks et al., 1975, Mayer et al., 2007). Insulin is also involved in the activation of cellular cascades and in synaptic facilitation (Craft and Stennis Watson, 2004).Numerous pathological conditions have been described as consequences of insulin’s malfunctions, namely diabetes, hypertension and obesity (Henquin, 2000).
Table 1: Glucose carriers (GLUT) family. Class, name, tissue distribution and function are defined for
each GLUT protein (gene SLC2). CNS Central Nervous system, Cb cerebellum, CTX cortex, Hp hippocampus, Hypo hypothalamus, LH lateral hypothalamus, PVN paraventricular hypothalamic nucleus, VMH ventromedial hypothalamus, n.d. not determined or not reported (grey). Adapted from (Olson and Pessin, 1996, Joost and Thorens, 2001, Wood and Trayhurn, 2003, McEwen and Reagan, 2004, Thorens and Mueckler, 2010)
GLUT
class
GLUT
Tissue expression
Function
Main In the CNS
Transport
Insulin
sensitive?
I GLUT1 Erythrocytes, brain, ubiquitous 45kDa isoform: Astrocytes, neurons widespread 55kDa isoform: Endothelial cells widespread Glucose NoI GLUT2 intestine, kidney Liver, pancreas,
Astrocytes, tanycytesin PVN, LH, VMH and Arcuate Glucose (low affinity), fructose No
I GLUT3 Brain (neuronal)
Neurons and neutrophil widespread
Glucose (high
affinity) No
I GLUT4 Heart, muscle, fat, brain
Neurons (somatodendritic) in Cb, CTX, Hp, Hypo Glucose (high affinity) Yes
II GLUT5 Intestine, testis, kidney widespread Microglia
Glucose (very low affinity),
fructose
No III GLUT6 Brain, spleen, leucocytes n.d. Glucose No II GLUT7 n.d. n.d. n.d. n.d. III GLUT8 Testis, brain, other
Neurons (somatodendritic)
widespread
Glucose blastocysts) No (yes in II GLUT9 Liver, kidney n.d. n.d. n.d.
1.4.1.1 Into the nervous system
The main energy substrate for the brain is glucose, which is metabolized by glycolysis and oxidative breakdown in both astrocytes and neurons.
There are only small pool-reserves of glucose in the brain (along with the also not extensive reserve glucose stored as glycogen). So that so that other substrates cannot substitute the continuous supply of glucose from blood to sustain brain function in the normal adult (Clarke and Sokoloff, 1999).
GLUT1 protein (55kDa isoform) is responsible for glucose’s transport across the blood– brain barrier. This transportation is not usually a rate-limiting step, instead it is thought that what adapts energy delivery to demand is a process known as neurovascular and neurometabolic coupling; i.e., neuronal activation triggers increased glucose consumption and glucose demand, stimulating blood flow and glucose transport over the blood–brain barrier (Leybaert, 2005, Leybaert et al., 2007).
Neurons take up glucose mainly via GLUT3 and perform aerobic cellular respiration to meet their energetic demands. However, great debate stands on whether it is the glucose directly uptaken or lactate supplied by astrocytes that is the major energy substrate (Chih et al., 2001, Schurr, 2005). Astrocytes enable a metabolic shuttle for energy supply to neurons, through uptake of glutamate in the tripartite synapse cleft (Magistretti and Pellerin, 1999).
In the rat’s hippocampus, the extracellular glucose concentration is reported in between 1,00–1,24 mmol/L (microdialysis, food available ad libitum (McNay and Gold, 1999)) and 2,6 mmol/L (glucose-sensitive micro-electrodes, food available ad libitum (Hu and Wilson, 1997)).On its turn, insulin is transported into the central nervous system by crossing the blood brain barrier under a saturable and highly regulated transport mechanism (capable of altering insulin flow during development and by fasting, obesity, hibernation, diabetes mellitus, Alzheimer’s disease, among other, and it is not evenly distributed in the central nervous system (Banks, 2004, Banks et al., 2012). This goes in accordance with insulin’s unique functions in
III GLUT10 Liver, pancreas n.d. Glucose No II GLUT11 Heart, muscle n.d.
Glucose (low affinity), fructose No III GLUT12 Heart, prostate, muscle, small intestine, fat n.d. n.d. Yes
III GLUT13 (HMIT) Brain n.d. H+-myo-inositol n.d. I GLUT14 Testes n.d. n.d. n.d.
the central nervous system, which resort to mechanisms somehow independent to role of insulin in the periphery (Banks et al., 2012).
1.4.2 Insulin
The present work focuses in a K+ channel (Kv1.3), which is insulin sensitive. Hence, some considerations about insulin and its receptor are due in the context of this introduction.
1.4.2.1 Receptor’s activation and signal transduction (Kv1.3)
Insulin runs promptly in the blood stream until it reaches the target tissues (liver, muscle, fat, brain), where it interacts with InsR, its cell surface receptor (Figure 3).
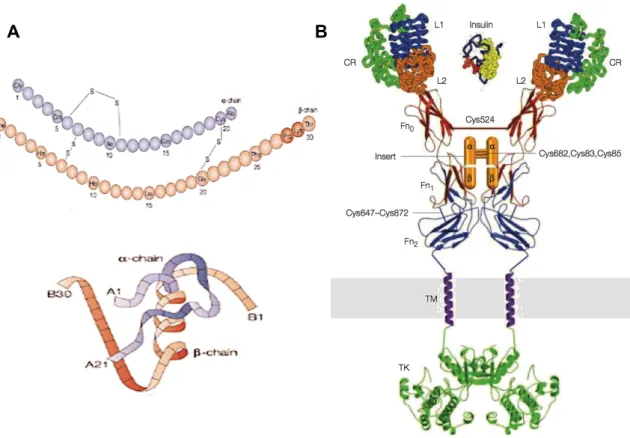
Figure 3: Insulin and its receptor. A Primary (upper part) and tertiary (lower part) insulin structures’
diagrams. Insulin is a 6kDa protein composed by two chains: chain A has 21 amino acids and has an intrachain disulphide bridge, while chain B has 30 amino acids. The two chains are connected by two disulphide bridges(Marchetti et al., 2008). Insulin’s active form is a monomer, but it also dimerizes or associates in hexamers (De Meyts, 2004, Dunn, 2005). Adapted from (Elsayed, 2012). B Insulin and its receptor’s supra-domain organization model. Insulin backbone is shown in blue, the membrane is represented as a grey band and TK is the Tyrosine kinase domain. The insulin receptor is produced and stored as a single-stranded high-weight precursor (210 kDa) with 3h half-life (Olson et al., 1988, De Meyts, 2004) The mature receptor is a tetramer composed by two α subunits (135kDa) and two β subunits (95kDa). Its tertiary structure is dominated by α helices and a strong structural stability (Chang et al., 1997). Adapted from (Marino-Buslje et al., 1999) and (De Meyts and Whittaker, 2002).
The insulin molecule binds to the extracellular α subunit (despite the presence of two binding sites, only one insulin molecule seems to fit the receptor dimer), inducing a conformational change that leads to the fast autophosphorylation of the receptor’s β subunit (that contains the tyrosine kinase enzymatic function). This is followed by the phosphorylation
of the insulin receptor substrate 1 (IRS1), a docking protein that induces the activation of down-stream pathways by binding to SH2 domains of various effector proteins (Gual et al., 2003). The IRS1-PI3K interaction activates the insulin signalling pathway (among others) that leads to increased glucose transportation into the cell by recruiting GLUT4 from an intracellular pool to the membrane (Kahn and White, 1988, Cheatham et al., 1994, Saltiel and Kahn, 2001), The insulin signalling pathway through MAPK drives to gene transcription, cell division and differentiation, as well as various others, as a growth promoter (Saltiel and Kahn, 2001).
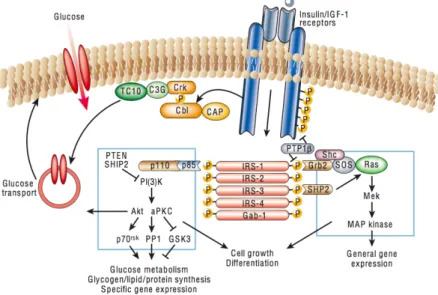
Figure 4 is a representation of some insulin-activated pathways, through InsR.
Figure 4:Signal transduction pathways induced by insulin receptor (InsR) activation. Upon activation by
an insulin molecule, the tyrosine kinase domain of the receptor induces its own phosphorylation, along with other cellular proteins, such as members of the IRS family, Shc and Cbl. These bind to SH2 domains of various effector proteins, such as PI3K, PKB and MAPK, leading to a broad range of signalling pathways. Consequently, glucose regulates the transport of specific vesicles trafficking, protein synthesis, enzyme activation and inactivation, and gene expression, which results in the regulation of glucose its, lipid and protein metabolism. Adapted from (Saltiel and Kahn, 2001).
1.4.2.2 Insulin, diabetes mellitus and Alzheimer disease
Diabetes is defined as a group of metabolic diseases characterized by hyperglycaemia as a consequence of malfunctions in insulin production, function or both. Chronic hyperglycaemia is associated with long-term damage and various organs dysfunction, namely eyes, kidneys, nerves, heart and blood vessels.
In type-1 diabetes (DMT1), insulin is absolutely absent due to autoimmune destruction of pancreatic β cells (auto-reactive T-lymphocytes produce antibodies anti-β cells). Classically, type-2 diabetes (DMT2) is defined as a metabolic disorder characterized by relative insulin deficits resulting of inadequate secretion of the hormone or of tissues reduced sensitivity to the molecule. However, nowadays, it is regarded as a 2 hit disease, meaning that insulin resistance has to be accompanied by a deficit in its secretion (Bergman et al., 2002, Kahn, 2003); it is not
known which starts and which follows but it is established that insulin resistance followed by compensatory hyperglycaemia is one of the earlier onsets of the disease (Gungor et al., 2005).
Alzheimer disease (AD) is characterized by a subtle decline in memory abilities extending to a generalized deterioration of adaptive and cognitive capacities (Watson and Craft, 2004), along with behaviour changes (apathy, agitation and psychosis) and physiological alterations (presence of neurofibrillary tangles and senile plaques, reduction of cerebral volume and alterations in the cholinergic system) in the central nervous system (Duff et al., 2000).
Diverse studies suggest that dysfunctions in glucose or insulin metabolism associate with cognitive impairment in AD. In fact, the inhibition of the insulin’s receptor in neurons has been suggested as an in vivo model for AD (Frölich et al., 1998, Hoyer and Lannert, 1999, Hoyer, 2002). AD patients revealed low InsR labelling and low tyrosine kinase activity (Frölich et al., 1998). This comes in accordance with the preposition that a decrease of the insulin levels and of the InsR expression result in lower levels of acetylcholine and decreased blood flow in the brain, since in AD’s initial stages glucose consumption is cutback by 45% (a AD sign before the first symptoms) and ATP production is reduced (Hoyer and Nitsch, 1989). Post-mortem analysis of AD patients’ brains also reveals a significant and increasing reduction of Ins/IGF trophic factors and their receptors (Rivera et al., 2005, Steen et al., 2005). Consistently, clinical research demonstrates that hyperinsulinemia (in euglycemia) facilitates memory formation in AD patients (Craft et al., 1996, Craft et al., 1999, Craft et al., 2003). Also, several lines of studies suggest that a lower insulin concentration might reduce the Aβ release from the intracellular compartment to the external one and therefore decelerate the disease’s progression.
All in all, there is supporting evidence to say that AD is related with insulin resistance. This idea has been proposed in the late 80’s (Hoyer and Nitsch, 1989) and now we have a clearer picture on how various aspects of AD can be explained in light of insulin’s signalling malfunctions (Schubert et al., 2003, de la Monte and Wands, 2005, Craft, 2007, Suzanne and Wands, 2008). Evidences on how insulin resistance conditions, such as obesity and DMT2, contribute to cognitive defects and neurodegeneration are several (de la Monte et al., 2009). Those include: DMT2 or obese patients have a higher risk of developing cognitive defects, dementia or AD (Pasquier et al., 2006); AD is accompanied by a progressive increase in resistance to insulin (Steen et al., 2005, Rivera et al., 2005, Craft, 2007); in experimental models, DMT2 causes cognitive deficiencies (Winocur et al., 2005).
Abnormal molecular, biochemical and mechanic characteristics are shared by AD and DMT2 (Nicolls, 2004) (de la Monte et al., 2006, Landreth, 2007, Reger et al., 2008) (Lester-Coll et al., 2006).
1.4.2.3 Insulin in neurophysiology
Insulin’s role in the periphery of the central nervous system (CNS) is well known, which is not the case of its role in the brain. Until recently, it was even a generalized belief that the brain was insensible to insulin. Lately however, contrary evidence has sprung up.
Multiple studies identified insulin receptor distributed in specific brain regions, such as the olfactory bulb, the hypothalamus, the hippocampus and the cerebellum (Unger et al., 1991, Schulingkamp et al., 2000). Plus, a minor portion of the insulin present in the brain is produced locally (Woods et al., 2003, Banks, 2004). In either case, the hormone had various functions through mechanisms diverse from its classical glucose-regulator role described for periphery (Banks et al., 2012). The studies advocate that insulin controls central nervous system mechanism such as the regulation of ingestion in the hypothalamus (Woods et al., 1979, Spanswick et al., 2000, Plum et al., 2005) and the olfaction in the olfactory bulb (Fadool et al., 2004, Das et al., 2005, Plum et al., 2005). In addition, insulin has also been described as a memory and learning potentiator – intracerebroventricular injections improve learning tasks performance in rats (Fehm et al., 2000) and intravenous injections improve story recall abilities(Craft et al., 1999). Interestingly, animal that had been subjected to water maze training also revealed more hippocampal expression of InsR mRNA ad protein, namely in CA1 pyramidal neurons (Zhao et al., 1999).
1.4.2.3.1 Insulin as a neuroprotector
Insulin has well-known neuroprotective properties (Venters et al., 2001), as it promotes neurogenesis (Åberg et al., 2000) and synapses formation, as well as potentiating the most effective glucose utilization in the brain (Carro et al., 2001). Moreover, it is documented that insulin protects the neurons from the Aβ aggregates in AD (Klein, 2002, Nelson et al., 2008) and from the oxidative stress that they cause (Moreira et al., 2005, Duarte et al., 2008). Still, the mechanism by which insulin acts as a protector is not yet clarified, even though some evidence suggests that it is via the PKB-akt pathway (Bayascas, 2008).
1.4.2.3.2 Insulin as a neuromodulator
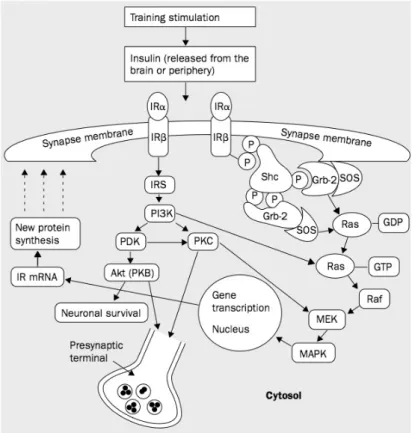
A possible explanation for the insulin’s and its receptor’s role in learning an memory is that it acts as a neuromodulator in events related to synaptic plasticity (Zhao and Alkon, 2001) (Figure 5). Among these events, LTP (long term potentiation) and LTD (long term depression) stand out. Besides, it seems to be involved in neuronal survivor (Zhao and Alkon, 2001) (Gasparini et al., 2002). Results described previously in 1.4.2.2 (Insulin, diabetes mellitus and Alzheimer disease) that advocated the insulin resistance as related to AD fit in this insulin role model (Gasparini et al., 2002, Craft and Stennis Watson, 2004).
Figure 5: Insulin receptor (represented as IR) modulated pathways in neurons, which are involved in
learning and LTP formation. Insulin activates the downstream pathways, through the catalytical function of its receptor, reviewed previously for periphery cells (Figure 4). InsR activation induces the activation of a signalling cascade involving Shc, Grb-2/SOS and Ras/ MAPK shortly after memory training, a pathway involved in long-term memory formation through activation of gene expression leading to new protein synthesis. By activating a cross talk with other protein tyrosine kinases, such as pp60c-src, InsR also regulates short-term memory formation. Insulin (and other InsR agonists) may also modulate other memory formation processes and neuronal survival through PI3K, PKC, Akt/PKB and Ras/MEK/MAPK. Adapted from (Zhao and Alkon, 2001).
Results in rats that postulate that InsR absence (InsR knock-out animals) resulted in impaired learning and memory capacity. Heterozygotic animals (InsR+/-) revealed problems in short term (1h) and long term (24h) memory when faced with known-objects recognition tasks. Also, cultured neurons from InsR+/-and homozygotic animals (InsR-/-) olfactory bulb had lower current peak amplitude than wild type (wt) cultured neurons. Summing up, these results suggest that the loss of one or both InsR alleles modifies the electric performance phenotype in olfactory bulb neurons underlying learning and memory deficits, an event probably related to diminished Kv1.3 protein expression (Fadool et al., 2000).
Insulin is then proposed as a neuroexcitability modulator. Further evidence for this thesis is that insulin’s actions upon specific neuronal mechanisms related to K+ conductance alter the neuron’s neuroexcitability profile. Contrary to what happens in peripheral tissues, fasting increases insulin’s levels in the olfactory bulb, which results in an inhibition of Kv1.3 currents that is translated to increased excitability and a more refined olfactory sense (Das et al., 2005). Kv1.3’s inhibition by insulin is mediated by Kv1.3 channel phosphorylation. Kv1.3 and InsR were co-transfected in cultured cells, and a major outward current was observed (due to
increased K+ currents). This current was then significantly decreased by insulin application onto the superfusing medium. In parallel, Kv1.3 had been phosphorylated in various residues. However, cells co-transfected with Kv1.3 and truncated InsR (without the tyrosine kinase domain) showed no K+ current inhibition by insulin superfusion neither Kv1.3 phosphorylation (Fadool et al., 2000).
In fact, Kv1.3 knockdown mice neurons also have altered neuroexcitability, are not sensible to insulin and the animals have an above-average olfactory sensibility (“super-smellers”) (Fadool et al., 2004), giving further support to the previous assumption of Kv1.3 mediated insulin action.
Insulin’s effect upon Kv channels was also verified in differentiated neuroblastoma cells (N1E-115) and results show a clear reduction of two current components, in a concentration-dependent manner (Lima et al., 2008).
Furthermore, in the hypothalamus, insulin has been described as a KATP activator that causes a neuronal hyperpolarization that is translated as a decrease in glucose consumption (Woods et al., 1979, Spanswick et al., 2000). In the hippocampus, however, the effect of insulin and IGF (insulin growth factor) seems to be more complex than in cell lines or in the hypothalamus. Results showing an upregulation of BK mediated currents’ conductance and reduced neuroexcitability by insulin (O’Malley et al., 2003, O'Malley and Harvey, 2004)contrast with results exhibiting a dowregulation of Kv currents and increased neuroexcitability by IGF-1 (O’Malley et al., 2003, O'Malley and Harvey, 2004). Further support is given to the insulin-sensitive Kv current by recent results that reveal that insulin inhibit specifically the slow component of Kv currents in rats’ CA1 isolated cells, whereas the fast component (corresponding to the A-current) is not affected (Lima et al., 2008). These results are further developed in 1.8 (Framework of the Project), as they give support for this project’s thesis.
1.5 NEURONAL EXCITABILITY & IONIC
CHANNELS
In the basis of neuroexcitability are ion channels, receptors (ionotropic and metaboltropic), transporters and pumps. Electrical signals result from temporary local changes that drive the resting potential away from it’s resting value and are propagated throughout a neuron or nervous fibre. Ion channels mediate those alterations.
Since over 100 types of ion channels have been described so far, and new ones are being described: a systematic classification is in place. Ion channels are divided into families
depending on amino acid structure and function (ion selectivity, gating). Regarding function, channels are divided in:
! Voltage-gated channels: a change in the voltage across membrane is the trigger. Usually they are subdivided according to the ion selectivity (voltage-gated Na+/K+/Ca2+ channels - many subtypes within each category);
! Ligand-gated channels: the binding of a chemical ligand (either extracellular, for instance a neurotransmitter, or intracellular, for example an ion or a nucleotide) is the stimuli. Often these channels are subdivided according to the type of ligand;
! Mechanically-gated channels: a mechanical stress (for example the stretch of the membrane itself) is the stimuli. Gap-junction channels are an example of this kind of channel.
This family classification is not sealed however, since channels can be gated by more than one stimulus (often voltage and ligand).
Here, we will focus on voltage-activated channels, namely voltage activated K+ channels.
1.6 POTASSIUM CURRENTS AND
CHANNELS
K+ selective ion channels is the larger and most diverse group of ionic channels, considering that 70 loci have been identified in the mammalian’s genome coding for its principal subunits (Gutman et al., 2005), and that they can undergo alternative splicing, RNA editing, post-translational modifications and heteromeric assembly. Since 1987, when the first gene codifying for a K+ channel has been cloned (Papazian et al., 1987), dozens of genes have been identified that share the selectivity pore signature sequence (Gutman et al., 2005).
In excitable cells, K+ channels are involved in the stabilization of the membrane potential, since they converge the resting membrane potential to the K+ equilibrium potential, lowering it, and therefore keeping it away from the action potential firing threshold (Hille, 1992). Hence, they are critical to neuroexcitability. Not only they establish the resting potential but also keep the depolarization in the action potential short, are involved in shortening periods of high activity, keep a time separation between repetitive spikes and tend to diminish the excitatory inputs efficacy in the cell (Hille, 1992). Hence, as K+ has a negative reversal potential, these cells tend to dampen excitation (Hille, 1992).
1.6.1 Potassium channel structure and groups
The K+ channel was the first natural membrane channel for which crystallization and high-resolution real structure analysis was done (Doyle et al., 1998). This speaks of its biological relevance.
Concerning the function, their structure reveals a hydrophilic conducting pore, lined by a pore-loop responsible for the K+ selectivity and a gating mechanism that supports the open/close/inactive/desensitized states (Hille, 1992). It is the selectivity pore segment – TXXTXGYG (Heginbotham et al., 1994) – which is homologous in all the genes codifying for potassium channels that defines them as belonging to this category.
More particularly, four α subunits (also named pore-forming or principal subunits) assemble as a homotetramer or a heterotetramer of one or two subunits with fourfold symmetry around the central pore, determining the infrastructure of the channel. Other subunits, with similar structure to the α ones, are often necessary for functional channel formation – these are called coassembly principal subunits. β subunits (or auxiliary proteins), with distinct sequences, also often interact with the principal subunits complex, usually altering their electrophysiological or biophysical properties, expression levels or expression patterns (Coetzee et al., 1999). Associated proteins, such as regulatory proteins or elements of the cytoskeleton, are also sometimes in play. Due to the possible combinations, the number of possible distinct K+ channels is by the hundreds, if not thousands (Coetzee et al., 1999).
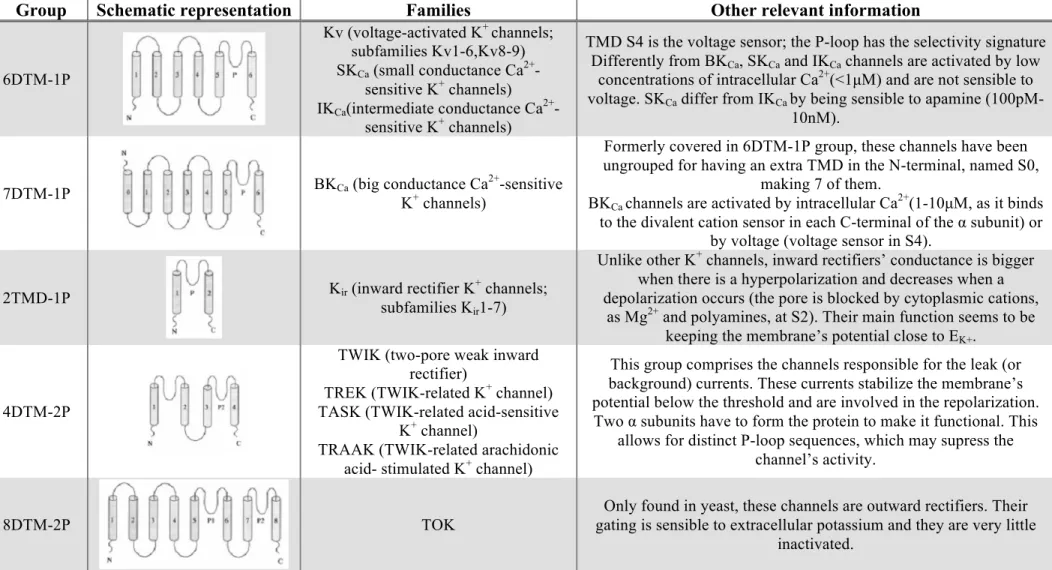
The customary classification system of K+ channels is based upon structural properties of the main protein that composes the channel. Groups are structural classes established according to the α subunit’s number of transmembranar domains (TMD’s) and porous loops (P-loops). They then comprise families, classified by the amino acid sequence homology, which are further divided into subfamilies. Table 2 frames the five known groups of potassium channels.
Different potassium channel subpopulations have different operating profiles and therefore assume different functions in the cell. A fair representation of the variability of these channels and supposed function is the age-dependent axonal expression of some of these proteins described in (Pruss et al., 2010).
Table 2: Potassium channels groups, their schematic information (TMD’s are represented by grey cylinders; P stands for the P-loops numbers; N and C represent the protein’s
amine and carboxyl terminals), families and other relevant information. Adapted from (Robbins, 2001)
Group
Schematic representation
Families
Other relevant information
6DTM-1P Kv (voltage-activated K+ channels; subfamilies Kv1-6,Kv8-9) SKCa (small conductance Ca2+ -sensitive K+ channels) IKCa(intermediate conductance Ca2+ -sensitive K+ channels)
TMD S4 is the voltage sensor; the P-loop has the selectivity signature Differently fromBKCa, SKCa and IKCa channels are activated by low
concentrations of intracellular Ca2+(<1µM) and are not sensible to voltage. SKCa differ from IKCaby being sensible to apamine (100pM-
10nM).
7DTM-1P BKCa (big conductance CaK+ channels) 2+-sensitive
Formerly covered in 6DTM-1P group, these channels have been ungrouped for having an extra TMD in the N-terminal, named S0,
making 7 of them.
BKCa channels are activated by intracellular Ca2+(1-10µM, as it binds to the divalent cation sensor in each C-terminal of the α subunit) or
by voltage (voltage sensor in S4).
2TMD-1P Kir (inward rectifier K+ channels;
subfamilies Kir1-7)
Unlike other K+ channels, inward rectifiers’ conductance is bigger when there is a hyperpolarization and decreases when a depolarization occurs (the pore is blocked by cytoplasmic cations,
as Mg2+ and polyamines, at S2). Their main function seems to be keeping the membrane’s potential close to EK+.
4DTM-2P
TWIK (two-pore weak inward rectifier)
TREK (TWIK-related K+ channel) TASK (TWIK-related acid-sensitive
K+ channel)
TRAAK (TWIK-related arachidonic acid- stimulated K+ channel)
This group comprises the channels responsible for the leak (or background) currents. These currents stabilize the membrane’s potential below the threshold and are involved in the repolarization. Two α subunits have to form the protein to make it functional. This
allows for distinct P-loop sequences, which may supress the channel’s activity.
8DTM-2P TOK
Only found in yeast, these channels are outward rectifiers. Their gating is sensible to extracellular potassium and they are very little
inactivated. a) 6DTM-1P b) 7DTM-1P c) 2DTM-1P e) 8DTM-2P d) 4DTM-2P Kv IKCa/SKCa BKCa Kir TWIK TREK TASK TRAAK TOK a) 6DTM-1P b) 7DTM-1P c) 2DTM-1P e) 8DTM-2P d) 4DTM-2P Kv IKCa/SKCa BKCa Kir TWIK TREK TASK TRAAK TOK a) 6DTM-1P b) 7DTM-1P c) 2DTM-1P e) 8DTM-2P d) 4DTM-2P Kv IKCa/SKCa BKCa Kir TWIK TREK TASK TRAAK TOK a) 6DTM-1P b) 7DTM-1P c) 2DTM-1P e) 8DTM-2P d) 4DTM-2P Kv IKCa/SKCa BKCa Kir TWIK TREK TASK TRAAK TOK a) 6DTM-1P b) 7DTM-1P c) 2DTM-1P e) 8DTM-2P d) 4DTM-2P Kv IKCa/SKCa BKCa Kir TWIKTREK TASK TRAAK TOK a) 6DTM-1P b) 7DTM-1P c) 2DTM-1P e) 8DTM-2P d) 4DTM-2P Kv IKCa/SKCa BKCa Kir TWIKTREK TASK TRAAK TOK a) 6DTM-1P b) 7DTM-1P c) 2DTM-1P e) 8DTM-2P d) 4DTM-2P Kv IKCa/SKCa BKCa Kir TWIK TREK TASK TRAAK TOK a) 6DTM-1P b) 7DTM-1P c) 2DTM-1P e) 8DTM-2P d) 4DTM-2P Kv IKCa/SKCa BKCa Kir TWIK TREK TASK TRAAK TOK a) 6DTM-1P b) 7DTM-1P c) 2DTM-1P e) 8DTM-2P d) 4DTM-2P Kv IKCa/SKCa BKCa Kir TWIK TREK TASK TRAAK TOK a) 6DTM-1P b) 7DTM-1P c) 2DTM-1P e) 8DTM-2P d) 4DTM-2P Kv IKCa/SKCa BKCa Kir TWIK TREK TASK TRAAK TOK
1.6.2 Voltage-dependent potassium channels
Voltage-gated channels are found in main cell types such as neuronal, skeletal and cardiac cells. They open and close in response to voltage change across the plasma membrane and as a result an action potential can arise.
In the brain, potassium voltage-gated potassium channels (Kv’s) are highly relevant for flow and processing of information, given that they complete the action potential, repolarize the membrane, determine the resting potential and regulate the neurotransmitters’ release in the pre-synaptic terminal (Gutman et al., 2005). In addition, each cell has its own unique set of Kv’s (different in terms of voltage-dependence, activation and inactivation rates and pharmacology), which supports the impressive diversity and large number of Kv’s in the brain(Robbins, 2001).
1.6.2.1 Structure, activation and selectivity
All voltage-dependent ion channels share the same basic structural themes (for instance the Kvα subunit is similar to the motif that is repeated 4 times in Nav and Cav α subunits). The major functional domains are the following:
• Ion selectivity filter (selective for Na+ or K+ or Ca2+);
• Gate opens and closes, controlled by a voltage sensor (positively charged amino acids), which responds to the level of the membrane potential;
• Inactivation gate, which limits the period of time the channel remains open, despite steady stimulation.
Regarding potassium voltage-gated channels (Figure 6), typically they are composed by four identical (or similar) transmembranar α subunits surrounding a central pore. Both N- and C-termini of the protein in the intracellular part of the membrane (the N-terminus has a role as the inactivation gate and the C-terminus as the determinant for channel localization within the membrane, with a PDZ-binding motif). Each αsub-unit is composed by six transmembranar segments (S1-6) and loops. Amino acid domains are the ones that dictate each segment length and function (usually related to the amino acid charge or other properties).
The selectivity filter is in the narrowest part of the pore and is formed by the smaller loop, between S5 and S6.S4 transmembranar domain is the voltage sensor, acquiring its cationic properties from arginine and lysine amino acids. At rest, this positively charged domain (which exists four times due to the existence of 4 αsub-units) is attracted to the inner residues of S2 and S3. When a depolarization occurs, this domain is electrostatically repelled and rotates from slanted to a more upright position, which permits ion conductance through the channel.
It is the N-terminus of the protein (green in Figure 6A and C) that acts as the inactivation gate.
Exception is made to this structure in voltage-gated KCNQ and eag/erg channels, as well as channels gated coordinately by voltage and ligand binding (BK Ca2+-activated channels and HCN hyperpolarization and nucleotide-gated channels), and channels gated exclusively by intracellular ligands (CNG channels and SK channels).
Figure 6: Schematic diagram of a voltage-activated potassium channel. A Composition of a typical
voltage-gated K+ channel α subunit, displaying the six transmembranar domains (S1-6) and the selectivity
filter (P); the membrane is represented as a grey band. B The bacterial KcsA K+ channel as a prototype for the pore-forming domain of the channel: the interior of the protein is dark green, with secondary structure shown as ribbons for three of the four subunits, and the water-exposed surface of the protein is grey; the selectivity filter is highlighted, with the extended selectivity filter loop supported by the pore helices. The four spheres mark the four K+ ion binding sites: these are typically occupied by alternating K+ ions and water molecules. C Kv1.x–Kv4.x subfamily’s protein complex; the tetramerization domain'
(T1, purple)determines the specificity of subunit assembly and interacts with possible β sub-units as well as with other proteins; the inactivation gate is in green; the membrane is represented by the grey band.
ABC Adapted from (Yellen, 2002). D Voltage-gating mechanism shows the four S4 transmembranar
domains making a rotary movement enabling the channel’s aperture.
1.6.2.2 Voltage-dependent potassium channels groups
The Kv channel family is a very diverse and abundant group of ion channels, due to their importance, versatility and specificity.
A
B
Table 3 frames the known Kv subfamilies – it presents the subfamily name (according
to the International Union of Pharmacology, IUPHAR), the gene locus, its functional correlates and tissue distribution.
These channels are much more diverse than one could predict from the gene loci that codify them. The diversity arises from several factors(Gutman et al., 2005):
i. Heteromultimerization enables the channel to be formed from either four identical subunits or from four different ones (from the same family – Kv1, K7, Kv10);
ii. “Modifier” subunits, which are not functional by themselves but form heterotetramers with Kv2 family subunits, enlarging its diversity;
iii. Accessory proteins (including β-subunits) may alter channel’s properties; iv. Alternate mRNA splicing (mainly in Kv3,4,6,7,9,10,11 subfamilies);
v. Post-translation modifications (primarily phosphorylation, but also ubiquitinylation and palmitoylation).
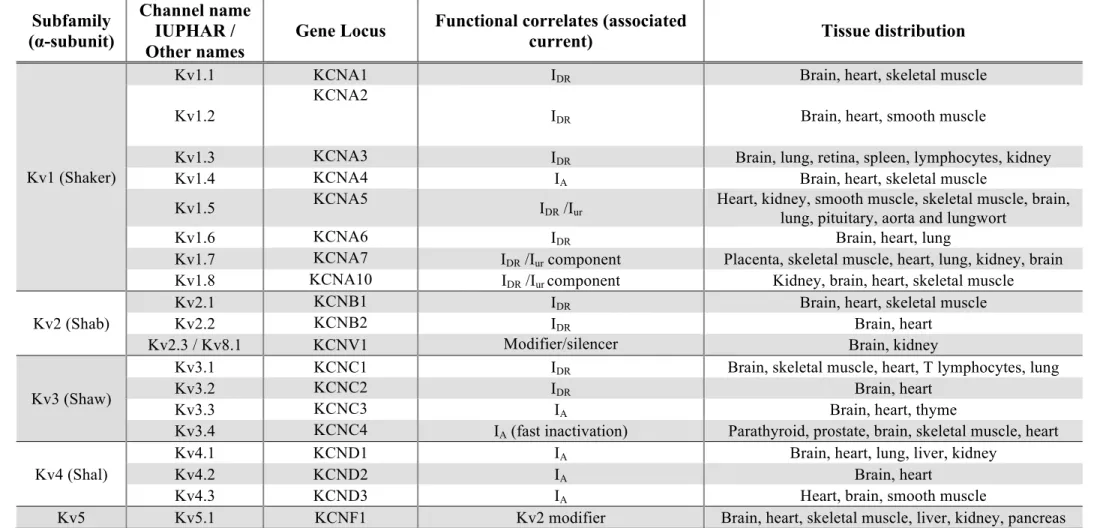
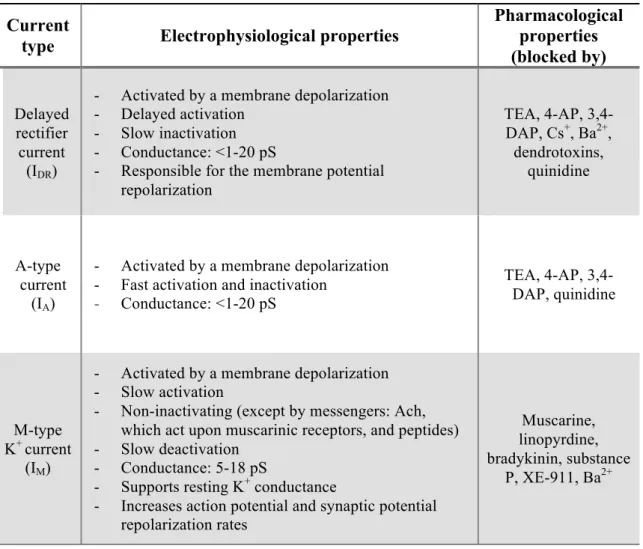
From Table 3, one can also infer that voltage-activated potassium channels are the molecular basis for mainly three types of currents – delayed rectifier current (IDR), A-type current (IA) and M-type K+ current (IM). Table 4 states their main electrophysiological and pharmacological properties. More comprehensive information can be found in (Coetzee et al., 1999), (Gutman et al., 2005) and in (Shieh et al., 2000).
Table 3: Potassium dependent channels subfamilies (α-subunit, channel names, gene locus, functional correlates and tissue distribution). Kv states for
voltage-dependent K+ channel, EAG ether-a-go-go K+ channel, ELK ether-a-go-go-like K+ channel, (h)ERG (human) ether-a-go-go-related K+ channel, I
DR(S) (slow) delayed rectifier
current, IDR(R) rapid component of delayed rectifier current (heart), IA A-type current, Iur ultrarapid delayed rectifier current, IcAMP cAMP-activated K+ current, IM M-type K+
current. Adapted from (Coetzee et al., 1999, Robbins, 2001, Gutman et al., 2005, Shieh et al., 2000).
Subfamily
(α-subunit)
Channel name
IUPHAR /
Other names
Gene Locus
Functional correlates (associated
current)
Tissue distribution
Kv1 (Shaker)
Kv1.1 KCNA1 IDR Brain, heart, skeletal muscle
Kv1.2
KCNA2
IDR Brain, heart, smooth muscle
Kv1.3 KCNA3 IDR Brain, lung, retina, spleen, lymphocytes, kidney
Kv1.4 KCNA4 IA Brain, heart, skeletal muscle
Kv1.5 KCNA5 IDR /Iur Heart, kidney, smooth muscle, skeletal muscle, brain,
lung, pituitary, aorta and lungwort
Kv1.6 KCNA6 IDR Brain, heart, lung
Kv1.7 KCNA7 IDR /Iur component Placenta, skeletal muscle, heart, lung, kidney, brain
Kv1.8 KCNA10 IDR /Iur component Kidney, brain, heart, skeletal muscle
Kv2 (Shab)
Kv2.1 KCNB1 IDR Brain, heart, skeletal muscle
Kv2.2 KCNB2 IDR Brain, heart
Kv2.3 / Kv8.1 KCNV1 Modifier/silencer Brain, kidney
Kv3 (Shaw)
Kv3.1 KCNC1 IDR Brain, skeletal muscle, heart, T lymphocytes, lung
Kv3.2 KCNC2 IDR Brain, heart
Kv3.3 KCNC3 IA Brain, heart, thyme
Kv3.4 KCNC4 IA (fast inactivation) Parathyroid, prostate, brain, skeletal muscle, heart
Kv4 (Shal)
Kv4.1 KCND1 IA Brain, heart, lung, liver, kidney
Kv4.2 KCND2 IA Brain, heart
Kv4.3 KCND3 IA Heart, brain, smooth muscle
Kv6
Kv6.1 KCNG1 Kv2 Skeletal muscle, brain, uterus, ovary, liver, kidney, lung
Kv6.2 KCNG2 Kv2 modifier/silencer Heart, brain
Kv6.3 KCNG3 Modifier/silencer Brain
Kv6.4 KCNG4 Modifier/silencer Brain, liver, small intestine, colon
Kv7
Kv7.1 / KVLQT1 KCNQ1 IDR(S) (with KCNE1)
IcAMP (with KCN3) Heart, kidney, lung, pancreas, placenta
Kv7.2 / KQT2 KCNQ2 IM Brain, heart, neuroblastoma cells
Kv7.3 / KQT3 KCNQ3 IM Brain
Kv7.4 / KQT4 KCNQ4 IL Cochlea, placenta
Kv8 Kv8.1 / Kv2.3 KCNV1 Modifier/silencer Brain, kidney
Kv8.2 KCNV2 Modifier/silencer Lung, liver, kidney, pancreas, spleen, thyme
Kv9
Kv9.1 KCNS1 Modifier/silencer Brain
Kv9.2 KCNS2 Modifier/silencer Brain
Kv9.3 KCNS3 Modifier/silencer Brain, heart, kidney, lung
Kv10 Kv10.1 / eag1 KCNH1 IDR Brain, skeletal muscle, tumours
Kv10.2 / eag2 KCNH5 IDR (non inactivating) Brain
Kv11
Kv11.1 / erg1 / HERG
KCNH2 IDR(R) (inwardly rectifying properties) Heart, brain, neuroblastoma cells
Kv11.2 / erg2 KCNH6 --- Brain, neuroblastoma cells
Kv11.3 / erg3 KCNH7 --- Brain
Kv12
Kv12.1 / elk1, elk3
KCNH8 (slow activation and inactivation) Sympathetic ganglia, brain
Kv12.2 / elk2 KCNH3 --- Brain, tumours