Application of the Taguchi’s Loss Function in the Breeding
of Nile Tilapia Fed with Different Levels of Alcohol Yeast
Vandir Medri
1*, Geni Varéa Pereira
2and Júlio Hermann Leonhardt
3 1Departamento de Matemática Aplicada, Universidade Estadual de Londrina, Campus Universitário, 86051-990, Londrina, PR. 2Departamento de Bioquímica, Universidade Estadual de Londrina, Campus Universitário, 86051-990, Londrina, PR. 3Departamento de Biologia Animal e Vegetal, Universidade Estadual de Londrina, Campus Universitário, 86051-990, Londrina, PR – Brasil.
ABSTRACT
Studies were conducted to evaluate the effect of 10%, 20% and 30% ration substitutions for distillery yeast on the function Taguchi’s loss using two hundred and forty 45-day-old fingerlings of Nile tilapia (Oreochromis niloticus), sexually reverted with an initial average weight of 1.25 ± 0.14 g placed in amianthus box.. The average results obtained for the limnological parameters of the water quality control through chemical analysis were considered normal. Taguchi’s losses for the total production, for the dead and discarded fishes did not show correlation for the different levels of alcohol yeast inclusion, showing that the choice of the yeast level in the ration for these fishes depended on its availability and occasional cost. It was observed that the losses, specially those in the amianthus boxes, could be attributed to the density limitation, absence of natural feeding and great dispersion in the fishe size.
Key words: quality, ration, Taguchi, tilapia, yeast.
*Author for correspondence
INTRODUCTION
Yeast, the by-product of alcoholic fermentation, could be an important alternative of protein on formulation of animal ration, so that high levels of protein, carbohydrates, lipids, etereo extract, vitamins and minerals are obtained (Mattos, 1984). The first report on the use of yeast in fish breeding was by Tunison et al., (1942). Alves
(1988), write waking on trout breeding to determinate its needs of thiamin, riboflavin and nicotinic acid, reported that gills diseases caused by nutritive deficiency could be reduced by adding dried yeast in the fish diet. According to NAS-NRC, (1993), the substitution of the conventional ingredients is advisable to lower the diet costs, however, it is necessary to be informed about the biologic worth of this products. Tilapias are able to utilize the remains of agroindustry such as yeast, besides the possibility to assimilate carbohydrates contained in the vegetable ration ingredients. Young tilapia eat mainly zooplancton and phitoplancton; while the adults, accept a variety of artificial food, vegetables, larvae and insects (Castagnolli, 1992; Wu et al., 1995).
The Taguchi’s loss function or the quality function is defined as the value of the monetary loss expected, caused by the characteristic deviation of performance, relating to the wished value or a specific value. This concept of loss shows a new thought of investments in quality improvement, because in a competitive economy, the continuos improvement of the quality and the reduction of costs are necessary to keep the product in market (Kackar, 1986). The loss considered here are calculated in monetary values and are associated to quantifiable characteristics of the product.
Taguchi et al. (1990), hipothesised that the
one loss is summed to the others individual losses. In other words each unity causes a loss, which is not kept to the owner, but is distributed to all the society (Stange, 1996, mentioned by Medri,1997). The value of the monetary loss caused by the quality decrease could be refated with the removal of the nominal value (m) of the specification. It was shown to be a quadratic function. The maximum value was obtained when the deviation exceeded the specification limits (Taguchi et al., 1990; Guedes, 1996).
When the loss function grows symmetrically with the deviation of the functional characteristics round the normal value, “the nominal is the best one”. Phadke (1989), extended this concept to other two special cases of functional characteristics of quality: “The smaller is the best one” and “the biggest is the best one”.
The objective this study was to verify if there was correlation of the Taguchi’s loss function for the total production, for the dead and rejected fishes and the between four rations isoproteic balanced (28% PB) and isocaloric
balanced (2933 Kcal/Kg) with T1=0% (standard group), T2=10%, T3=20% and T4=30% (tested groups) of yeast from alcoholic distillery exceeding.
MATERIALS AND METHODS
Two hundred and forty fingerlings of Nile tilapia (Oreochromis niloticus), ceded by the
Fish Breeding Station of the Animal and Vegetal Department of Biology of the Biological Science Center of the Universidade Estadual de Londrina, mesured the initial average weight and length of the fingerlings were 1.25 ± 0,14 g and 3.84 ± 0.17 cm respectively. The fishes were reverted by the supply of rations with
60mg/kg of diet of the male hormone 17α –
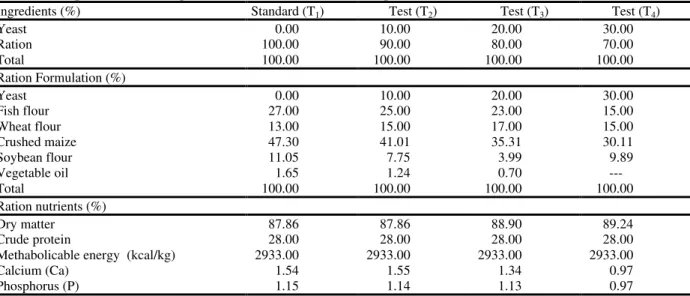
metiltestosterone during a period of 30 days. A computational program was utilized to elaborate the ration BRUN10 with the needs of the mentioned species. The four isoproteic (28% PB) and isocaloric balanced rations (2933Kcal/kg) with 0 (control group), 10, 20 and 30% (tested groups) of yeast from alcoholic distillery exceeding are shown in Table 1.
Table 1. Composition of the experimental rations for the Nile tilapia.
Ingredients (%) Standard (T1) Test (T2) Test (T3) Test (T4)
Yeast 0.00 10.00 20.00 30.00
Ration 100.00 90.00 80.00 70.00
Total 100.00 100.00 100.00 100.00
Ration Formulation (%)
Yeast 0.00 10.00 20.00 30.00
Fish flour 27.00 25.00 23.00 15.00
Wheat flour 13.00 15.00 17.00 15.00
Crushed maize 47.30 41.01 35.31 30.11
Soybean flour 11.05 7.75 3.99 9.89
Vegetable oil 1.65 1.24 0.70
---Total 100.00 100.00 100.00 100.00
Ration nutrients (%)
Dry matter 87.86 87.86 88.90 89.24
Crude protein 28.00 28.00 28.00 28.00
Methabolicable energy (kcal/kg) 2933.00 2933.00 2933.00 2933.00
Calcium (Ca) 1.54 1.55 1.34 0.97
Phosphorus (P) 1.15 1.14 1.13 0.97
The fingerlings were randomly distributed in 12 groups of 20 individuals, each group was placed in an amianthus box with capacity of 500 l, with continuos aeration and water exchange. They were supplied with water from a semi-artesian
uncommon behaviour, morphological variation and death. The experimental period was 330 days (15/03/95 to 15/02/96).
Using a paquimeter and a balance of precision, the total weight (Wt), in grams, and the total length of the fishes (Lt), in centimeters, were monthly measured. The water temperature was checked every day with a mercury thermometer. Monthly, the alkalinity was measured through the addition method, the dissolved oxygen through Winkler method, ammonia through photometer method of Berthelot, nitrite through Griess-Hosvay, total phosphorus and dissolvable phosphorus through Murphy and pH through potentiometer. The methodology used to test these parameters was according to Lind (1979)
and Standard Methods (1980). Each treatment named (T) was given to three groups of fishes (triplicate). The fingerlings were daily fed according to Wilson (1991).
The functional characteristic of quality it was used: “the biggest one is the best”. In this case, the best value was not defined, the bigger was the characteristic value (fish weight) the better it was. The loss caused by a fish that has passed the inferior limit of tolerance was represented by A, and its corresponding deviation was ∆A. The function was expressed by:
L (Y) = K [1/Y2] = A ∆2 v2 (Phadke, 1989).
Calculus of cost of each fish
P1 = ration + yeast + fingerling + population + biometry + medicines + ... + disfishery
P2 = ration + yeast + fingerling + population + biometry + medicines + ... + disfishery
... = ... + ... + ... + ... + ... + ... + .. + ...
Pk = ration + yeast + fingerling + population + biometry + medicines + ... + disfishery
...
.
1
k
∑
P
i=
1k
∑
( ration + yeast + fingerling + population + biometry + medicines + ... + disfishery)
A calculus;
∑
=
=
ki i
P
k
A
1
.
1
com i = 1, 2, ... , k;
where k is the number of fishes and A is the loss caused by fishes that passed the inferior limit of tolerance.
The fish production that presented high dispersion would have a higher cost on account to the rejects and consequently bigger quality
loss. In this case, it was better to divide the fishes in lots to calculate the tolerance and the reduction of losses. In general, the procedure to calculate the tolerance (∆ ) is: ∆ = average of fishes / 2.
v
2calculus;
v
∑
=
=
+
+
+
=
ni i
n
n
y
y
y
y
n
12 22 2 1 22
1
.
(
1
1
...
1
)
1
.
(
1
)
;
where, v2 is the quadratic average deviation and y
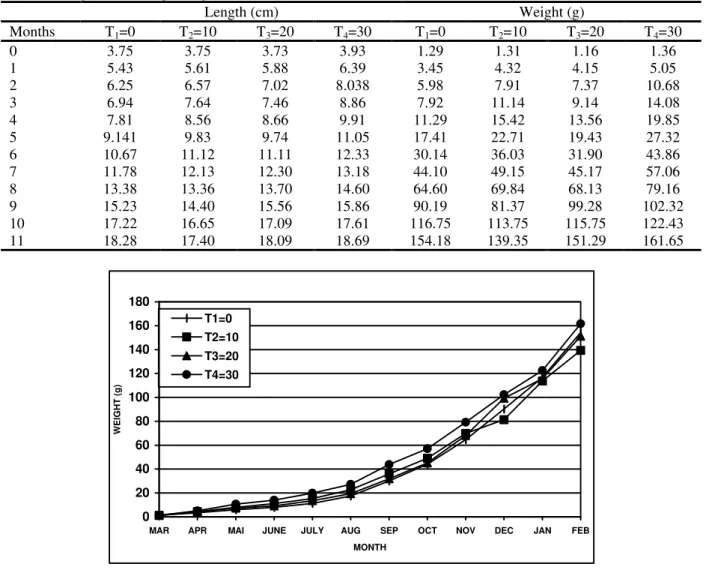
Table 2. Length and average weigh of fishes on treatments T1, T2, T3 and T4.
Length (cm) Weight (g)
Months T1=0 T2=10 T3=20 T4=30 T1=0 T2=10 T3=20 T4=30
0 3.75 3.75 3.73 3.93 1.29 1.31 1.16 1.36
1 5.43 5.61 5.88 6.39 3.45 4.32 4.15 5.05
2 6.25 6.57 7.02 8.038 5.98 7.91 7.37 10.68
3 6.94 7.64 7.46 8.86 7.92 11.14 9.14 14.08
4 7.81 8.56 8.66 9.91 11.29 15.42 13.56 19.85
5 9.141 9.83 9.74 11.05 17.41 22.71 19.43 27.32
6 10.67 11.12 11.11 12.33 30.14 36.03 31.90 43.86
7 11.78 12.13 12.30 13.18 44.10 49.15 45.17 57.06
8 13.38 13.36 13.70 14.60 64.60 69.84 68.13 79.16
9 15.23 14.40 15.56 15.86 90.19 81.37 99.28 102.32
10 17.22 16.65 17.09 17.61 116.75 113.75 115.75 122.43
11 18.28 17.40 18.09 18.69 154.18 139.35 151.29 161.65
0 20 40 60 80 100 120 140 160 180
MAR APR MAI JUNE JULY AUG SEP OCT NOV DEC JAN FEB
MONTH
WEIGHT (g)
T1=0 T2=10 T3=20 T4=30
Figure 1. Average weight of the fishes (g).
RESULTS AND DISCUSSION
The results of length and total average weight of the standard group (T1) and the tested groups (T2, T3 and T4) of tilapias are shown in the Table 2 and Figure 1.
Data of literature demonstrate low index of growth, length and weight in the amianthus box during the experimental period. This could be associated to the absence of natural feeding, besides the little space per fish that did not follow the population density limits. This, according to Coda (1996), has great influence on the growth index of the fishes.
The most important variables that must be controlled in fish breeding, are temperature, alkalinity, dissolved oxygen, ammonia, nitrite, phosphorus and pH (Boyd, 1990). The average values obtained for the physical and chemical variables were in the zone considered ideal for fish breeding, according to Tavares (1994). The rate of water change was kept high during the experimental period, so that the values obtained for the physico–chemical variables of the water did not represent significant statistic difference (P< 0,05) among the treatments T1, T2, T3 and T4.
Table 3. Cost of production (T1 = 0% of Yeast).
Specification Quantity Unitary cost ( R$ ) Total ( R$ )
Ration 24.180kg 0.30 7.250
Yeast 0.000kg 0.23 0.000
Fingerling 60 0.04 2.400
Population 0.250h 1.00 0.250
Biometry 2.750h 1.00 2.750
Food supplied 5.500h 1.00 5.500
Medicines ... 5.00 1.250
Disfishery 0.1250h 1.00 0.125
Total ... ... 19.525
A Calculus V2 Calculus: v 2 =
1/42(0.025455831)
A = 1
k
∑
Pi / k = 19.525/60 = 0.3254 Calculus of the Taguchi’sloss function (L)
∆ Calculus L = A ∆2 v2 = 0.3254(77.095)2
1/42(0.025455831)
∆ = m / 2 = 154.19/2 = 77.095 L = 1.17222, logo, 60 x 1.17222 = R$
70.33.
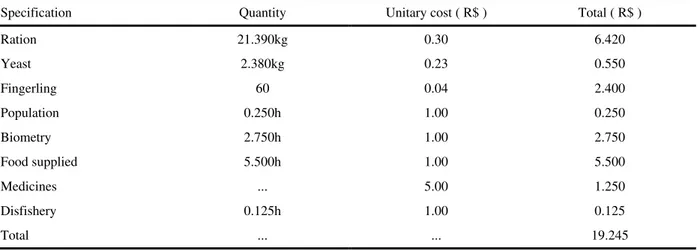
Table 4. Cost of production (T2 = 10% of Yeast).
Specification Quantity Unitary cost ( R$ ) Total ( R$ )
Ration 21.390kg 0.30 6.420
Yeast 2.380kg 0.23 0.550
Fingerling 60 0.04 2.400
Population 0.250h 1.00 0.250
Biometry 2.750h 1.00 2.750
Food supplied 5.500h 1.00 5.500
Medicines ... 5.00 1.250
Disfishery 0.125h 1.00 0.125
Total ... ... 19.245
A Calculus V2 Calculus: v 2 =
1/41(0.012242089)
A = 1
k
∑
Pi / k = 19.245/60 = 0.3208 Calculus of the Taguchi’sloss function (L)
∆ Calculus L = A ∆2 v2 = 0.3208(69.675)2
1/41(0.012242089)
∆ = m / 2 = 139.35/2 = 69.675g L = 0.46501, logo, 60 x 0.46501 = R$
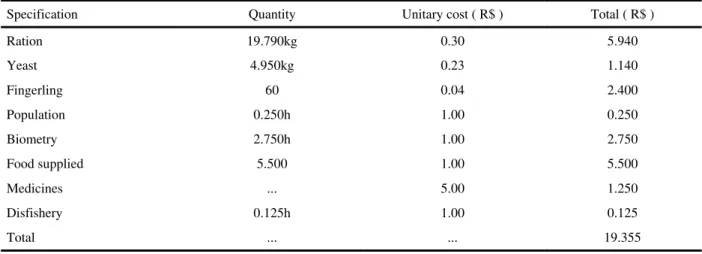
Table 5 . Cost of production (T3 = 20% of Yeast).
Specification Quantity Unitary cost ( R$ ) Total ( R$ )
Ration 19.790kg 0.30 5.940
Yeast 4.950kg 0.23 1.140
Fingerling 60 0.04 2.400
Population 0.250h 1.00 0.250
Biometry 2.750h 1.00 2.750
Food supplied 5.500 1.00 5.500
Medicines ... 5.00 1.250
Disfishery 0.125h 1.00 0.125
Total ... ... 19.355
A Calculus V2 Calculus: v 2 =
1/44(0.047722599)
A = 1
k
∑
Pi / k = 19.355/60 = 0.3226 Calculus of the Taguchi’sloss function (L)
∆ Calculus L = A ∆2 v2 = 0.3226(75.645)2
1/44(0.047722599)
∆ = m / 2 = 151.29/2 = 75.645 L = 2.00215, logo, 60 x 2.00215 = R$
120.13.
Table 6. Cost of production (T4 = 30% of Yeast).
Specification Quantity Unitary cost ( R$ ) Total ( R$ )
Ration 21.230kg 0.30 6.370
Yeast 9.100kg 0.23 2.090
Fingerling 60 0.04 2.400
Population 0.250h 1.00 0.250
Biometry 2.750h 1.00 2.750
Food supplied 5.500h 1.00 5.500
Medicines ... 5.00 1.250
Disfishery 0.125h 1.00 0.125
Total ... ... 20.735
A Calculus V2 Calculus: v 2 =
1/44(0.007962977)
A = 1
k
∑
Pi / k = 20.735/60 = 0.3456 Calculus of the Taguchi’sloss function (L)
∆ Calculus L = A ∆2 v2 = 0.3456(80.875)2
1/44(0.007962977)
∆ = m / 2 = 161.75/2 = 80.875 L = 0.40910, logo, 60 x 0.40910 = R$
0 2 0 4 0 6 0 8 0 1 0 0 1 2 0 1 4 0
T 1 = 0 % T 2 = 1 0 % T 3 = 2 0 % T 4 = 3 0 %
% Y e a s t
L(Y)
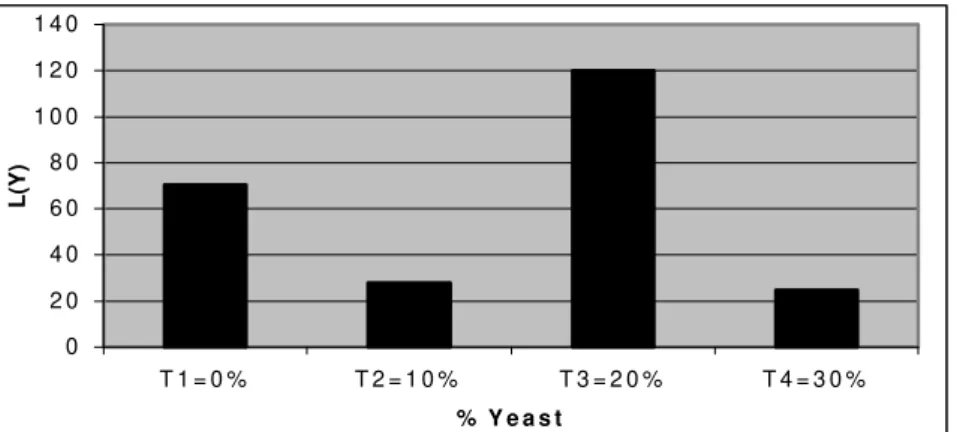
Figure 2. Taguchi’s loss function for the fishes prodution.
The Taguchi’s loss function for the fish production in amianthus box showed that the treatment which included T4=30% of yeast in ration (Figure 2) resulted in an inferior production cost comparing to the others treatments. For the treatments T1=0%, T2=10%,
T3=20% and T4=30% of distillery yeast in
ration, the losses were, R$70.33, 27.90, 120.13,
24.55 respectively. These results confirmed the possibility of using this residues as partial substitute of fish ration.
The Tables 7, 8, 9, 10 and Figure 3 present the Taguchi’s loss in the treatment T1, T2, T3 and T4 for the dead fishes.
Table 7. Dead fishes (T1 = 0% of Yeast) – k = 18.
Specification Quantity Unitary cost ( R$ ) Total ( R$ )
Ration 4.458kg 0.30 1.340
Yeast 0.000kg 0.23 0.000
Fingerling 18 0.04 0.720
Population 0.070h 1.00 0.070
Biometry 0.830h 1.00 0.830
Food supplied 1.650h 1.00 1.650
Medicines ... 5.00 0.370
Disfishery 0.040h 1.00 0.040
Total ... ... 5.020
A Calculus V2 Calculus: v 2 =
1/42(0.025455831)
A = 1
k
∑
Pi / k = 5.02/18= 0.2789 Calculus of the Taguchi’sloss function (L)
∆ Calculus L = A ∆2 v2 = 0.2789(77.095)2
1/42(0.025455831)
∆ = m / 2 = 154.19/2 = 77.095 L = 1.00471 logo, 18 x 1.00471= R$
Table 8. Dead fishes (T2 = 10% of Yeast) – k = 19.
Specification Quantity Unitary cost ( R$ ) Total ( R$ )
Ration 3.056kg 0.30 0.920
Yeast 0.340kg 0.23 0.080
Fingerling 19 0.04 0.760
Population 0.080h 1.00 0.080
Biometry 0.870h 1.00 0.870
Food supplied 1.740h 1.00 1.740
Medicines ... 5.00 0.400
Disfishery 0.040h 1.00 0.040
Total ... ... 4.890
A Calculus V2 Calculus: v 2 =
1/41(0.012242089)
A = 1
k
∑
Pi / k = 4.89/19= 0.2574 alculus of the Taguchi’sloss function (L)
∆ Calculus L = A ∆2 v2 = 0.2574(69.675)2
1/41(0.012242089)
∆ = m / 2 = 139.35/2 = 69.675 L.= 0.37311, logo, 19 x 0.37311 = R$
7.09.
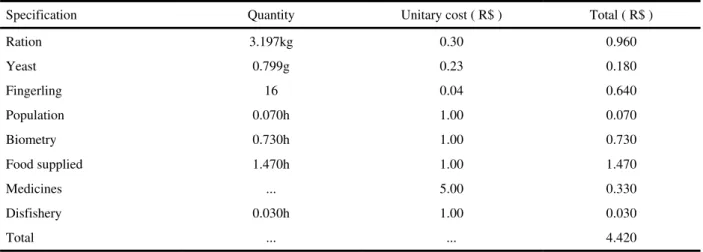
Table 9. Dead fishes (T3 = 20% of Yeast) – k = 16.
Specification Quantity Unitary cost ( R$ ) Total ( R$ )
Ration 3.197kg 0.30 0.960
Yeast 0.799g 0.23 0.180
Fingerling 16 0.04 0.640
Population 0.070h 1.00 0.070
Biometry 0.730h 1.00 0.730
Food supplied 1.470h 1.00 1.470
Medicines ... 5.00 0.330
Disfishery 0.030h 1.00 0.030
Total ... ... 4.420
A Calculus V2 Calculus: v 2 = 1/44
(0.047722599)
A = 1
k
∑
Pi / k = 4.42/16 = 0.2756 Calculus of the Taguchi’sloss function (L)
∆ Calculus L = A ∆2 v2 = 0.2756(75.645)2
1/44(0.047722599)
∆ = m / 2 = 151.29/2 = 75.645 L = 1.71045, logo, 16 x 1.71045= R$
Table 10. Dead fishes (T4 = 30% of Yeast) – k = 16.
Specification Quantity Unitary cost ( R$ ) Total ( R$ )
Ration 4.948kg 0.30 1.480
Yeast 2.120kg 0.23 0.490
Fingerling 16 0.04 0.640
Population 0.070h 1.00 0.070
Biometry 0.730h 1.00 0.730
Food supplied 1.470h 5.00 1.470
Medicines ... 0.33 0.330
Disfishery 0.030h 1.00 0.030
Total ... ... 5.240
A Calculus V2 Calculus: v 2 =
1/44(0.007962977)
A = 1
k
∑
Pi / k = 5.24/16 = 0.3275 Calculus of the Taguchi’sloss function (L)
∆ Calculus L = A ∆2 v2 = 0.3275(80.875)2
1/44(0.007962977)
∆ = m / 2 = 161.75/2 = 80.875 L = 0.38754 , logo, 16 x 0.38754 = R$
6.20.
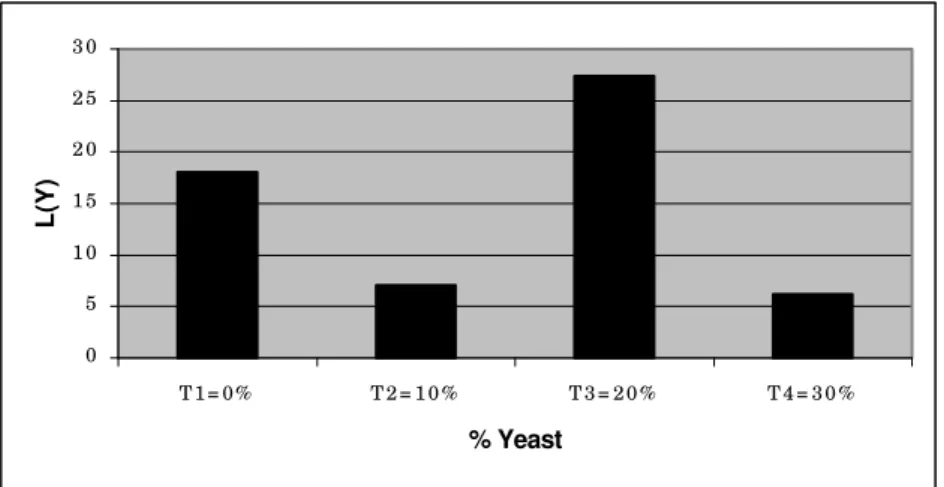
The treatments T2 and T4, that included 10% and 30% of distillery yeast in ration (Figure 3), resulted in losses of R$7.09 and 6.06
respectively, less than the standard group (T1=0%), which lost R$18.08 on account to the dead fishes in the amianthus boxes.
0 5 1 0 1 5 2 0 2 5 3 0
T 1 = 0 % T 2 = 1 0 % T 3 = 2 0 % T 4 = 3 0 %
% Yeast
L(Y)
Figure 3. Taguchi’s loss for the dead fishes.
Table 11. Discarded fishes (T1 = 0% of Yeast) – k = 9.
Specification Quantity Unitary cost ( R$ ) Total ( R$ )
Ration 5.180kg 0.30 1.550
Yeast 0.000kg 0.23 0.000
Fingerling 9 0.04 0.360
Population 0.040h 1.00 0.040
Biometry 0.410h 1.00 0.410
Food supplied 0.820h 1.00 0.820
Medicines ... 5.00 0.190
Disfishery 0.020h 1.00 0.020
Total ... ... 3.390
A Calculus V2 Calculus: v 2 =
1/42(0.025455831)
A = 1
k
∑
Pi / k = 3.39/9= 03767 Calculus of the Taguchi’sloss function (L)
∆ Calculus L = A ∆2 v2 = 0.3767(77.095)2
1/42(0.025455831)
∆ = m / 2 = 154.19/2 = 77.095 L = 1.35702, logo, 9x 1.35702 = R$
12.21.
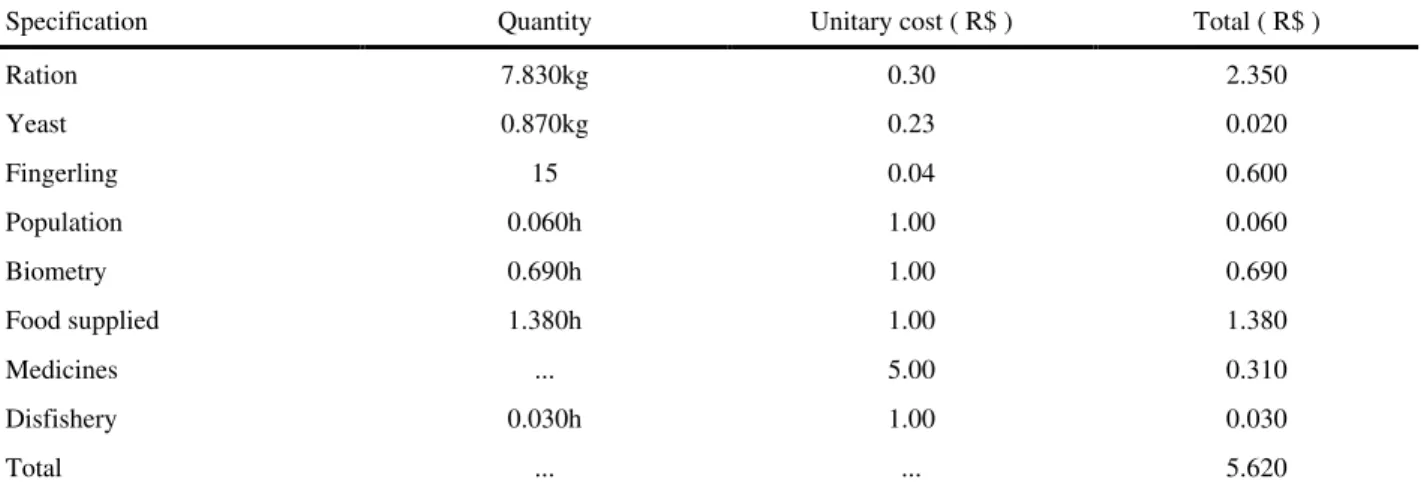
Table 12. Discarded fishes (T2 = 10% of Yeast) – k = 15.
Specification Quantity Unitary cost ( R$ ) Total ( R$ )
Ration 7.830kg 0.30 2.350
Yeast 0.870kg 0.23 0.020
Fingerling 15 0.04 0.600
Population 0.060h 1.00 0.060
Biometry 0.690h 1.00 0.690
Food supplied 1.380h 1.00 1.380
Medicines ... 5.00 0.310
Disfishery 0.030h 1.00 0.030
Total ... ... 5.620
A Calculus V2 Calculus: v 2 =
1/41(0.012242089)
A = 1
k
∑
Pi / k = 5.62/15 = 0.3747 Calculus of the Taguchi’sloss function (L)
∆ Calculus L = A ∆2 v2 = 0.3747(69.675)2
1/41(0.012242089)
∆ = m / 2 = 139.35/2 = 69.675 L = 0.54314, logo, 15 x 0.54314 = R$
Table 13. Discarded fishes (T3 = 20% of Yeast) – k = 12.
Specification Quantity Unitary cost ( R$ ) Total ( R$ )
Ration 5.400kg 0.30 1.620
Yeast 1.350g 0.23 0.310
Fingerling 12 0.04 0.480
Population 0.050h 1.00 0.050
Biometry 0.550h 1.00 0.550
Food supplied 1.100h 1.00 1.100
Medicines ... 5.00 0.250
Disfishery 0.030h 1.00 0.030
Total ... ... 4.390
A Calculus V2 Calculus: v 2 =
1/44(0.047722599)
A = 1
k
∑
Pi / k = 4.39/12 = 0.3658 Calculus of the Taguchi’sloss function (L)
∆ Calculus L = A ∆2 v2 = 0.3658(75.645)2
1/44(0.047722599)
∆ = m / 2 = 151.29/2 = 75.645 L = 2.27026, logo, 12 x 2.27026= R$
27.24.
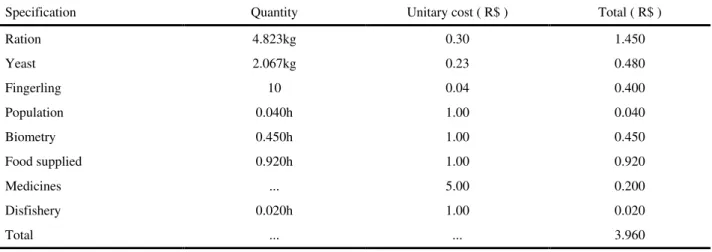
Table 14. Discarded fishes (T4 = 30% of Yeast) – k = 10.
Specification Quantity Unitary cost ( R$ ) Total ( R$ )
Ration 4.823kg 0.30 1.450
Yeast 2.067kg 0.23 0.480
Fingerling 10 0.04 0.400
Population 0.040h 1.00 0.040
Biometry 0.450h 1.00 0.450
Food supplied 0.920h 1.00 0.920
Medicines ... 5.00 0.200
Disfishery 0.020h 1.00 0.020
Total ... ... 3.960
A Calculus V2 Calculus: v 2 =
1/44(0.007962977)
A = 1
k
∑
Pi / k = 3.96/10 = 0.396 Calculus of the Taguchi’sloss function (L)
∆ Calculus L = A ∆2 v2 = 0.396(80.875)2
1/44(0.007962977)
∆ = m / 2 = 161.75/2 = 80.875 L = 0.46876, logo, 10 x 0.46876 = R$
0 5 10 15 20 25 30
T1=0% T2=10% T3=20% T4=30%
% Yeast
L(Y)
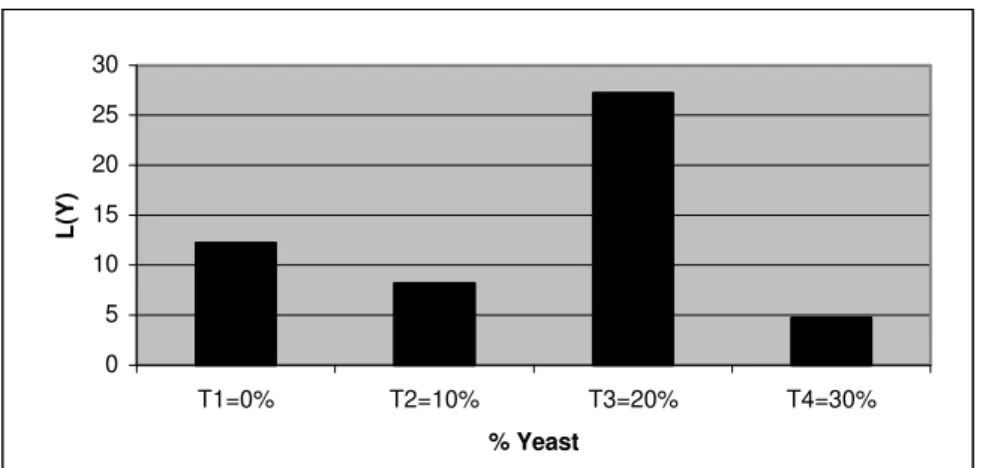
Figure 4. Taguchi’s loss for the Discarded fishes.
There were no positive correlation among Tagushi’s loss for the total production, dead and Discarded fishes and the four balanced rations in all the experiments, which meat that the increasing inclusion of distillery yeast in tilapia ration depended only on its availability and occasional cost. The losses in the amianthus boxes could be attributed to the density limitation, absence of natural feeding and big dispersion of the fish size.
RESUMO
Foram utilizados 240 alevinos de tilápia do nilo
(Oreochromis niloticus) com 45 dias,
sexualmente revertidas com peso médio inicial de 1.25 ± 0.14g alocados em caixas de amianto. Foi avaliado o efeito da substituição de 10%, 20% e 30% de ração por levedura de destilaria sobre a função perda de Taguchi. Os resultados médios obtidos nos parâmetros limnológicos para o controle da qualidade da água através da análise química foram normais. As perdas de Taguchi para a produção total, para os peixes mortos e descartados não revelou uma correlação para os diferentes níveis de inclusão de levedura alcooleira, indicando que a escolha do nível de levedura na ração para estes peixes depende da sua disponibilidade e custo ocasional. Observou-se que perdas acentuadas nas caixas de amianto podem ser atribuídas ao limite de densidade, ausência de alimentação natural e grande dispersão no tamanho dos peixes.
REFERENCES
Alves, L. M. C. G.; Pezzato, L. E.; Neto, A. C. G.; Pezzato, A. C.; Barros, M. M.; & Padovani, C. R. (1988), Avaliação de níveis crescentes de levedura seca de vinhaça incorporadas às rações de tilápia do Nilo. In: SIMÓSIO LATINOAMERICANO DE AQÜICULTURA, 6, SIMPÓSIO BRASILEIRO DE AQÜICULTURA, 5,
1988. Florianópolis, Resumos...
Florianópolis: Abra, pp. 355-361.
Boyd, C. E. (1990), Water quality in ponds for aquaculture. Birmingham: Alabama Agricultural Experiment Station, 477p. Castagnolli, N. (1992), Piscicultura de água
doce. Jaboticabal: FUNEP, 189p.
Coda, S. (1996), Efeito da densidade de estocagem no cultivo intensivo de tilápia do nilo, Oreochromis niloticus. In: SIMPÓSIO BRASILEIRO DE AQÜICULTURA, 9, Sete Lagoas, Mg. 1996, p.131. Resumos...
Sete Lagoas, Simbraq.
Guedes, T. A. (1996), Procedimentos de
otimização no planejamento e controle da qualidade de produtos e processos. Florianópolis, 140p. Tese (Doutorado em Engenharia de Produção). Universidade Federal de Santa Catarina.
Kackar, R. N. (1986), Taguchi's quality philosophy: analysis and commentary.
Quality progress, 19(12), 19-29.
Lind, O. T. (1979), Handbook of common
methods in limnology. London: Ed. Mosby Company, pp. 59-85.
fermentação alcoólica na alimentação de
ruminantes. Informe Agropecuário, Belo
horizonte, 10(119), 56-60.
Medri, V. (1997), Técnicas estatísticas e de engenharia da qualidade para avaliar o desempenho de diferentes níveis de levedura na criação de tilápia (Oreochromis niloticus). Florianópolis, 180p. Tese (Doutorado em Engenharia de Produção) Universidade Federal de Santa Catarina.
National Acadmy of Sciences/National Research Council (1993), Nutrients Requirements of fish. Washington, 102p.
Phadke, M. S. (1989), Quality engineering
using robust design. Englewood Cliffs: PTR Prentice Hall, pp. 18-22.
Standard Methods - for the examination of
water and wastewater. (1980), APHA-AWWA-WPCF 1, 15 ed., pp. 380-491.
Stange, P. (1996), Sobre o gerenciamento da
produção orientado para a qualidade total da empresa com base na função perda de Taguchi. Florianópolis: EPS/UFSC.
Taguchi, G., Elsayed, E. A. & Hsiang, T. C.
(1990), Engenharia da qualidade em
sistemas de produção. São Paulo: Mc Graw - Hill, 235p
Wilson, R. P. (Ed.)., (1991), Handbook of
nutrient requirements of finfish. Boca Raton: CRC, p.176.
Wu, V. Y.; Rosati, R. R.; Sessa, D. J. & Brown, P. B. (1995b), Evaluation of corn gluten meal as a protein source in tilapia diets. J. Agric. Food Chem.,43, 1585-1588.