Vol.54, n. 1: pp. 173-182, January-February 2011
ISSN 1516-8913 Printed in Brazil BRAZILIAN ARCHIVES OF
BIOLOGY AND TECHNOLOGY
A N I N T E R N A T I O N A L J O U R N A L
Denitrification Coupled with Methane Anoxic Oxidation and
Microbial Community Involved Identification
Renata Medici Frayne Cuba
*, Iolanda Cristina Duarte, Nora Katia Saavedra, Maria
Bernadete Amâncio Varesche and Eugenio Foresti
Departamento de Hidráulica e Saneamento; Escola de Engenharia de São Carlos; Universidade de São Paulo; Av. Trabalhador São Carlaense, 400; 13550-590; São Carlos - SP - Brasil
ABSTRACT
In this work, the biological denitrification associated with anoxic oxidation of methane and the microbial diversity involved were studied. Kinetic tests for nitrate (NO3-) and nitrite (NO2-) removal and methane uptake were carried out in 100 mL batch reactors incubated in a shaker (40 rpm) at 30 oC. Denitrificant/methanotrophic biomass was taken from a laboratory scale reactor fed with synthetic nitrified substrates (40 mgN L-1 of NO3- and subsequently NO2-) and methane as carbon source. Results obtained from nitrate removal followed a first order reaction, presenting a kinetic apparent constant (kNO3)) of 0.0577±0.0057d-1.Two notable points of the denitrification rate (0.12gNO3--N g-1 AVS d-1 and 0.07gNO3--N g-1 AVS d-1) were observed in the beginning and on the seventh day of operation. When nitrite was added as an electron acceptor, denitrification rates were improved, presenting an apparent kinetic constant (kNO2)of 0.0722±0.0044d-1, a maximum denitrification rate of 0.6gNO2--N g-1AVS d-1,and minimum denitrification rate of 0.1gNO2
--N g-1AVS d-1 at the beginning and end of the test, respectively. Endogenous material supporting denitrification and methane concentration dissolved in the substrate was discarded from the control experiments in the absence of methane and seed, respectively. Methylomonas sp. was identified in the reactors fed with nitrate and nitrite as well as uncultured bacterium.
Key words: denitrification, Methylomonas sp, methane oxidation
*Author for correspondence: [email protected]
INTRODUCTION
Methane oxidation by methanotrophs occurs in nature in aerobic (soil, river, lakes, etc) and anaerobic (marine sediments) environments. Methanotrops are divided in three specific groups depending on the path used for carbon uptake in the biosynthesis: a) type I utilize the ribulose monophosophate pathway (RuMP), b) type II employ the serine cycle, and c) type X,
Methylococcus capsulatus like organisms (type I) that utilize the RuMP pathway despite having low levels of serine path enzymes (Hanson and Hanson, 1996). In the presence of oxygen, methanotrophs oxidize methane releasing soluble organics such as methanol that can be utilized by the coexisting denitrificants as carbon sources for their metabolic activities.
Nitrate (NO3
(Modin et al., 2007). However, the sinthrophic association between methanotrophs and denitrifiers was first demonstrated by Rhee and Fuhs in 1978. (Modin et al., 2007). Davies (1973) isolated bacteria capable to denitrify with methane as the sole carbon source. However, these bacteria were not found to be specific for methane but could use other carbon compounds also as electron donors. Sollo et al., (1976) compared the denitrification process with methane and methanol as carbon sources in two different systems, the packed columns and fluidized bed. The rates of nitrate reduction with methane in packed columns were less than with methanol, 0.7 mgNO3
--N L-1h-1 and 4.6 mgNO3
--N L-1h-1, respectively. Higher methane denitrification rate was observed in the fluidized bed reactor (1.2 mgNO3
--N L-1h-1) but half of that rate, 0.6 mg NO3
--N L-1h-1, was attributed to
denitrification supported
from the organic content of the effluent used as the culture medium (Sollo et al., 1976). In view of the low rate of nitrate reduction and the problems involved in supplying the dissolved methane to the denitrifying bacteria, it was concluded that the denitrification with methane would not be an economical process. However, more recent studies considered the aerobic oxidation of methane associated with denitrification process as an alternative for organic carbon supply, which was necessary for nitrogen oxides removal in low organic concentration waters. (Werner and Kayser, 1991; Jewell et al., 1992; Thalasso et al., 1997; Rajapakse and Scutt, 1999; Houbron et al., 1999; Costa et al., 2000; Knowles, 2005; Waki et al., 2005).Methane anaerobic oxidation studies have related this process to sulfate reduction (Iversen and Jorgensen, 1985; Valentine and Reeburgh, 2000; Nauhaus et al., 2002). However, little is known about anoxic nitrogen compound reduction with methane as an electron donor or the organisms involved in the process. Islas-Lima et al., (2004) studied the dissimilative nitrate reduction in the presence of methane under anoxic conditions. The highest denitrification rate obtained was 0.25 gNO3
--N g-1 VSS d-1 for partial pressures of methane equal or higher than 8.8 kPa. For lower pressures, the rate obtained was 4.9x10⁻³ gNO3
--N g-1 VSS d-1 leading to the conclusion that nitrate removal was dependent on the electron donor availability in the system. Raghoebarsing et al., (2006) isolated and identified a microbial consortium composed of two kinds of
microorganisms; an uncultured bacterium and an archaea related to marine archaea able to accomplishe methane oxidation to carbon dioxide and nitrate as well as nitrite denitrification under anaerobic conditions.
The aim of this work was to study the anoxic oxidation of methane related with nitrate and nitrite biological denitrification.
MATERIAL AND METHODS
Methanotrophic/denitrificant biomass
adaptation
In order to develop the kinetic tests for the denitrification from nitrate (NO3
-) and subsequently from nitrite (NO2
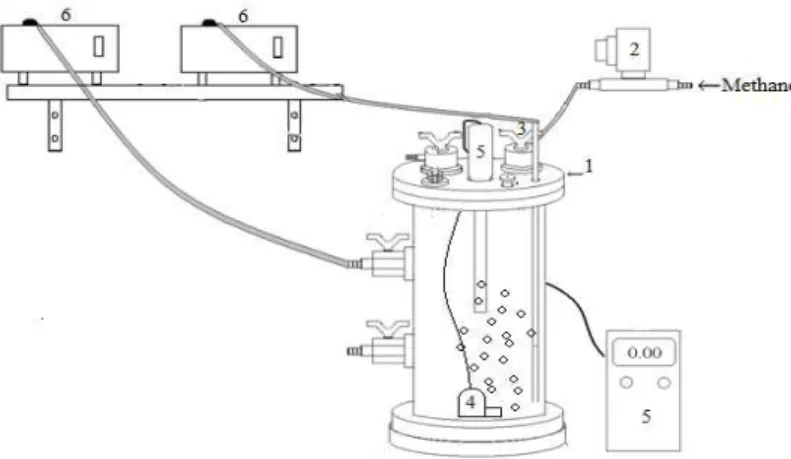
-) using methane as an electron donor, as well as to characterize the microbial community involved, biomass adapted to both conditions were utilized. Adaptation was accomplished in a bench-scale sequencing batch reactor (vol 1.6 L), in which, a 7-day cycles was performed for five-month period with nitrate as the electron acceptor, which was followed by a four-month period using nitrite as the electron acceptor, with 3-day cycles. The times of cycle were defined in order to obtain higher nitrogen reduction rates. In both the conditions, methane was the only external source of carbon added to the system. Carbon source availability and the absence of oxygen were achieved by injecting 3.84 L min-1 of methane into the reactor every five-minutes during each four hour period. To enhance the mass transfer between the liquid (bulk liquid) and gas (methane) phases, a submersed pump with mean flow rate of 90 L h-1 was installed at the base of the reactor for the recirculation of gas from the headspace to the bulk liquid. Synthetic substrates used for the cellular growth in nitrate denitrification comprised of (mg L-1): NaNO3
(243); KH2PO4 (216); K2HPO4 (280); Na2SO4
(10); NaHCO3 (100); yeast extract (10);
FeCl2.6H2O (0.269 Fe); MnCl2.4H20 (0.03 Mn);
NiCl2.6H2O (0.02 Ni); CaCL2.2H2O (5.4 Ca);
MgCl.6H2O (24 Mg); and µg L-1 of CuCl2.2H2O
(16 Cu); H3BO3 (10); NaMoO4.2H2O (13 Mo);
CoCl2.6H2O (50 Co). In the denitrification from
nitrite, NaNO3 was substituted by NaNO2
(197 mg L-1).
Varesche et al., (1997) suggested polyurethane foam as the most satisfactory support medium for
biomass immobilization. The reactor set-up was kept in a controlled chamber at 30 oC (Fig. 1).
Figure 1 - Experimental setup. (1) reactor, (2) solenoid valve for injection of methane, (3) methane inlet, (4) submersed pump, (5) oxygen meter, (6) fill and draw pumps.
Kinetic tests
Kinetic tests were conducted in 100 mL batch reactors, containing 80 mL of culture medium and seed. The culture medium had the same characteristics of the reactor affluent and was prepared by boiling ultra pure water and cooling in a nitrogen atmosphere. Fifty cubes of polyurethane foam were collected from the methanotrophic/ denitrificant culture adaptation reactor and used as seed.
Endogenous sustained denitrification and methane concentration variation in the headspace of test flasks resulting from solubilization and sampling were analyzed in control reactors in the absence of methane and seed, respectively. After the addition of culture medium and seed, the methanotrophic denitrificant reactors (RMD) were sealed. Headspace atmosphere of each reactor was substituted by methane (99.5%), injecting it with a flow of 1.28 L min-1 for 15 min.
Methane, nitrate, and nitrite concentrations were measured daily; nitrogen in the form of ammonium (NH4
+
-N) concentrations was measured at the end of the test. After each sampling, helium gas was supplied to re-establish the headspace gas pressure. Reactors and controls were incubated in a rotating chamber (40 rpm) at 30 oC. All the tests were performed in triplicate. A Gow-Mac gas chromatograph with a thermal conductivity detector and 2 m long ¼” diameter Porapak Q column was used for methane analysis. During the analyses, the oven, column and detector temperature were 50 oC and hydrogen (60
mL min-1) was utilized as the sweep gas. For the quantification of nitrate, nitrite and ammonium nitrogen, the flux injection analysis (FIA) method was used as described in Standard Methods for the Examination of Water and Wastewater (APHA, 1995). Nitrate and nitrite concentrations were determined by Method 4500 NO3
I and ammonium concentration was determined by Method 4500 NH3 -B
Foam attached volatiles solids (AVS) determination was preceded by the removal of the attached solids from the foam matrices. Foam matrices samples were transferred to a falcon tube (15 mL) and AVS were detached using a glass stick and distilled water. The washed volumes were transferred to porcelain capsules and the washing procedure was repeated until the foam matrices were clean. Solids determinations were conducted at the beginning and at the end of each test according to APHA (1995). Foam mass were determined after drying at 100 oC. Kinetic fitting curves for nitrate and nitrite removal were constructed using Microcal Origin® 6.0 software.
DNA extraction
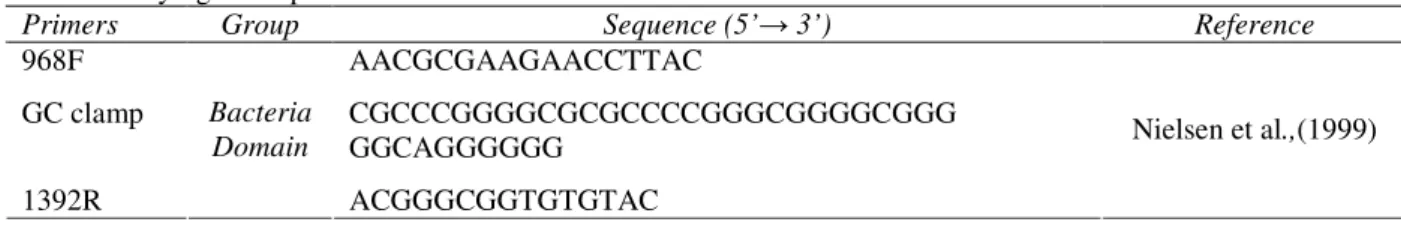
Polymerase chain reaction (PCR) amplification For the denaturing gradient gel electrophoresis (DGGE) analysis, 16S rRNA gene fragments were amplified by PCR using specific primers: the primer sets 968F and 1392R (Table 1) for Bacteria
Domain (Nielsen et al., 1999). A GC-clamp (Muyzer et al., 1993) was added to the forward primers of the three primer sets. A 2.0 L of DNA
template was added to the amplification reaction, which was performed in accordance with the instructions of the supplier manual for platinum Taq DNA polymerase (Invitrogen®, Carlsbad, CA, USA). The PCR was performed with a System 2.400 thermocycler (Perkin-Elmer Cetus, Norwalk, CT, USA). The PCR program was as described by Nielsen et al., (1999).
Table 1 - Phylogenetic primers used for Bacteria Domain
Primers Group Sequence (5’→ 3’) Reference
968F AACGCGAAGAACCTTAC
GC clamp CGCCCGGGGCGCGCCCCGGGCGGGGCGGG
GGCAGGGGGG 1392R
Bacteria Domain
ACGGGCGGTGTGTAC
Nielsen et al.,(1999)
Denaturing gradient gel electrophoresis
(DGGE) analysis
The amplified DNA fragments were separated by the DGGE, which was conducted using a Dcode™ Universal Mutation Detection System (Bio-Rad Laboratories, Hercules, CA, USA). The PCR products were applied directly onto 8% (w/v) polyacrylamide gel in 0.5 TAE (Tris acetic acid EDTA) with a linear gradient of denaturants (urea and formamide) ranging from 30 to 60%. Electrophoresis was performed at constant voltage of 75 V at 65 °C for 16 h. Gels were observed in an UV illumination device and photographed using the Eagle Eye II Imager (Stratagene, La Jolla, CA, USA). Gel images were manipulated with Eaglesight Stratagene (v3.22) software. Selected bands were excised from the DGGE gels, placed into sterilized vials containing 30 mL of sterilized distilled water, and stored overnight at 4 ºC to allow the DNA to passively diffuse out of the gel strips. Two microliters of the eluted solution was further amplified by using 968F and 1392R primers without attaching a GC-clamp. The PCR products were purified from the UltraClean PCR Clean Up Kit (Mobio). The purified DNA was used as the template in the cycle sequencing reaction using the BigDye terminator cycle sequencing kit (Applied Biosystems, CA, USA). The products were then analyzed using ABI PrismTM 310 (Applied Biosystems). The identification was carried out by comparing the 16S rRNA gene sequences obtained with 16S rRNA sequence data from reference and type strains, as well as environmental clones, available
in the public databases GenBank®
(http://www.ncbi.nlm.nih.gov). Sequence alignment and phylogenetic analysis were performed using the Mega software (version 3). A phylogenetic tree was constructed by 500-fold bootstrap analysis using the neighbor-joining method. Amplifying conditions were performed as described by Nielsen et al., (1999) using thermocycler “Gene Amp. PCR System 2400” (Perkin-Elmer Cetus, Norwalk, Conn.). Programming conditions were: cycle number (35), initial denaturation (94 oC, 5 min.), denaturation (94 oC, 45 s), annealing (38 oC, 1 min), extension (72 oC, 2 min), end of extension (72 oC, 10 min) and cooling (4 oC). Products resulting from the nucleic acid extraction and PCR amplification were evaluated through agarose gel electrophoresis Experimental procedures for both were similar, differing only in the molecular marker. Agarose 1% and more was the high molecular mass marker (nucleic acid extraction) and agarose 1% and low was the low molecular mass marker (PCR amplification). The DGGE analysis was conducted as indicated by Muyzer et al., (1993).
RESULTS
Methanotrophic/denitrifier culture adaptation reactor
Under steady state conditions, the reactor showed a nitrate removal rate of 0.005 gNO3
--N d-1 (75% removal efficiency) and the removal rate of 0.011 gNO2
Kinetic tests
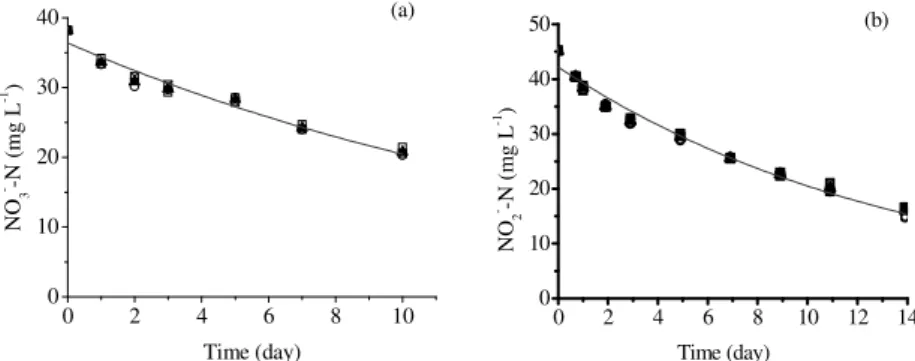
After the 10th day of incubation, the reactors that received nitrate as an electron acceptor demonstrated an average removal efficiency of 44% whereas the reactors receiving nitrite as electron acceptor reached average removal efficiency of 56% (Figs. 2a and b). In both cases, it was not possible to determine the NH4
+
-N concentration at the end of the test, eliminating the hypothesis of nitrogen removal by dissimilative
reduction of ammonia. In the nitrate fed reactors, nitrite presence was not verified at end of test. Both the tests did not show variation in attached volatiles solids (AVS) during the incubation period with 0.195 gAVS g-1 foam (tests with nitrate) and 0.075 gAVS g-1foam remaining (test with com nitrite). First order kinetic model more accurately represented the variation of nitrate concentrations (R2 = 0.96) and nitrite (R2 = 0.98) over time (Figs. 2a and b).
0 2 4 6 8 10 0
10 20 30 40
N
O3
- -N
(
m
g
L
-1 )
Time (day)
(a)
0 2 4 6 8 10 12 14 0
10 20 30 40 50
N
O2
- -N
(
m
g
L
-1 )
Time (day)
(b)
Figure 2 - Temporal variation of: (a) nitrate and (b) nitrite concentrations, (____) first order kinetic fitting. Reactor A (-□-); Reactor B (-○-); – Reactor C (- -) and average (-▲-)
The values of the apparent kinetic constants for nitrate (kNO3) and nitrite (kNO2) removal were
0.0577±0.0057 d-1 and 0.0722±0.0044 d-1. The rates of nitrite removal reached values four times higher than those obtained for nitrate removal in the beginning of test and five times higher at the
end (Figs. 3a and b). In nitrate incubated reactors, two notable points in the removal rate were detected, 0.14 gNO3--N g-1AVS d-1 and 0.12 gNO3
--N g-1AVS d-1 on the first and seventh days, respectively (Fig. 3a).
Figure 3 - (a) Nitrate and (b) nitrite removal rates. Reactor A (-□-); Reactor B (-○-); – Reactor C (- -).
Nitrogen removal attributed to endogenous decay of organic matter was eliminated because of the nitrogen removal obtained from the control reactors incubated without methane as carbon source (Fig. 4). In nitrate fed reactors, no NO3
-major variation was detected within the period of
of 0.6415±0.1443 d-1; however, the kinetic model that best fit the experimental results was the first order reaction with a residual fraction of NO2
-
(Fig. 4b) adapted from Pinho et al., (2002). In this case, the calculated NO2residual fraction was 32.5±0.8
mg L-1.
Methane uptake
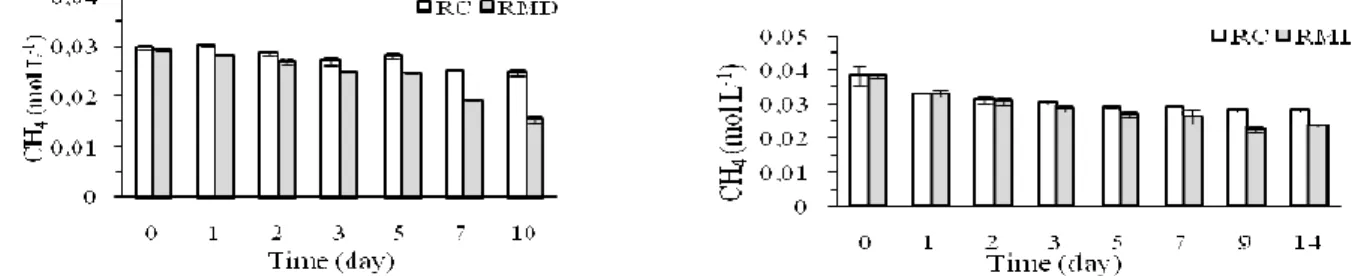
Methane concentration in the headspace of reactors decreased during the incubation period in both the conditions tested (Figs. 5a and b).
0 2 4 6 8 10
0 10 20 30 40
N
O3
- -N
(
m
g
L
-1 )
Tim e (day)
(a)
0 2 4 6 8 1 0
0 1 0 2 0 3 0 4 0
N
O 2
- -
N
(
m
g
L
-1 )
T im e (d a y )
( b )
Figure 4 - Variation in time of (a) NO3- and (b) NO2- in the absence of methane, (____) kinetic model fit. Reactor A (-□-); Reactor B (-○-); – Reactor C (- -) and average (-▲-).
Figure 5 - Time-variationof methane concentration in the headspacesethanotrophic/denitrificant reactors (RMD) and in the control reactors (RC). (a) nitrate test (b) nitrite test.
In the control reactors (RC) that did not receive inoculum, methane concentration reduction was a result of methane solubilization in the bulk liquid and of the sampling procedure adopted during the incubation period. For this reason, these values were not attributed to methane uptake by methanotrophs. When the addition of nitrate as electron acceptor occurred (Fig. 5a), methane concentration decline in the denitirificant reactors (RMD) was higher than in the RC reactors. That variation was more obvious from the fifth day of incubation to the end of the study. However, when nitrite was present (Fig. 5b), differences between the RC and RMD reactors were not so dramatic most likelybecause the denitrification from nitrite consumed less carbon source.After subtracting the values of methane variation from the RC, methane uptake by methanotrophs in RMD fed with nitrate
and nitrite was 0.009 and 0.005 mol L-1, respectively, corresponding to uptake rates of 0.52 mol CH4 g -1 NO3--Nand 0.17 mol CH4 g-1 NO2-
-N, respectively.
DGGE profile
The gel in Figure 6 shows a DGGE profile using primers for Bacteria Domain.
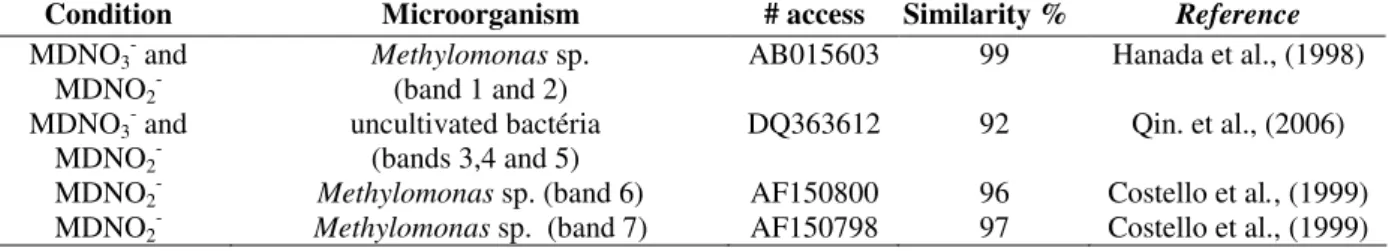
Table 2 shows sequencing results from the samples adapted to methanotrophic/denitrificant conditions for nitrate (MDNO3
-) and for nitrite (MDNO2
-) obtained from the isolated and amplified DGGE bands.
Note that three band were attributed to
The phylogenetic tree (Fig. 7) illustrates the relationships between the DGGE bands and organisms from the Bacteria Domain. Its construction included known sequences of
Methylomonas sp. (DQ119049), Methylococcus capsulatus (AJ563935) and Methylobacter sp. (AJ868427).
Figure 6 - DGGE gel (30% - 60% gradient) with Bacteria Domain primers from ethanotrophic/denitrifier culture samples reactor. Lane I - stage taking nitrate as a receiver of electrons. Lane II – stage taking nitrite as a receiver of electrons.
Table 2 - Information about sequences obtained from isolated DGGE bands with Bacteria Domain primers from samples adapted to MDNO3- and MDNO2- conditions.
Condition Microorganism # access Similarity % Reference
MDNO3- and MDNO2
-Methylomonas sp. (band 1 and 2)
AB015603 99 Hanada et al., (1998) MDNO3- and
MDNO2
-uncultivated bactéria
(bands 3,4 and 5)
DQ363612 92 Qin. et al., (2006) MDNO2- Methylomonas sp.(band 6) AF150800 96 Costello et al., (1999) MDNO2- Methylomonas sp. (band 7) AF150798 97 Costello et al., (1999)
Band 6
Band 7
Methylomonas sp. (AF150798)
Methylomonas sp. (AF150800)
Methylobacter sp. (AJ868427)
Methylomonas sp. (DQ119049)
Bands (1) (2)
Methylomonas sp.(AB015603)
Methylococcus capsulatus (AJ563935)
Bands (3) (4) (5)
Uncultured bacterium (DQ363612)
100
71
100
100 92
97 99
50
0.02
DISCUSSION
Compared with the results from the RC, the results obtained from the RMD for nitrate and nitrite demonstrated that the inoculum used presented denitrificant characteristics with the use of methane as carbon source under anoxics conditions. The inhibiting effect of nitrite in the methanotrophic processes under certain conditions has been reported by others (King and Schnell, 1994; Dunfield and Knowles, 1995; Whalen, 2000; Waki et al., 2002). However, that effect was not observed in this work for NO2
--N concentrations of 45 mg L-1. The values obtained for k’NO3 and k’NO2 were 0.0577±0.0057 d
-1
and 0.0722±0.0044 d-1, respectively. The data obtained for the removal rates showed that when nitrite was the electron acceptor, the process was more efficient. Raghoebarsing et al., (2006) also observed that nitrite (up to 84 mg NO2
--N L-1) was removed better than nitrate under the methanotrophic/denitrificant conditions in the absence of oxygen.
Nitrate specific removal rates obtained at the beginning of test (0,13 g NO3
--N g-1 AVS d-1) were lower than those obtained by Islas-Lima et al., (2004) (0.25 g NO3
--N g-1VSS d-1). In this case, the foam matrix and support media in addition to the low rotating velocities during the incubation period might have interfered in methane transfer to the bulk liquid limiting its availability for the microorganisms. Roslev and King (1994), while studying the starvation effects of methane in methanotrophs, observed that lowering rotating velocity from 120 to 60 rpm during the incubation stage led to a 90% reduction in the growth rate of methanotrophic microorganism due to gas transfer limitations.
The higher methane uptake observed in the test with NO3
--N (0.009 mol L-1) might be associated with the fact that denitrification from nitrite required a low quantity of electron donors, according to the equations 1 and 2 (Raghoebarsing et al., 2006). The results showed 0.52 mol CH4 g
-1
NO3
--N and 0.17 mol CH4 g -1
NO2
-- N uptake, which was ten times the theoretical uptake.
O H 14 N 4 CO 5 H 8 NO 8 CH
5 4+ 3− + + → 2+ 2+ 2 (1)
O H 10 N 4 CO 3 H 8 NO 8 CH
3 4+ 2−+ + → 2+ 2+ 2 (2)
Raghoebarsing et al., (2006) observed that the methane uptake was very similar to the
stoichiometric value. However, their tests were conducted with purified cultures that did not present significant competition for the substrate when compared with non-pure cultures. The possibility that different microorganisms could occupy the same niche and be capable of using methane as carbon source with different environmental and nutritional requirements could justify the occurrence of the two specific removal rate peaks in the reactor incubated with nitrate (Fig. 3a).
Graham et al., (1993), studying the competition between Methylosinus trichosporium OB3b, Type II metanotrophs and M. albus BG8I, Type I metanotrophs, in continuous flux reactor noted that Type II methanotrophs were favored under nitrogen and copper limiting conditions. Amaral and Knowles (1995) reported the presence of Type II methanotrophs at low oxygen concentrations and high methane concentrations, whereas the Type I methanotrophs prevailed at high oxygen concentration and low methane concentrations. While studying ammonia salts effects on the methane oxidation rate in soil samples, Gulledge et al., (1997) also reported the presence of different organisms capable of utilizing methane at the same niche.
The phylogenic identification of a community associated with nitrate or nitrite denitrification processes with methane as an electron donor revealed the presence of the same organisms in both the conditions (see Table 1). These results, as well as those reported by Raghoebarsing et al., (2006) suggested that the organisms present were capable of adapting to different electron acceptors and using them as substrates for methane anoxic oxidation.
Raghoebarsing et al., (2006) purified and identified a microbial consortium formed by two microorganisms: an unidentified bacterium and an archaea similar to the marine archaea capable of oxidizing methane to carbon dioxide and favoring the denitrification from nitrate and nitrite under anaerobic conditions. The present results as well as those obtained by Islas-Lima et al., (2004) and Raghoebarsing et al., (2006) suggested that the oxidation of methane in the presence of nitrate or nitrite was possible. Apparently, the microbes responsible for the aerobic methane oxidation were capable of adaptation to anoxic conditions. However, little information about the communities involved in the denitrification process with methane as electron donor is available. According to Modin et al., (2007), it is not yet possible to isolate any microorganisms with the ability to anaerobically oxidize methane. Thus, more studies identifying the microorganism as well as metabolic pathways involved in the anoxic methane oxidation with nitrate and nitrite as electron acceptors must be performed.
ACKNOWLEDGEMENTS
We wish to thank to the Fundação de Amparo à Pesquisa do Estado de São Paulo (FAPESP) for supporting this work.
REFERENCES
Amaral, J.; Knowles, R. (1995), Growth of methanotrophs in oxygen and methane counter gradients. FEMS Microbiol. Lett.,126, 215-220 APHA; AWWA; WEF (1995), Standard Methods for
the Examination of Water and Wastewater. 19th Ed. American Public Health Association, Washington, DC
Costa, C.; Dijkema, C.; Friedrich, M.; García-Encina P.; Fdz-Polanco; Stams, A.J.M. (2000), Denitrification with methane as electron donor in oxygen-limited bioreactors. Appl Microbiol Biotechnol.,53, 754 – 762
Costello, A.; Lidstrom M. (1999), Molecular characterization of functional and phylogenetic genes from natural populations of methanotrophs in lake sediments. Appl. Environ. Microbiol., 65, 5066-5074 Dunfield, P.; Knowles, R.; Dumont, R.; Moore, T.R.
(1993), Methane production and consumption in temperate and subartic peat soils – response to temperature and pH. Soil Biol. Biochem.,25, 321-326
Graham, W.; Chandhary, J.; Hanson, R.; Arnold, R. (1993), Factors affecting competition between type I and type II methanotrophs in continuous-flow reactors. Microb. Ecol.,25, 1-17
Griffiths, R.; Whiteley, A.; O’Donnell, A.; Bailey, M. (2000), Rapid method for coextraction of DNA and RNA from natural environments for analysis of ribosomal DNA and RNAr based microbial community compositon. Appl. Environ. Microbiol.,
66, 5488-5491
Gulledge, J.; Doyle, A.; Schimel, J. (1997), Different NH4+ inhibition patterns of soil CH4 consumption a result of distinct CH4 oxidizer populations across sites?. Soil Biol. Biochem., 29, 13-21
Hanada, S.; Shigematsu, T.; Shibuya, K.; Eguchi, M.; Hasegawa, T.; Suda, F.; Kamagata, Y.; Kanagawa, T.; Kurane, R. (1998), Phylogenetic analysis of Trichloroethylene-degrading bacteria newly isolated from soil polluted with this contaminant. Journal Ferm. Bioeng.,86, 39-544
Hanson, R.; Hanson, T. (1996), Methanotrophic bacteria. Microbiol. Rev.,60, 439-471.
Houbron, E.; Torrijos, M.; Capdeville, B. (1999), An alternative use of biogas applied at the water denitrification. Wat. Sci. Tech, 40, 115 – 122
Islas-Lima S.; Thalasso F.; Gomez-Hernandez J. (2004), Evidence of anoxic methane oxidation coupled to denitrification. Wat. Res., 38, 13 -16 Iversen N.; Jorgensen B. (1985), Anaerobic methane
oxidation rates at the sulfate-methane transition in marine sediments from Kattegat and Skagerrajk (Denmark). Limnol. Oceanogr., 30, 944-955
Jewell W.; Nelson Y.; Wilson M. (1992), Methanotrophic bacteria for nutrient removal from wastewater: attached film system. Water Environ. Res. 64, 756-765
King G.; Schnell S. (1994), Ammonium and nitrite inhibition of methane oxidation by Methylobacter albus BG8 and Methylosinus trichosporium OB3b at low methane concentrations. Appl. Environ. Microbiol., 60, 3508-3513
Knowles, R. (2005), Denitrifiers associated with methanotrophs and their potential impact on the nitrogen cycle. Ecol. Eng., 24, 441-446
Modin O.; Fukushi K.; Yamamoto K. (2007), Denitrification with methane as external carbon source. Wat. Res., 41, 2726-2738
Muyzer G.; Waal C.; Uitterlinden G. (1993), Profiling of Complex Microbial Populations by Denaturing Gradient Gel Electrophoresis Analysis of Polymerase Chain Reaction-Amplified Genes Coding for 16S RNAr. Appl. Environ. Microbiol., 59, 695-700 Nauhaus K.; Boetius A.; Krüger M.; Widdel F. (2002),
Newby T.; Reed D.; Petzke L.; Igoe A.; Delwiche M.; Robert F.; McKinley J.; Whiticar M.; Colwell F. (2004), Diversity of methanotroph communities in a basalt aquifer. FEMS Microbiol. Ecol.,48, 333-344 Nielsen A.; Liu W.; Filipe C.; Grady L.; Molin S.; Stahl
A. (1999), Identification of a novel group of bacteria in sludge from a deteriorated biological phosphorus removal reactor. Appl. Environ. Microbiol.,65, 1251-1258
Pinho S. C.; Cubas S. A.; Ratusznei S. M.; Rodrigues J. A. D.; Foresti E.; Zaiat M. (2002) Influence of the agitation rate on the toeatment of partially soluble wastewater in anaerobic sequencing batch reactor cointaing immobilized biomass. Paper presented at 7th Taller y Simposio Latinoamericano Sobre Digestion Anaerobia, Merida, Yucatán, México, p. 103-106 Qin Y.; Li D.; Yang H. (2006), Investigation of total
bacterial and ammonia-oxidizing bacterial community composition in a full-scale aerated submerged biofilm reactor for drinking water pretreatment in China. FEMS Microbiol. Lett., 268, 126-134
Raghoebarsing, A.; Pol, A.; Pas-Shoonen, K.; Smolders, A.; Ettwig, K.; Rijpstra, W.; Schouten, S.; Damsté, J.; Camp, H.; Jetten, M.; Strous, M.(2006), A microbial consortium couples anaerobic methane oxidation to denitrification. Nature, 44, 918-921 Rajapakse, J.; Scutt, E. (1999), Denitrification with
natural gas and various new growth media. Wat. Res.,
33, 3726 – 3734
Rhee, G.Y.; Fuhs, G.W., (1978) Wastewater denitrification with one-carbon compounds as energy source. JournalWPCF., 50, 2111-2119
Roslev, P.; King, G. (1994), Survival and recovery of methanotrophic bacteria starved under oxic and anoxic conditions. Appl. Environ. Microbiol., 60, 2602-2608
Schubert, C. J.; Coolen, M.J.L.; Neretin, L.N.; Schippers, A.; Abbas, B.; Durisch-Kaiser, E.; Wehrli, B.; Hopmans, E.C.; Damsté, J.S.S.; Wakeham, S.; Kuypers, M.M.M. (2006) Aerobic and anaerobic methanotrophs in the Black Sea water column.
Environ. Microbiol., 8, 1844-1856
Thalasso, F.; Vallecillo, A.; García-Encina P.; Fdz-Polanco F. (1997), The use of metane as a sole carbon source for wastewater denitrification. Wat. Res., 31, 55 – 60
Valentine, D.; Reeburgh, W. (2000), New perspectives on anaerobic methane oxidation. Environ. Microbiol., 2, 477-484
Varesche, M.B.A.; Zaiat, M.; Vierira, L.G.T.; Vazoller, R.F.; Foresti, E. (1997), Microbial colonization of polyurethane foam matrices in horizontal-flow anaerobic immobilized sludge (HAIS) reactor. Appl. Microbiol. Biotechnol., 48, 534-538
Waki, M.; Tanaka, Y.; Osada, T.; Suzuki, K. (2002), Effects of nitrite and ammonium on methane-dependent denitrification. Appl. Microbiol. Biotechnol., 59, 338-343
Waki M., Tanaka Y., Osada T., Suzuki K. (2005) Methane-dependent denitrification by semi-partitioned reactor supplied separately with methane and oxygen. Bioresour. Technol., 96, 921-927 Whalen, S.C. (2000) Influence of N and non-N salts on
atmospheric methane oxidation by upland boreal forest and tundra soils. Biol. Fertil. Soils., 31, 279-287
Werner M., Kayser R. (1991) Denitrification with biogas as external carbon source. Wat. Sci. Tech. 23, 701-708
Webpages GenBank®, http://www.ncbi.nlm.nih.gov accessed 2007-15-01