iii
Abril, 2016
Ricardo Marçalo da Silva Marques
Mestre em Biotecnologia
Assessment of the metabolism and N
2O producing capacity
of Biological Nutrient Removal Systems
Dissertação para obtenção do Grau de Doutor em Química Sustentável
Orientador: Adrian Michael Oehmen, Professor Auxiliar Convidado, Faculdade de Ciências e Tecnologia, Universidade Nova de Lisboa
Co-orientadores: Maria d’Ascensão Miranda Reis, Professora Catedrática, Faculdade de Ciências e Tecnologia, Universidade Nova de Lisboa
Gilda de Sousa Carvalho, Investigadora Principal, Faculdade de Ciências e Tecnologia, Universidade Nova de Lisboa
Júri:
Presidente: Prof. Doutor José Paulo Barbosa Mota
Arguentes: Doutora Paula Maria Lima Castro
Doutor António Manuel Pedro Martins
Vogais: Prof. Doutor Adrian Michael Oehmen
Doutora Nídia Dana Mariano Lourenço de Almeida
i
Assessment of the metabolism and N2O producing capacity of Biological Nutrient Removal Systems
Copyright © Ricardo Marçalo da Silva Marques, Faculdade de Ciências e Tecnologia, Universidade Nova de Lisboa.
iii
I would like to express deep gratitude to Professor Adrian Oehmen for the opportunity to perform this work and for his constant support during all these years, his guidance and encouragement to pursuit the goals defined during this work and his friendship and friendly guidance always applied in every situation.
To Professor Maria Ascensão Reis and Doctor Gilda Carvalho for their continuous encouragement, support and guidance throughout my work mainly in finding solutions and new perspectives to approach the problems that I had during my work. And for the scientific discussions and brainstorming and friendship in all the moments.
To all the colleagues in the Bioeng and LMP group, to whom I had the opportunity to work with, collaborate and share joyful moments during all these years I have been part of it. Special thanks to Mónica, Jorge and Virgínia for all the collaboration in the lab and help solving the issues that were needed to overcome during this work. To the people in office 602 for the friendship and companion during this time.
To Doctor Maite Pinjuan for the possibility to work in the Technologies and evaluation Catalan Institute for Water Research, Girona, Spain. For integrating me in the group,
encouragement, enthusiasm and guidance expressed during the 9 months’ collaboration. For all
the people I had the opportunity to work with and meet in ICRA, and specially to Anna, Adri and Corrado and all the people and friends I met during my time in Girona.
To Doctor Mikkel Holmen Andersen and Doctor Lars Hauer Larsen for the joint research Industry project with the Danish company “Unisense” during this work and helpful comments during this collaboration.
To Professor Per Nielsen and Doctor Hien Nguyen for the collaboration developed between our group and the Environmental Engineering group, at the Aalborg University, Denmark.
I would also like to acknowledge the financial support for this thesis, in the form of my PhD
grant (SFRH/BD/74515/2010), awarded from the Fundação para a Ciência e Tecnologia.
A special word goes to my girlfriend, parents, brother and friends for the unconditional
v
Phosphorus (P) and Nitrogen (N) promote eutrophication and their release to the environment can be minimized by efficient wastewater treatment plants (WWTPs). This thesis focuses on two important aspects associated with biological nutrient removal (BNR) from WWTPs, 1) assessing greenhouse gas emissions directly produced during biological treatment and 2) understanding the metabolism associated with a group of polyphosphate accumulating organisms (PAOs) that are highly abundant in WWTPs.
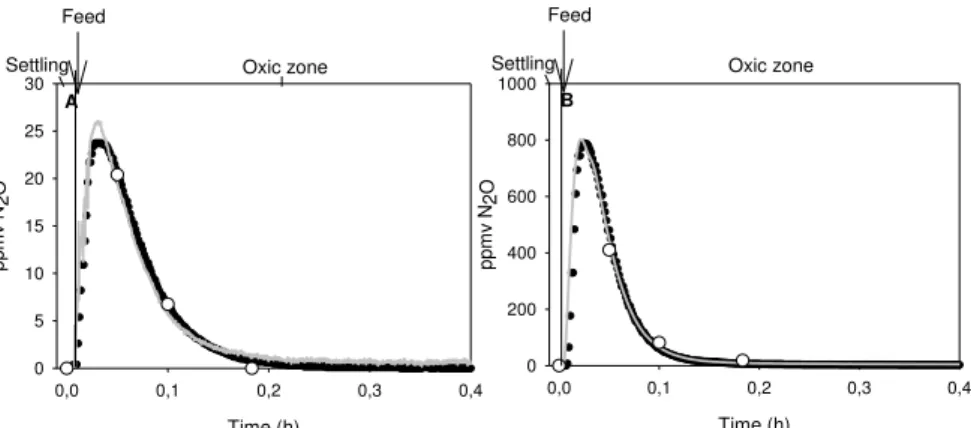
N removal is achieved by nitrification and denitrification, where nitrous oxide (N2O) can be produced as a direct (denitrification) or indirect (nitrification) intermediate of the process. N2O is potent greenhouse gas (GHG) with a radiative force that is 300-fold stronger than carbon dioxide (CO2), and can contribute to over 80% of the total greenhouse gases emitted from WWTPs in some cases. In this work, lab and full-scale sensors for N2O were tested and validated for online gas measurements. The sensors displayed a linear response with different concentration ranges and an exponential correlation between temperature and sensor signal was adequately predicted with few experimental measurements needed. The N2O emission dynamics from lab-scale and full-scale sequencing batch reactors (SBR) systems were accurately described by these sensors, supporting their application for assessing gaseous N2O emissions. This sensor methodology overcomes some limitations of conventional methods that include a wider quantification range, increasing the accuracy of assessing N2O gas emissions. Liquid-phase N2O measurements and mass transfer models were also used to predict online the gaseous N2O emissions.
Tetrasphaera are a highly abundant group of organisms in full-scale BNR systems,
and their metabolism and contribution towards P and N removal was also addressed in this work. A culture enrichment was obtained with Tetrasphaera as the predominant PAO group in addition to the more widely studied Candidatus Accumulibacter, achieving high anaerobic amino acids consumption and P-removal. Tetrasphaera performed the majority of the P removal in this culture and the energy generated by fermentation led to anaerobic P uptake. Batch tests demonstrated that Tetrasphaera had a preference towards the uptake of certain amino acids. Tetrasphaera and Candidatus Accumulibacter were found to contribute to P uptake through different ecological niches. The denitrifying capacity of a Tetrasphaera enriched culture was also assessed in a BNR system through an
vi
as opposed to N2O reduction, and electron competition occurred when two or more electron acceptors were present simultaneously. The increased understanding of the ecological niche of Tetrasphaera-related PAOs has the potential to improve the efficiency of P and N removal in EBPR WWTPs, and understand their contribution towards the production of N2O emissions as well as their versatility for dealing with wastewaters with different compositions of organic carbon.
KEYWORDS: Microsensors, Nitrous oxide (N2O), Biological nutrient removal (BNR),
vii
A contaminação por fósforo (P) e azoto (N) origina problemas ambientais, nomeadamente a eutrofização. A libertação destes nutrientes para o meio ambiente pode ser minimizada através de uma eficiente remoção em estações de tratamento de águas residuais (ETARs). O objetivo desta tese consiste no estudo de dois aspetos importantes associados à remoção biológica de nutrientes (BNR) em ETARs: 1) a avaliação das emissões de gases com efeito de estufa produzidos diretamente durante o tratamento biológico e 2) a compreensão do metabolismo associado a um grupo de organismos acumuladores de fosfatos (PAO), muito abundantes em ETARs.
A remoção biológica de N ocorre através de processos designados por nitrificação e desnitrificação, sendo o óxido nitroso (N2O) um intermediário produzido de forma direta (desnitrificação) ou indireta (nitrificação). O N2O é um gás de efeito estufa (GHG) com uma carga radiativa 300 vezes mais forte do que o dióxido de carbono (CO2), e podendo contribuir, em alguns casos, para mais de 80% do total de GHG emitidos por uma ETAR. Neste trabalho foram testados e validados sensores gasosos de N2O à escala laboratorial e real. Os sensores demonstraram uma resposta linear para diferentes gamas de concentração, e foi possível simular com sucesso a correlação exponencial observada entre a temperatura e sinal do sensor com base num número reduzido de medições experimentais. As emissões de N2O obtidas em reactores à escala laboratorial e real foram descritas com precisão por estes sensores, validando a sua aplicação para monitorizar emissões gasosas de N2O. Os sensores apresentam vantagens em relação a métodos convencionais permitindo a medição de N2O em gamas de concentração mais altas e com maior precisão. Medições de N2O na fase líquida usando modelos de transferência de massa permitiram ainda prever emissões gasosas em tempo real.
Tetrasphaera é um grupo de microrganismos muito abundante em sistemas BNR à
viii
sequenciais anaeróbio/anóxico/aeróbio e alimentado com aminoácidos. Membros do género Tetrasphaera, que dominavam a comunidade, foram os principais responsáveis pela desnitrificação, no entanto a remoção anóxica de fósforo foi mais baixa do que normalmente observado por Candidatus Accumulibacter. A cultura demonstrou uma maior preferência pela redução de nitrato e nitrito em comparação com o N2O, ocorrendo competição quando dois ou mais aceitadores de eletrões estavam presentes simultaneamente. Este estudo permitiu compreender melhor o papel das PAOs Tetrasphaera na remoção biológica de P e N em ETARs, elucidar a sua contribuição para
as emissões de N2O, e entender a sua versatilidade na utilização de diferentes composições de carbono orgânico.
PALAVRAS-CHAVE: Micro sensores, óxido nitroso (N2O), remoção biológica de nutrientes,
ix
1 MOTIVATION AND THESIS OUTLINE ... 1
1.1 MOTIVATION AND OBJECTIVES ... 3
1.2 THESIS OUTLINE ... 5
2 STATE OF THE ART ... 9
2.1 BIOLOGICAL NUTRIENT REMOVAL: ... 12
2.2 FACTORS PROMOTING N2O PRODUCTION... 13
2.2.1 NITRIFICATION... 13
2.2.2 DENITRIFICATION... 14
2.2.3 N2OMITIGATION STRATEGIES ... 15
2.3 N2O EMISSIONS FROM LAB-SCALE AND FULL-SCALE SYSTEMS ... 15
2.4 MONITORING METHODOLOGIES ... 16
2.5 ENHANCED BIOLOGICAL PHOSPHORUS REMOVAL ... 17
2.6 MAIN ORGANISMS INVOLVED IN EBPR SYSTEMS... 18
2.6.1 ACCUMULIBACTER ... 18
2.6.2 GLYCOGEN ACCUMULATING ORGANISM ... 20
2.6.3 TETRASPHAERA-RELATED ORGANISM ... 22
2.7 N2O ACCUMULATION IN EBPR SYSTEMS ... 26
2.8 THESIS RATIONALE ... 27
REFERENCES ... 30
3 A NOVEL MICROELECTRODE-BASED ONLINE SYSTEM FOR MONITORING N2O GAS EMISSIONS DURING WASTEWATER TREATMENT ... 39
3.1 INTRODUCTION ... 41
3.2 MATERIALS AND METHODS ... 43
3.2.1 EXPERIMENTAL PROCEDURE ... 44
3.3 RESULTS AND DISCUSSION ... 46
3.3.1 LINEARITY OF THE SENSOR ... 46
3.3.2 REPETITIVE AND RANDOM PEAK TESTS ... 47
3.3.3 EFFECT OF THE TYPE OF GAS AND FLOWRATE ON SENSOR SIGNAL ... 48
3.3.4 RESPONSE TIME ... 48
3.3.5 SIGNAL DRIFT OVER TIME ... 49
3.3.6 TEMPERATURE DEPENDENCY ... 49
3.3.7 EFFECT OF HUMIDITY ... 51
x
3.4 CONCLUSIONS ... 53
REFERENCES ... 55
4 ASSESSMENT OF ONLINE MONITORING STRATEGIES FOR MEASURING N2O EMISSIONS FROM FULL-SCALE WASTEWATER TREATMENT SYSTEMS ... 57
4.1 INTRODUCTION ... 59
4.2 MATERIALS AND METHODS ... 60
4.2.1 EXPERIMENTAL SETUP FOR FULL-SCALE SENSOR CALIBRATION ... 60
4.2.2 EXPERIMENTAL PROCEDURE ... 62
4.3 RESULTS AND DISCUSSION ... 67
4.3.1 FULL-SCALE N2O SENSOR CALIBRATION ... 67
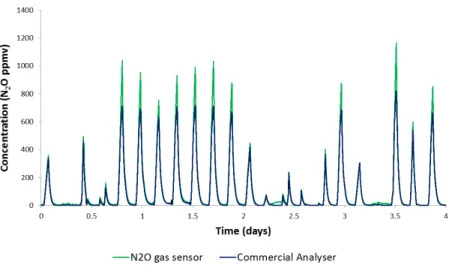
4.3.2 COMPARING THE N2O GAS SENSOR WITH THE ONLINE GAS ANALYSER AT FULL-SCALE……… ... 69
4.3.3 N2O GAS SENSOR ESTIMATION THROUGH DISSOLVED N2O MEASUREMENTS… ... .71
4.3.4 COMPARISON OF N2O MONITORING METHODOLOGIES ... 75
4.4 CONCLUSIONS ... 76
REFERENCES ... 78
5 METABOLISM AND ECOLOGICAL NICHE OF TETRASPHAERA AND ACCUMULIBACTER IN ENHANCED BIOLOGICAL PHOSPHORUS REMOVAL ... 81
5.1 INTRODUCTION ... 83
5.2 MATERIALS AND METHODS ... 85
5.2.1 SBR OPERATION ... 85
5.2.2 BATCH TEST ... 85
5.2.3 CULTURE MEDIA ... 88
5.2.4 CHEMICAL ANALYSES ... 88
5.2.5 MICROBIAL CHARACTERISATION AND MAR-FISH ... 90
5.2.6 MASS AND ENERGY BALANCES ... 91
5.3 RESULTS AND DISCUSSION ... 93
5.3.1 SBR PERFORMANCE AND MICROBIAL COMPOSITION ... 93
5.3.2 UNDERSTANDING THE METABOLISM OF TETRASPHAERA WITH DIFFERENT CARBON SOURCES ... 98
5.3.3 INDIVIDUAL AA UPTAKE AND INTRACELLULAR METABOLITES ... 105
xi
6 DENITRIFYING CAPABILITIES OF TETRASPHAERA AND THEIR CONTRIBUTION TOWARDS NITROUS OXIDE PRODUCTION IN ENHANCED BIOLOGICAL PHOSPHORUS REMOVAL
PROCESSES…. ... 113
6.1 INTRODUCTION ... 115
6.2 MATERIAL AND METHODS ... 117
6.2.1 SEQUENTIAL BATCH REACTOR OPERATION ... 117
6.2.2 CULTURE MEDIA ... 118
6.2.3 BATCH REACTOR SETUP AND OPERATION ... 118
6.2.4 CONTRIBUTION OF TETRASPHAERA AND COMPETIBACTER TO NOX REDUCTION……… ... 120
6.2.5 CALCULATION OF THE REDUCTION RATES ... 120
6.2.6 CHEMICAL ANALYSES ... 121
6.2.7 MICROBIAL CHARACTERISATION ... 121
6.3 RESULTS AND DISCUSSION ... 122
6.3.1 SBR PERFORMANCE AND MICROBIAL COMPOSITION ... 122
6.3.2 CONTRIBUTION OF TETRASPHAERA AND COMPETIBACTER TO NOX REDUCTION……… ... 126
6.3.3 DENITRIFICATION CAPABILITIES OF TETRASPHAERA CULTURE ... 127
6.3.4 ELECTRON COMPETITION AND DISTRIBUTION ... 130
6.4 CONCLUSIONS ... 133
REFERENCES ... 134
7 GENERAL CONCLUSIONS AND FUTURE WORK ... 139
7.1 GENERAL CONCLUSIONS ... 140
7.2 FUTURE WORK ... 141
APPENDICES –A TO D ... 145
APPENDIX A ... 146
APPENDIX B ... 151
APPENDIX C ... 157
xiii
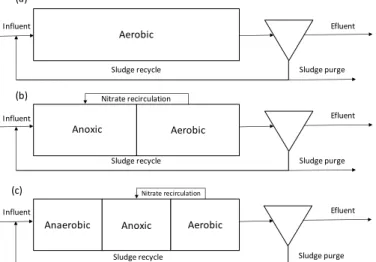
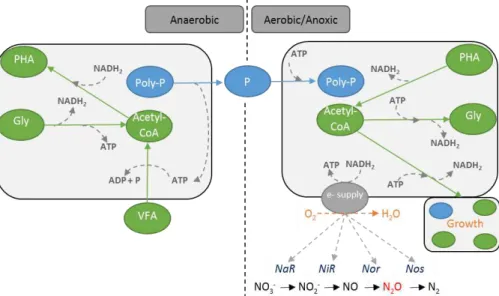
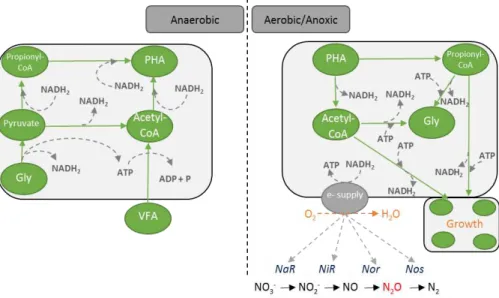
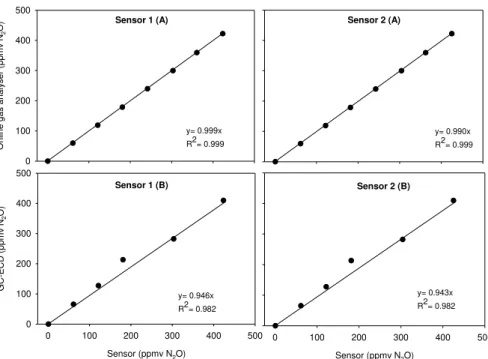
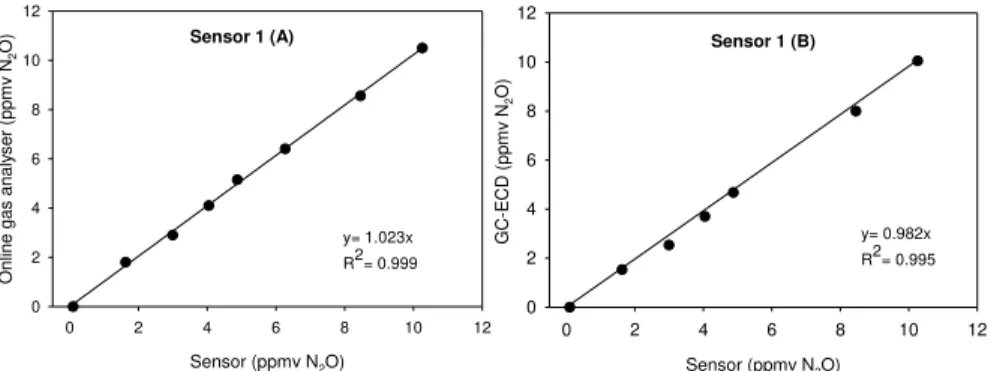
Figure 2.1 – Examples of WWTP configurations: a) the Conventional Activated Sludge process; b) Biological Nitrogen Removal process; c) Enhanced Biological Phosphorus Removal. ... 12 Figure 2.2 – Representation of N2O production and consumption pathways during BNR (adapted from Desloover et al., (2012)). ... 13 Figure 2.3 – Simplified schematic representation of Accumulibacter PAO metabolism in anaerobic and anoxic/aerobic conditions. ... 19 Figure 2.4 – Simplified schematic representation of GAO metabolism in anaerobic and anoxic/aerobic conditions. ... 22 Figure 2.5 – FISH images of Tetrasphaera in activated sludge, Tet3-654 (a), Tet2-892 (b), Tet2-174 (b), Tet3-654 (d). In yellow are shown Tetrasphaera while other bacteria are in green (Nguyen et al., 2011). ... 23 Figure 2.6 – Simplified schematic representation of Tetrasphaera metabolism in anaerobic and anoxic/aerobic conditions, adapted from Kristiansen et al., (2013). ... 26 Figure 3.1 – High-range concentration measured by the commercial gas analyser vs sensors (1 and 2, A) and GC-ECD vs Sensors (1 and 2, B) at controlled temperature (25 °C) and with nitrogen as dilution gas. ... 46 Figure 3.2 – Low-range concentration measured by the online gas analyser (A) and
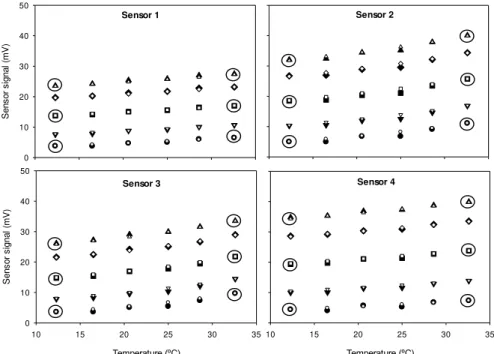
GC-ECD (B) vs Sensor 1 with N2 as dilution gas at a controlled temperature (25 °C). ... 47 Figure 3.3 – Exponential variation of sensor signal with five different N2O gas mixtures (● 0 ppmv, 10.2 ppmv, ■ 25.5 ppmv, ◊ 40.3 ppmv, ▲ 50.1 ppmv) as a function of temperature at a range of 10 to 35 °C, for the four sensors. ... 50 Figure 3.4 – Measured (black symbols) and predicted (white symbols) signal values for concentrations of 0 (● ○), 10.2 (▼ ), 25.5 (■□), 40.3 (♦ ◊) and 50.1 (▲ ∆) ppmv of N2O for the four sensors. Prediction equations for each sensor were 1) SN2O(T,C) = 2.736e0.027T+0.380.C.e0.003T, 2) S
N2O(T,C) = 3.067e0.039T+0.512.C.e0.004T, 3) SN2O(T,C) = 1.967e0.049T+0.426.C.e0.003T, 4) S
xiv
(25 ºC): NOB (a) and AOB (b), as measured with the N2O sensor (grey line), Commercial analyser (black line) and GC (white circles). ... 53 Figure 4.1 – A– Full-scale N2O gas sensor and controller box; B – Full-scale dissolved N2O sensor and controller box; C – Close-up of the gas sensor placed in the sampling hood; D – Sampling hood placed in the full-scale activated sludge SBR. . 61 Figure 4.2 – A - SBR Exponential variation of sensor signal with three different N2O gas
xv
xvii
xviii
... 106 Table 6.1 – Denitrifying abilities of organisms present in EBPR systems ... 116 Table 6.2 – Batch tests performed with different combinations of electron acceptors .... 119 Table 6.3 – Typical cycle study (Anaerobic/anoxic/aerobic) obtained during SBR operation and comparison with Accumulibacter under similar operational conditions (Ribera-Guardia et al., 2016) and with Tetrasphaera + Accumulibacter under anaerobic/aerobic conditions. ... 124 Table 6.4 – Morphologies present in the SBR sludge and % volume fraction of Competibacter and each Tetrasphaera-related clade. Results obtained are an
average of 3 samples taken during the experimental period. ... 125 Table 6.5 – Rate of NOx consumed, glycogen production rate, uptake rate and ratio
P-uptake/NOx and obtained during batch tests A, B, D, E, F and G with the Tetrasphaera enrichment. ... 130
xix
phaB Acetoacetyl-CoA reductase gene
phaA Acetyl-CoA acetyltransferase gene
ATP Adenosine triphosphate molecule
adk Adenylate kinase
ald Alanine dehydrogenase
adh Alcohol dehydrogenase
aldA Aldehyde dehydrogenase
NH4+ Ammonium
AOB Ammonium oxidizing bacteria
BNR Biological nutrient removal
CO2 Carbon dioxide
Cas aa Casein hydrolysate
COD Chemical oxygen demand
N2 Di-nitrogen
DPAOs Denitrifying PAOs
DO Dissolved oxygen
EBPR Enhanced biological phosphorus removal
FISH Fluorescence in situ hybridisation
FNA Free nitrous acid
GAO Glycogen accumulating organisms
GC Gas chromatography
GC-ECD GC–electron capture detector
GC-MS GC–mass spectrometry
GHG Greenhouse gas
NH2OH Hydroxylamine
Pst High affinity phosphate specific transporter
HRT Hydraulic retention time
Pit Low affinity phosphate transporter
MAR-FISH Microautoradiography-FISH
NADH Nicotinamide adenine dinucleotide
NO3- Nitrate
nar Nitrate reductase
NO2- Nitrite
xx
nor Nitric reductase
N Nitrogen
NOx Nitrogen oxide species
N2O Nitrous oxide
nos Nitrous oxide reductase
PO4-3-P Orthophosphate
P Phosphorus
PAO Polyphosphate accumulating organisms
PHA Polyhydroxyalkanoates
phaC PHA synthase gene
PH2MB Polyhydroxy-2-methylbutyrate
PH2MV Polyhydroxy-2-methylvalerate
PHB Polyhydroxybutyrate
PHV Polyhydroxyvalerate
Poly-P Polyphosphate
pap Polyphosphate AMP phosphotransferase
ppk Polyphosphate kinase
ppk1 Polyphosphate kinase 1
ppk2 Polyphosphate kinase 2
R2 Coefficient of determination
SBR Sequencing batch reactor
SRT Solid retention time
SEIFC Surface emission isolation flux chamber
TCA Tricarboxylic acid
TOC Total organic carbon
TSS Total suspended solids
UQ/UQH2 Ubiquinone/ubiquinol pool
USEPA United States environmental protection
agency
VFA Volatile fatty acids
VSS Volatile suspended solids
xxi
ATank Aeration field size
Ahood Area of the tank covered by the hood
CN2O, air Average concentration of N2O in the atmosphere of the northern hemisphere SN2O Liquid sensor Concentration of dissolved N2O measured by the N2O liquid
microsensor, after temperature compensation
CN2O Concentration of N2O
SN2O Gas sensor Concentration of N2O in the gas measured by the N2O gas sensor, after temperature compensation SN2OTproc Concentration of N2O in the liquid measured by the N2O
liquid microsensor without temperature compensation
SN2OTComp Concentration of N2O in the liquid measured by the N2O liquid microsensor, after temperature compensation
DL Depth of lab stripping column
DR Depth over the diffuser of the reactor
Gas emitted (aerated) Emissions of N2O during the aerated phases
Gas emitted (non-aerated) Emissions of N2O during the non-aerated phases
-ΔsolnH Enthalpy of the solution
a1 Fitting parameters
b1 Fitting parameters
Qin Flow at which the sample conditioning system pumps gas into the analyser
R Gas constant
Qgas(aerated) Gas flow coming out of the reactor during aerated zones HN2O,Tprocess Henry`s constant at the process temperature
KH Henry’s constant at process temperature
KHᶿ Henry’s constant at standard temperature
S Microsensor signal
mV millivolt
DFN2O Molecular diffusivity of N2O in water
DFO2 Molecular diffusivity of oxygen in water
C N2O concentration
xxii KLaO2 (20°C)
DOsat Oxygen saturation concentration in water at 20°C OTRLiq.-Gas Oxygen transfer rate
OUR Oxygen uptake rate
F Reduction in transfer rate caused by fouling in the air
diffusers
α Reduction in transfer rate caused by impurities in WWTP
β Reduction in transfer rate caused by salinity
ϴ Standard factor
Tᶿ Standard temperature
Vg Superficial gas velocity of the reactor
T Temperature
Tcalibration Temperature of the water when the calibration was performed Tprocess Temperature of water during the monitoring process
Δt Time interval by which the off-gas concentration was recorded
SPECIFIC TERMS IN CHAPTERS 5 AND 6
Aerobic phosphate transport coefficient (PAO only)
GlycogenFORMATION ATP consumed per C-mmol of aspartate consumed MaitenanceANO2 ATP consumed per C-mmol of glycogen consumed GlycogenConsumption ATP generated per C-mmol of glycogen consumed
PUPTAKE ATP mmol consumed per P-mmol uptake
AspartateAC
ATP mmol generated per aspartate C-mmol fermented to acetate
GlucoseAC
ATP mmol generated per glucose C-mmol fermented to Acetate
GlutamateAC
ATP mmol generated per glutamate C-mmol fermented to Acetate
GlycineAC
ATP mmol generated per glycine C-mmol fermented to acetate
xxiii
(YNADH_ATP) ATP produced per NADH oxidized (Aerobic P/O ratio) rNar,e Electron consumption rates for Nar
rNir,e Electron consumption rates for Nir
rNor,e Electron consumption rates for Nor
rNos,e Electron consumption rates for Nos
rNO Maximum consumption rates of N2O
rN2O Maximum consumption rates of NO
rNO2- Maximum consumption rates of NO2
-rNO3-, Maximum consumption rates of NO3
- Percentage of Acetyl-CoA* in PHA
Percentage of Propionyl-CoA* in PHA
c PH2MV fraction in PHA
a PHB fraction in PHA
b PHV fraction in PHA
1
1
M
OTIVATION AND
T
HESIS OUTLINE
3
1.1
M
OTIVATION ANDO
BJECTIVESIncreasing levels of Phosphorus and Nitrogen are being released into the environment, affecting water bodies and promoting eutrophication. Wastewater treatment plants (WWTPs) are an instrument to minimise the release of these two key elements. Biological nutrient removal (BNR) processes has been used from many years as a reliable method to reduce organic carbon, P and N before releasing it into the environment. Removal of N is achieved by Nitrification and Denitrification. Nitrous oxide (N2O) is an intermediate of the process than can accumulate and end up being released in the dissolved or gaseous form. N2O is potent greenhouse gas (GHG) with 300-fold stronger radiative force than carbon dioxide (CO2) and has been found to contribute over 80% of the total greenhouse gases emitted from WWTPs. It is important to minimise N2O production and understand its release into the environment. N2O gas emissions can be analysed with off-line methodologies, although these can lead to an over or under estimation of N2O emissions due to their high variability over time. Current online methodologies, based on online analysers, require gas sample preconditioning and minimum gas flowrates, leading to increased uncertainty at low N2O concentrations. Surpassing the limitations inherent to these methodologies to measure N2O gaseous concentrations would be advantageous for modelling and optimization proposes. The integration of N2O liquid and gas measurements would allow validation mass transfer relationships used to describe gaseous N2O emissions using liquid data measurements. This approach would enable the estimation of liquid and gas N2O fluxes with one measurement in order to study N2O production and consumption mechanisms.
P removal is typically achieved by polyphosphate accumulating organism (PAOs). These organisms are selected by anaerobic and aerobic sequential operational conditions in a process known as enhanced biological phosphorus removal (EBPR). Typically, these organisms uptake organic acids anaerobically and use internal carbon metabolites to P removal in aerobic and/or anoxic conditions. Tetrasphaera-related organisms are putative PAOs and uptake amino acids, while little
4
Accumulibacter. In full-scale EBPR plants, P-removal is usually combined with
N-removal. Tetrasphaera have been reported to have the potential to remove nitrogen oxide (NOx) species while no report has shown their capability to perform full denitrification. Consumption of electron donors, as internal metabolites, has been associated as a key factor triggering N2O production and emissions. Acclimatization of a Tetrasphaera culture to perform N and P removal would allow us to understand the contribution of this organism to denitrification in full-scale EBPR plants. Wastewater is usually composed of up to 30% of proteins and amino acids, and the potential of this carbon source to be used in P and/or N removal should be assessed to improve the removal of these two key elements in EBPR WWTPs.
This thesis includes the following main goals in its scope:
To study the performance and validate a new sensor for online N2O gas measurements and assess its feasibility for application in lab-scale systems with different emission ranges.
To assess the applicability of N2O gas-phase electrodes to quantify the emissions from a full-scale WWTP. Integration of liquid and gas-phase sensor measurements to compare different methodologies to estimate N2O gas emissions from dissolved N2O measurements.
To operate bioreactor in order to enrich Tetrasphaera-related organisms from EBPR sludge, aiming at investigating their mechanism for achieving P-uptake with amino acids. Also to establish their metabolic transformations, assess storage products and their ability to metabolise different carbon sources.
5
1.2
T
HESIS OUTLINEThe content of this thesis is divided in seven chapters, describing the work performed during this PhD project:
Chapter 1 includes the Motivation and Objectives along with this Thesis outline.
Chapter 2 comprises a bibliographic review regarding P and N removal applying Biological Nutrient Removal processes. This review focusses on Nitrification and Denitrification processes in BNR, the main factors involved in the production, accumulation and emission of N2O, a GHG, in lab-scale and full-scale WWTPs, and the methodologies used for quantifying N2O emissions in WWTPs. The EBPR process, the organisms involved in EBPR, denitrifying EBPR and factors triggering N2O production by organisms present in EBPR systems are also contained within this review.
Chapter 3 comprises the validation of a new online methodology using Clark-type nitrous oxide (N2O) microelectrodes to measure N2O emissions from lab-scale wastewater systems. The microelectrodes were tested and validated for online gas measurements and assessed with respect to the key factors affecting their performance. The N2O emission dynamics were validated in two lab-scale SBRs performing N removal with different emission ranges.
This work was published in an international peer reviewed scientific journal article: Marques, R., Oehmen, A., Pijuan, M., 2014. Novel Microelectrode-Based Online System for Monitoring N2O Gas Emissions during Wastewater Treatment. Environ. Sci. Technol. 48, 12816–12823 (DOI information: 10.1021/es504061h).
6
in literature to predict N2O emission based on liquid N2O measurements was performed.
This work was accepted for publication in an international peer reviewed scientific journal at the date of the thesis delivery: Marques, R., Rodriguez-Caballero, A., Oehmen, A., Pijuan, M., 2016. Assessment of online monitoring strategies for measuring N2O emissions from full-scale wastewater treatment systems, Water Research (in press, DOI information: 10.1016/j.watres.2016.04.052).
Chapter 5 comprises the enrichment of two abundant polyphosphate accumulating organisms, Tetrasphaera and Accumulibacter, to evaluate metabolic behaviour and ecological niche of each culture. Microautoradiography and fluorescence in situ hybridisation as well as energetic balances were used in order to differentiate the niche of Tetrasphaera and Accumulibacter in the enriched cultures through a series of anaerobic-aerobic batch tests fed with either an amino acid, VFA or glucose. Anaerobic fermentation of amino acids was found to lead to P uptake instead of P release. Chemical analytical methodologies were applied to identify the internal metabolites stored by Tetrasphaera as carbon sources that can be used for aerobic P uptake.
Portions of this work will be submitted to international peer reviewed scientific journals, including: Marques, R., Santos, J., Nguyen, H., Carvalho, V., Carvalho, G., Freitas, E., Noronha, J. P., Nielsen, P. H., Reis, M. A. M., Oehmen, A., 2016 (in preparation). Metabolism and ecological niche of Tetrasphaera and Accumulibacter in enhanced biological phosphorus removal.
Chapter 6 comprises the acclimatization of the enriched culture obtained in Chapter 5 to anaerobic-anoxic-aerobic conditions to evaluate Tetrasphaera’s denitrifying capabilities. The performance of this culture was compared to Accumulibacter and GAO cultures operated under similar conditions. Energetic
7
This work will be submitted to an international peer reviewed scientific journal: Marques, R., Ribera-Guardia, A., Santos, J., Carvalho, G., Reis, M. A. M., Pijuan, M., Oehmen, A., 2016 (in preparation). Denitrifying capabilities of Tetrasphaera and their contribution towards nitrous oxide production in enhanced biological phosphorus removal processes
Chapter 7 includes a summary of the main findings obtained in this work along with some questions that emerged from the present work that should be addressed in the future.
Other relevant publications not included in this thesis:
Rodriguez-Caballero, A., Aymerich, I., Marques, R., Poch, M., Pijuan, M., 2015. Minimizing N2O emissions and carbon footprint on a full-scale activated sludge sequencing batch reactor. Water Res. 71, 1–10.
9
2
S
TATE OF THE ART
11
Phosphorus (P) and Nitrogen (N) are two key elements essential to life, with the undesirable effect of promoting eutrophication of waterbodies, when released in excess (Tchobanoglous et al., 2003). This problem is mainly caused by growth of algae and other photosynthetic microorganisms such as toxic cyanobacteria (blue-green algae) in natural clean water. Eutrophication can lead to dissolved oxygen (DO) depletion causing decrease of aquatic wildlife, especially fish, and water contamination by reducing the drinking water quality. Free ammonia is toxic to the aquatic environment and especially to fish. With a lower effect on promoting eutrophication as compared with P, N can also be released into the environment in its gaseous form, where stable atmospheric gas phases associated within its natural cycle (Ip et al., 2001; Tchobanoglous et al., 2003). Of the gaseous nitrogenous species, nitrous oxide (N2O) is known as a potent greenhouse gas with 300-fold stronger radiative force than carbon dioxide and is the primary ozone-depleting substance of the 21st century (IPCC, 2013; Portmann et al., 2012; Ravishankara et al., 2009). Thus, the releases of N sources can contribute to atmospheric contamination and to global warming.
12
2.1
B
IOLOGICALN
UTRIENTR
EMOVAL:
Biological nitrogen removal process aims at converting influent nitrogen sources into gaseous di-nitrogen (N2). Biological nitrogen removal is typically divided into three main steps (Figure 2.1, b): mineralization (conversion of complex organic nitrogen into ammonium (NH4+)); nitrification (biological oxidation of NH4+ to NO3-) and denitrification (biochemical reduction of NO3- to gaseous N2). The addition of an anaerobic zone, prior to the anoxic zone allows conditions for the selection of organisms able to perform P removal (Figure 2.1, c) (Barnard, 1975; Grady et al., 2011; Wiesmann et al., 2006). When biological phosphorus removal is combined with nitrification and denitrification, the process is known as Biological Nutrient Removal.
Aerobic
Anoxic Aerobic
Anaerobic Anoxic Aerobic
Sludge recycle Sludge purge
Sludge recycle Sludge purge
Nitrate recirculation
Sludge purge Nitrate recirculation
Sludge recycle (a)
(b)
(c) Influent
Influent
Influent
Efluent
Efluent
Efluent
Figure 2.1 – Examples of WWTP configurations: a) the Conventional Activated Sludge process; b) Biological Nitrogen Removal process; c) Enhanced Biological Phosphorus Removal.
13
2006) (Figure 2.2). The denitrification reduction process is mediated by four different denitrification reductases, NO3- reductase (Nar), NO2- reductase (Nir), NO reductase (Nor) and N2O reductase (Nos) (Zumft, 1997). Denitrification is performed by ordinary heterotrophic organisms, under anoxic conditions by reducing NO3- or NO2- (electron acceptors) coupled with oxidation of organic matter (electron donors) to CO2 and water (H2O). N2O is an intermediate of this process and several factors have been identified to promote the accumulation of this intermediate (Kampschreur et al., 2009).
Nitritation
N2
NO2
-NO3
-N2O
AOB
NOB
De nitrifie rs
NH4+
NH2OH NO
Nitratation Heterotrophic denitrification pathway Nitrifier denitrification pathway O2 O2 NOS (Nitrous oxide reductase) NOR NOR (Nitric oxide reductase)
NirS or NirK NirK (Nitrite reductase) Nar (Nitrate reductase) HAO HAO (Hydroxylamine oxireductase) AMO (Ammonia monooxygenase) Hydroxylamine pathway
Figure 2.2 – Representation of N2O production and consumption pathways during BNR (adapted from Desloover et al., (2012)).
2.2
F
ACTORS PROMOTINGN
2O
PRODUCTION2.2.1 Nitrification
14
which leads to N2O production and emission, is influenced by several operational conditions. One of the factors promoting N2O production by this pathway is the oxygen level (Tallec et al., 2006). Limiting DO levels in aerobic zones has been associated with an increase in N2O production by AOBs (Chuang et al., 2007; Goreau et al., 1980). Meanwhile, high aeration levels have been associated with an increase in N2O production by partial or full nitritation systems (Brotto et al., 2015; Kampschreur et al., 2009). With high DO concentrations, the hydroxylamine pathway (Figure 2.2) contribution to N2O production has been observed to be of increased importance (Law et al., 2013; Ni and Yuan, 2015). In the hydroxylamine pathway, N2O can be formed as a by-product during NH2OH oxidation (biological and/or chemical) to NOH, followed by NO2- (Law et al., 2012). In a recent work, Ni et al., (2014) created metabolic models to describe the N2O production by the hydroxylamine and nitrifier denitrification pathways. Transient conditions, which involves rapid changes in the process conditions, changes in DO concentration, NH4+ shock loads, NO2- levels can also trigger production of N2O by AOBs (Ahn et al., 2010; Kampschreur et al., 2009; Tallec et al., 2006; Yu et al., 2010). Recovery from anoxic conditions to aerobic conditions was observed to shift the low specific metabolic activity to high metabolic activity in AOBs, also triggering N2O production (Ahn et al., 2010; Yu et al., 2010). NO2- accumulation has been shown to be an important factor leading to increased N2O production in lab-scale and full-scale systems (Foley et al., 2010; Kampschreur et al., 2009; Law et al., 2012). However, very high NO2- concentration (> 50 mgN/L) can inhibit the nitrifier denitrification pathway, leading to less N2O production (Law et al., 2013). Other factors can promote N2O production indirectly by leading to NO2- accumulation, favouring the activity of AOBs over NOBs. These factors include high temperature, short sludge retention times (SRT), high salinity, presence of sulphides, heavy metals and toxic compounds (Kampschreur et al., 2009). While nitrification has been more frequently associated with the N2O production as compared with denitrification, some studies suggested that denitrification can play a significant role in N2O production in WWTPs.
2.2.2 Denitrification
15
Otte et al., 1996; Tallec et al., 2008). Also, NO2- accumulation has an impact on the NO and N2O reduction, leading to N2O accumulation (Schulthess et al., 1995). Low COD/N ratios, often resulting from a lack of organic matter, can also contribute to N2O production (Kishida et al., 2004; Schulthess and Gujer, 1996). When subjected to low COD/N ratios, denitrification enzymes compete for electron donors, where NO and N2O reductases have lower affinity for electrons as compared with NO3- and NO2 -reductases (Law et al., 2012). N2O accumulation was also observed under non-limiting chemical oxygen demand (COD) levels when testing denitrifying cultures with different carbon sources (Pan et al., 2013; Ribera-Guardia et al., 2014).
2.2.3 N
2O Mitigation strategies
Some of the main factors contributing to N2O production can be mitigated by applying certain strategies: accumulation of NO2- can be avoided by promoting full nitrification (Ahn et al., 2010; Rodriguez-Caballero and Pijuan, 2013); low DO can be avoided by maintaining high aeration in aerobic zones (Rodriguez-caballero et al., 2014); accumulation of ammonia and NO2- can be minimised by applying intermittent aeration strategy (alternating short aerobic with short anoxic phases in Sequencing batch Reactor (SBR) systems) (Rodriguez-Caballero et al., 2015).
2.3
N
2O
EMISSIONS FROM LAB-
SCALE AND FULL-
SCALE SYSTEMS16
activated sludge (Benthum et al., 1998); anaerobic–anoxic SBR activated sludge Zeng et al., (2003b) and oxic–anoxic SBR activated sludge (Lemaire et al., 2006). In full-scale systems a smaller but still very significant variability was observed (0-14.6% of the N-load) within most of the different WWTPs studied: 25 activated sludge plants Wicht and Beier (1995); 12 different configurations of WWTPs Ahn et al., (2010); full-scale nitrifying activated sludge systems Aboobakar et al., (2013); Ye et al., (2014) Rodriguez-Caballero et al., (2015). An emission factor as low as 0.5% of total nitrogen removed as N2O can lead to emissions comparable to the indirect CO2 emissions related with energy consumption in conventional biological nutrient removal WWTPs
(de Haas and Hartley 2004)
, while in some cases N2O emissions have been found tocontribute over 80% to the total greenhouse gases emitted from WWTPs (Daelman et al., 2013a; Daelman et al., 2013b). This implies that it is very important to correctly measure the emissions using online monitoring methodologies. N2O analysers should have high versatility to measure very high and very low emission peaks/concentrations emitted from these systems.
2.4
M
ONITORING METHODOLOGIESDue to its impact on N2O emissions, substantial efforts have been performed to identify where the majority of the emissions occur, as well as their dynamics, using on-line monitoring methodologies for quantification. Initially monitoring campaigns were performed off-line with grab-sampling methods and the concentration was quantified using gas chromatography with an electron capture detector (GC-ECD) (Jenni et al., 2012; Yu et al., 2010). This methodology can lead to an over or under estimation of N2O emissions due to their high variability over time. Currently, the majority of monitoring campaigns are performed using online methodologies based on N2O
17
helium gas tracer. This methodology can be applied to aerated and non-aerated zones of the WWTP.
Due to its complexity, alternative methodologies have been applied for calculating the gas flow rate. This is obtained by measuring the air flow in the blower air piping and dividing it by the area of the grid of the diffuser, or alternatively, obtaining the gas flow out of the hood by installing a gas flow meter. In non-aerated zones, the emission gas flux can be obtained with the sweep gas method. With a hood vent port open, atmospheric air will be pulled into the hood at a known gas flow defined by the online gas analyser. The emission of gas flow from the tank can then be calculated by performing a mass balance between the concentration of oxygen inside the hood and the atmospheric oxygen concentration measured. This methodology has been applied to successfully measure the emission of plants with different configurations (Rodriguez-Caballero et al., 2015; Rodriguez-caballero et al., 2014).
Using the protocol developed by (Chandran, 2011, 2009) as a guide, several researchers performed with success adaptations to this methodology to measure emissions from WWTPs based on the following protocol (Aboobakar et al., 2013; Ahn et al., 2010; Desloover et al., 2012; Caballero et al., 2015; Rodriguez-Caballero et al., 2014): (a) apply a floating hood to collect N2O gas emissions; (b) quantify the N2O gas concentration with an online gas analyser; (c) determine the flux of emissions. Pan et al. (2016) proposed a methodology based on a multiple gas hood system connected to an online gas analyser to simultaneously analyse the emissions from various locations, accounting for spatial variability.
To carry the gas from the gas hood to the online gas analyser, air tight PTFE tubing is often used. Typically, these conventional analysers require preconditioning of the gas sample (removing humidity and particles) and a minimum gas flow (0.5 − 1 L/min depending on the analyser). This last step dilutes the concentration of N2O, increasing uncertainty in the low N2O concentration range. These constraints indicate that new online measuring technologies should be developed and validated to better characterize and mitigate the N2O emissions from WWTPs.
2.5
E
NHANCEDB
IOLOGICALP
HOSPHORUSR
EMOVAL18
removal in wastewater treatment plants (WWTP) (Oehmen et al., 2007a). The process consists in enrichment of organisms able to accumulate, in excess, intracellular polyphosphate (poly-P) when subjected to recirculation through anaerobic followed by aerobic and/or anoxic conditions. P is removed from the system by wastage of sludge with a high poly-P content. In full-scale EBPR plants, P-removal is usually combined with N-removal. The process can be achieved in a SBR operated in a single tank with sequential anaerobic and anoxic and/or aerobic phases, followed by settling and decanting to remove the treated water, or in a continuous operation mode, with the wastewater subjected to sequential anaerobic and anoxic and/or aerobic tanks.
The EBPR system has some advantages as compared with typical activated sludge systems (Mullan et al., 2002; Oehmen et al., 2007a): achieves higher P removal (>90%) as compared with conventional activated sludge (20-40%); reduces 20% the sludge production as compared with chemical precipitation.; promotes energy savings (25%) due to less cost associated with sludge treatment; and reduces the use of chemical precipitants (calcium, aluminium and iron slats) to remove phosphorus (Yeoman et al., 1988).
2.6
M
AIN ORGANISMS INVOLVED INEBPR
SYSTEMS2.6.1 Accumulibacter
“Candidatus Accumulibacter phosphatis” (referred to as Accumulibacter hereafter) is the most important Gram-negative identified PAO present in most full-scale EBPR plants. It belongs to the family Rhodocyclaceae of subclass 2 of the Betaproteobacteria. These bacteria demonstrate a typical PAO phenotype, performing
19
polyphosphate kinase (ppk) was used as phylogenetic marker. It was observed that Accumulibacter are divided in two major groups (Type I and II), each comprised of
several subgroups (clades) (He et al., 2007; Mcmahon et al., 2002; Peterson et al., 2008). These two Types of Accumulibacter have in some cases been found to display different morphologies, cocci-bacilli and cocci, respectively for Type I and II (Carvalho et al., 2007; Flowers et al., 2009).
As one of the main organisms involved in EBPR systems, metabolic pathways of Accumulibacter PAO in anaerobic and anoxic/aerobic conditions are intensively
described. These PAOs are able to store large amounts of poly-P aerobically after taking up organic substrates anaerobically, unlike ordinary heterotrophic organisms. Accumulibacter PAOs take up volatile fatty acids (VFAs) (e.g., acetate and propionate)
anaerobically and store them as PHAs. This conversion is mainly obtained with energy from hydrolysis of intracellular poly-P, release of P from the cell and the reducing power obtained from glycolysis of intracellular glycogen (Mino et al., 1987) or the tricarboxylic acid (TCA) cycle (Comeau et al., 1986; Wentzel et al., 1986). More recent findings have indicated that both pathways are active in lab-scale cultures (Hesselmann et al., 2000; Louie et al., 2000; Pereira et al., 1996) and in full-scale plants (A. A. B. Lanham et al., 2013; Zhou et al., 2009). In the subsequent aerobic or anoxic phase, Accumulibacter PAOs degrade PHA as energy source for P uptake and poly-P production, glycogen regeneration, biomass growth and cell maintenance (Figure 2.3, Table 2.1).
20
Accumulibacter PAOs have the capacity to perform P-uptake in aerobic and
anoxic conditions. Simultaneous P and N removal can have the added advantage of savings in plant operational costs. Less COD is required for P and N removal and consequently lower sludge production is obtained. P removal under anoxic conditions promotes savings in aeration by the use of nitrogen instead of oxygen as electron acceptor, leading to a decrease in energy costs (Kuba et al., 1996; Oehmen et al., 2007a). Enriched cultures of denitrifying Accumulibacter PAOs revealed different affinities for NO3- and difference in their capacity to perform partial or complete denitrification (Ahn et al., 2002; Tsuneda et al., 2006; Zeng et al., 2003a; Zilles et al., 2002). This led to the hypothesis that the presence of two groups of PAOs with different capacities to reduce nitrogen oxide (NOx) species exists. In later studies, it was associated to denitrifying PAOs (DPAOs) with Accumulibacter Type I able to reduce NO3- to N2, while Accumulibacter Type II unable to reduce NO3- but could reduce NO2- to N2 (Carvalho et al., 2007; Flowers et al., 2009; Adrian Oehmen et al., 2010).
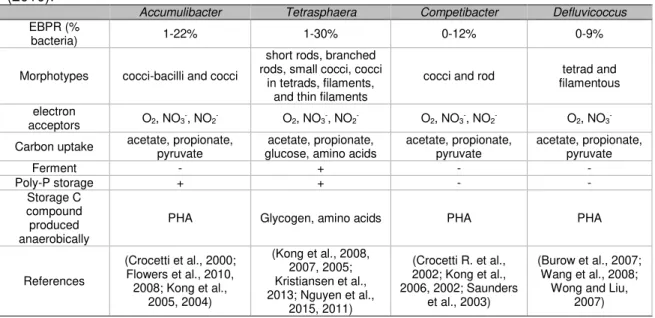
Table 2.1 – Ecophysiology of PAOs and GAOs in EBPR plants adapted from (Nielsen et al., (2010).
Accumulibacter Tetrasphaera Competibacter Defluvicoccus
EBPR (%
bacteria) 1-22% 1-30% 0-12% 0-9%
Morphotypes cocci-bacilli and cocci
short rods, branched rods, small cocci, cocci
in tetrads, filaments, and thin filaments
cocci and rod tetrad and
filamentous
electron
acceptors O2, NO3
-, NO
2- O2, NO3-, NO2- O2, NO3-, NO2- O2, NO3
-Carbon uptake acetate, propionate, pyruvate
acetate, propionate, glucose, amino acids
acetate, propionate, pyruvate
acetate, propionate, pyruvate
Ferment - + - -
Poly-P storage + + - -
Storage C compound produced anaerobically
PHA Glycogen, amino acids PHA PHA
References
(Crocetti et al., 2000; Flowers et al., 2010, 2008; Kong et al.,
2005, 2004)
(Kong et al., 2008, 2007, 2005; Kristiansen et al., 2013; Nguyen et al.,
2015, 2011)
(Crocetti R. et al., 2002; Kong et al., 2006, 2002; Saunders
et al., 2003)
(Burow et al., 2007; Wang et al., 2008;
Wong and Liu, 2007)
2.6.2 Glycogen accumulating organism
21
“Candidatus Competibacter phosphatis” (henceforth referred to as Competibacter) (Crocetti R. et al., 2002; Kong et al., 2006) within the Gammaproteobacteria phylum and Alphaproteobacterial Defluviicoccus vanus-related organisms (Meyer et al., 2006; Wong et al., 2004).
Seven subgroups of Competibacter were identified (GB 1 to 7), exhibiting mainly cocci or rod morphologies. These bacteria can be highly enriched in lab-scale cultures fed with acetate (Crocetti R. et al., 2002; Kong et al., 2002) or present in significant numbers in full-scale plants (Crocetti R. et al., 2002; Kong et al., 2006, 2002; Wong et al., 2005). The other GAOs group identified in some EBPR plants, Defluviicoccus vanus, is composed of four distinct subgroups. Defluviicoccus vanus were generally
observed to be present in full-scale EBPR plants in lower abundance as compared with Competibacter (Burow et al., 2007; Oehmen et al., 2007a; Wong and Liu, 2007; Wong
et al., 2004). Clusters I and II are more highly studied (Meyer et al., 2006; Wong et al., 2004) as compared with cluster III (McIlroy et al., 2010; Nittami et al., 2009) and IV (McIlroy and Seviour, 2009). These bacteria display tetrad and filamentous morphologies (Burow et al., 2007; McIlroy et al., 2010; Nittami et al., 2009).
22
Figure 2.4 – Simplified schematic representation of GAO metabolism in anaerobic and anoxic/aerobic conditions.
2.6.3 Tetrasphaera-related organism
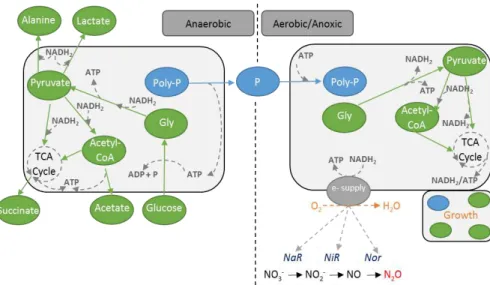
Besides Accumulibacter, another group of bacteria in full-scale EBPR systems is present Tetrasphaera, reaching even higher abundance than Accumulibacter, up to 30% of the total biomass (Kong et al., 2005; A. A. B. Lanham et al., 2013; Mielczarek et al., 2013; Nguyen et al., 2011). However, this Gram-positive organism doesn’t share all of the typical PAO characteristics known from Accumulibacter. These organisms can take up P aerobically and store it intracellularly as poly-P, while assimilating different organic substrates (such as glucose and amino acids) under anaerobic conditions, as assessed through microautoradiography combined with fluorescence in situ hybridisation (MAR-FISH) of full-scale EBPR sludge (Kong et al., 2005; Nguyen et al., 2011). It has been shown that Tetrasphaera-related PAOs cannot store PHAs, although some can take up acetate. Also they can synthesize glycogen, ferment glucose and can express extracellular surface-associated amylases for degradation of starch (Kong et al., 2008; Kristiansen et al., 2013; Nguyen et al., 2011; Xia et al., 2008).
23
elongata (strain LP2) (Hanada et al., 2002), T. elongata (strain ASP12) (Onda and
Takii, 2002), and the filamentous T. jenkinsii, T. vanveenii, and T. veronensis (McKenzie et al., 2006). By using cloned sequences, the isolated species were related with the different clades. Clade 1 includes clones related to sequences of T. elongata and T. duodecadis, and clade 2 contains four isolated species: T. jenkinsii, T. australiensis, T.veronensis and the filamentous “Candidatus Nostocoida limicola”, while clade 3 contains only sequences from uncultured clones (Nguyen et al., 2011).
Figure 2.5 – FISH images of Tetrasphaera in activated sludge, Tet3-654 (a), Tet2-892 (b), Tet2-174 (b), Tet3-654 (d). In yellow are shown Tetrasphaera while other bacteria are in green (Nguyen et al., 2011).
24
able to store PHA. Tetrasphaera’s fermentation capacity was also demonstrated: they were not able to uptake acetate after 3h of continuous feeding, meaning that the storage capacity of the intracellular metabolite was reached and no growth was observed; however, after 9h of continuous feeding, all Tetrasphaera were able to uptake glucose, suggesting that fermentation took place (Nguyen et al., 2011).
Kristiansen et al., (2013) performed genome sequencing of four Tetrasphaera isolates (T. australiensis, T. japonica, T. elongata, and T. jenkinsii) in order to investigate their metabolic pathways. Accumulibacter and Tetrasphaera share some metabolic pathways such as the TCA cycle, glycolysis, gluconeogenesis, and polyphosphate metabolism. However, they differ in other important aspects, especially the ability to ferment, only found in Tetrasphaera (Kristiansen et al., 2013).
Regarding the poly-P metabolic machinery Tetrasphaera share much of it with Accumulibatcer as expressed by the similarity of the genes involved (polyphosphate
25
acetoacetyl-CoA reductase (phaB). However, only in T. japonica all three genes involved in the PHA synthesis were found (phaA, phaB and phaC) (Kristiansen et al., 2013). One of the main differences between Accumulibacter and Tetrasphaera is the capacity of the latter to perform fermentation (Nguyen et al., 2011; Xia et al., 2008). Genes encoding for aldehyde dehydrogenase (aldA), alcohol dehydrogenase (adh) and alanine dehydrogenase (ald), which are involved in glucose fermentation, were found in all Tetrasphaera isolates. Kristiansen et al., (2013) suggested that ethanol and alanine might be end products of glucose fermentation. The reversibility of lactate dehydrogenase suggests T. elongate has the potential to produce lactate as end product of glucose fermentation. Acetate and succinate might be also end products of glucose fermentation in all isolates. The ability of Tetrasphaera to generate energy from fermentation might provide a different niche as compared with Accumulibacter.
A metabolic model based on glucose metabolism for members of the genus Tetrasphaera involved in EBPR systems was proposed by Kristiansen et al., (2013).
They suggested that under anaerobic conditions the Tetrasphaera take up glucose and ferment this to acetate, succinate and other components. Furthermore, glycogen is produced as a storage polymer and the energy required for these anabolic reactions is obtained from fermentation and poly-P degradation. Aerobically, the stored glycogen is degraded to provide carbon and energy for growth, P uptake and poly-P formation. Tetrasphaera metabolism seems more complex and diverse than Accumulibacter,
where development of new biochemical reaction-based models to describe the ecophysiology of this organism should be pursued to better describe and understand their role in EBPR systems (Figure 2.6, Table 2.1).
26
Figure 2.6 – Simplified schematic representation of Tetrasphaera metabolism in anaerobic and anoxic/aerobic conditions, adapted from Kristiansen et al., (2013).
Nguyen et al., (2015) has observed consumption of labelled glycine linked with P release in tests performed with activated sludge and with a T. elongate isolate. Consumption of glycine was also accompanied with accumulation of intracellular glycine and small amounts of glutamine, serine and alanine. This intracellular glycine reached 9-15% of the total carbon consumption, while glutamine, serine and alanine were lower than 1%. A large fraction of the carbon consumed (35-60%) was excreted to bulk media as fermentation products, such as, acetate, succinate and alanine. Interestingly, the non-labelled intracellular glutamate concentration increased during the anaerobic phase, with cells using other carbon sources that were not identified. The uptake of glycine stopped when intracellular pools of poly-P were exhausted in both tests, suggesting glycine uptake was controlled by the amount of intracellular poly-P available. In the subsequent aerobic phase, the stored glycine was consumed along with the other internal metabolites. The oxidation of internal metabolites was linked with P uptake.
2.7
N
2O
ACCUMULATION INEBPR
SYSTEMS27
anoxic SBR activated sludge (Lemaire et al., 2006). However, the factors leading to N2O accumulation have not been clearly identified. Consumption of internal carbon sources, electron competition and NO2- accumulation have been suggested as important factors. In EBPR systems where internal carbon sources (PHAs) are utilised during denitrification as electron donor, electron competition may also impact on N2O accumulation (Kampschreur et al., 2009), although this has yet to be conclusively demonstrated. Although not conclusively demonstrated, some factors have been associated with the production and accumulation of N2O. NO2- accumulation was also observed in some of these studies, where the acidified form of NO2- (free nitrous acid - FNA) was found to be the main factor leading to N2O production, making it difficult to assess the influence of PHA as carbon source towards N2O production independently of FNA accumulation (Zhou et al., 2008). Zhou et al., (2012) also suggested that PHA consumption for denitrification is a potentially rate-limiting step for N2O reduction.
Metabolomics studies performed with pure culture organisms suggest N2O as an end-product of denitrification of Tetrasphaera. The contribution of this abundant organism group present in EBPR systems to N2O accumulation and emission should be considered. Contrarily to Accumulibacter, the intracellular storage compound of Tetrasphaera PAOs has not been entirely revealed, with glycogen, amino acids or
macromolecules being observed as storage compounds (Kristiansen et al., 2013; Nguyen et al., 2015). The consumption of these carbon sources can lead to different affinities to NOx species as compared with Accumulibacter. The role of Tetrasphaera under anoxic conditions should be investigated to understand their contribution to N2O accumulation in EBPR systems.
2.8
T
HESIS RATIONALE28
or under estimation of N2O emissions due to their high variability over time. Current methodologies use online analysers with added advantages compared with off-line methods, however, these analysers require preconditioning of the gas sample (removing humidity and particles) and a minimum gas flow (0.5 − 1 L/min depending on the analyser). These limitations suggest the possibility of developing and validation of new online measuring technologies to improve the characterization of N2O emissions. Mass transfer relationships can be an adequate approach to estimate the N2O emissions using liquid data measurements. The integration of N2O liquid and gas measurements can be used as a validation of these relationships, simplifying the methodology to estimate N2O emissions. This method integration would enable estimation of liquid and gas N2O fluxes with one measurement system in order to study N2O production and consumption mechanisms.
Tetrasphaera are a high abundant organism in full-scale BNR systems, and
29
30
REFERENCES
Aboobakar, A., Cartmell, E., Stephenson, T., Jones, M., Vale, P., Dotro, G., 2013. Nitrous oxide emissions and dissolved oxygen profiling in a full-scale nitrifying activated sludge treatment plant. Water Res. 47, 524–34.
Ahn, J., Daidou, T., Tsuneda, S., Hirata, A., 2002. Characterization of denitrifying phosphate-accumulating organisms cultivated under different electron acceptor conditions using polymerase chain reaction-denaturing gradient gel electrophoresis assay. Water Res. 36, 403–412.
Ahn, J.H., Kim, S., Park, H., Rahm, B., Pagilla, K., Chandran, K., 2010. N2O emissions from activated sludge processes, 2008-2009: results of a national monitoring survey in the United States. Environ. Sci. Technol. 44, 4505–4511.
Barnard, J.L., 1975. Biological nutrient removal without the addition of chemicals. Water Res. 9, 485–490.
Benthum, W.A.J. van, Garrido, J.M., Mathijssen, J.P.M., Sunde, J., Loosdrecht, M.C.M. van, Heijnen, J.J., 1998. Nitrogen removal in intermittently aerated biofilm airlift reactor. J. Environ. Eng. 124, 239–248.
Brotto, A.C., Kligerman, D.C., Andrade, S.A., Ribeiro, R.P., Oliveira, J.L.M., Chandran, K., de Mello, W.Z., 2015. Factors controlling nitrous oxide emissions from a full-scale activated sludge system in the tropics. Environ. Sci. Pollut. Res. 22, 11840– 11849.
Burow, L.C., Kong, Y., Nielsen, J.L., Blackall, L.L., Nielsen, P.H., 2007. Abundance and ecophysiology of Defluviicoccus spp., glycogen-accumulating organisms in full-scale wastewater treatment processes. Microbiology 153, 178–185.
Carvalho, G., Lemos, P.C., Oehmen, A., Reis, M. a M., 2007. Denitrifying phosphorus removal: linking the process performance with the microbial community structure. Water Res. 41, 4383–96.
Chandran, K., 2009. Characterization of nitrogen greenhouse gas emissions from wastewater treatment BNR operations, in: Field Protocol with Quality Assurance Plan (U4R07). Water Environment Research Foundation.
Chandran, K., 2011. Protocol for the measurement of nitrous oxide fluxes from biological wastewater treatment plants., 1st ed, Methods in enzymology. Elsevier Inc.
Chuang, H.P., Ohashi, A., Imachi, H., Tandukar, M., Harada, H., 2007. Effective partial nitrification to nitrite by down-flow hanging sponge reactor under limited oxygen condition. Water Res. 41, 295–302.
Comeau, Y., Hall, K., Hancock, R., Oldham, W., 1986. Biochemical model for enhanced biological phosphorus removal. Water Res. 20, 1511–1521.
Crocetti R., G., Banfield F., J.F., Keller, J., Bond, P.L., Blackall, L.L., 2002. Glycogen-accumulating organisms in laboratory-scale and full-scale wastewater treatment processes. Microbiology 148, 3353–3364.
31
Daelman, M.R.J., De Baets, B., van Loosdrecht, M.C.M., Volcke, E.I.P., 2013. Influence of sampling strategies on the estimated nitrous oxide emission from wastewater treatment plants. Water Res. 47, 3120–3130.
Daelman, M.R.J., van Voorthuizen, E.M., van Dongen, L.G.J.M., Volcke, E.I.P., van Loosdrecht, M.C.M., 2013. Methane and nitrous oxide emissions from municipal wastewater treatment - results from a long-term study. Water Sci. Technol. 67, 2350–5. De Haas, D., Hartley, K., 2004. Greenhouse gas emission from BNR plants-do we have the right focus? In: Paper Presented at the Proceedings of EPA Workshop: Sewage Management, Risk Assessment & Triple Bottom Line. Cairns, Australia, 5-7 April 2004
Desloover, J., Vlaeminck, S.E., Clauwaert, P., Verstraete, W., Boon, N., 2012. Strategies to mitigate N2O emissions from biological nitrogen removal systems. Curr. Opin. Biotechnol. 23, 474–82.
Flowers, J.J., He, S., Carvalho, G., Peterson, S.B., Lopez, C., Yilmaz, S., Zilles, J.L., Morgenroth, E., Lemos, P.C., M, M. a, Crespo, M.T.B., Noguera, D.R., Mcmahon, K.D., 2008. Ecological Differentiation of Accumulibacter in EBPR Reactors. Environment 2008, 31–42.
Flowers, J.J., He, S., Yilmaz, S., Noguera, D.R., McMahon, K.D., 2009. Denitrification capabilities of two biological phosphorus removal sludges dominated by different “Candidatus Accumulibacter” clades. Environ. Microbiol. Rep. 1, 583–588.
Flowers, J.J., He, S., Yilmaz, S., Noguera, D.R., McMahon, K.D., 2010. Denitrification capabilities of two biological phosphorus removal sludges dominated by different “Candidatus Accumulibacter” clades. Environ. Microbiol. Rep. 1, 583–588.
Foley, J., de Haas, D., Yuan, Z., Lant, P., 2010. Nitrous oxide generation in full-scale biological nutrient removal wastewater treatment plants. Water Res. 44, 831–44.
Garcia Martin, H., Ivanova, N., Kunin, V., Warnecke, F., Barry, K.W., McHardy, A.C., Yeates, C., He, S., Salamov, A.A., Szeto, E., Dalin, E., Putnam, N.H., Shapiro, H.J., Pangilinan, J.L., Rigoutsos, I., Kyrpides, N.C., Blackall, L.L., McMahon, K.D., Hugenholtz, P., 2006. Metagenomic analysis of two enhanced biological phosphorus removal (EBPR) sludge communities. Nat Biotechnol 24, 1263–1269.
Goreau, T.J., Kaplan, W.A., Wofsy, S.C., Mcelroy, M.B., Valois, F.W., Watson, S.W., 1980. Production of nitrite and nitrous oxide by nitrifying bacteria at reduced concentrations of oxygen. Appl. Environ. Microbiol. 40, 526–532.
Grady, C., Daigger, G., Love, N., Filipe, C., 2011. Biological Wastewater Treatment, CRC Press. ed. IWA Publishing, London, New York.
Hanada, S., Liu, W., Shintani, T., Kamagata, Y., 2002. polyphosphate-accumulating bacterium isolated from activated sludge 883–887.
Hanaki, K., Z. Hong, T. Matsuo, 1992. Production of Nitrous-Oxide Gas During Nitrification of Waste-Water. Water Sci. Technol. 26, 1027–1036.
He, S., Gall, D.L., McMahon, K.D., 2007. “Candidatus accumulibacter” population structure in enhanced biological phosphorus removal sludges as revealed by polyphosphate kinase genes. Appl. Environ. Microbiol. 73, 5865–5874.