Carlos Pestana Barros & Nicolas Peypoch
A Comparative Analysis of Productivity Change in Italian and Portuguese Airports
WP 006/2007/DE _________________________________________________________
Tanya Araújo and Francisco Louçã
Trouble Ahead – The Subprime Crisis as Evidence of a
New Regime in the Stock Market
WP 26/2008/DE/UECE
Department of Economics
W
ORKINGP
APERSISSN Nº0874-4548
School of Economics and Management
TROUBLE AHEAD
- The Subprime Crisis as Evidence of a New
Regime in the Stock Market
Tanya Ara´
ujo
∗and Francisco Lou¸c˜a
ISEG (School of Economics and Management)
Technical University of Lisbon (TULisbon)
Rua do Quelhas, 6 1200-781 Lisboa Portugal
Research Unit on Complexity in Economics (UECE)
†April 22, 2008
In August 2007, the crisis of the subprime mortgage industry stormed the financial systems of several countries. As a response, hundreds of billions of dollars were injected by the authorities into the market. Nevertheless, this was not enough to avoid the second wave of the subprime crisis, as revealed by the fall of the S&P500 stock index since January 2008. In spite of the important achieve-ments obtained in finance theory, the conventional wisdom on the inexistence of structure in the evolution of stock markets still pre-vails. The Efficient Market Hypothesis view ([1],[2]) assesses the evolution of financial markets as the result of a Brownian process. More recently, the contributions of econophysicists ([3],[4],[5]) have challenged the dominance of randomness. Using a stochastic ge-ometry technique, here we show that the dynamics of the S&P500 set of stocks defines a structure, which is specifically shaped by the occurrence of crises. A new coefficient is defined in order to cap-ture the structural changes occurring on the S&P500 set of stocks.
∗corresponding author: tanya@iseg.utl.pt
†Acknowledgement: This research was supported by FCT Portugal, project
This coefficient highlights an important modification of the dynam-ics of the 253 firms represented in the S&P500 and acting in the market for the period August 1988-January 2008, and situates the turbulence since the Summer 2007 as replica of a larger structural change going on for a decade.
In order to identify the structure in the market we proceed as follows.
Define pt as the price of a given stock and the stock price return rt as the
daily change of the logarithm of stock price, rt =ln(pt)−ln(pt−1). Pick the
representative set ofN stocks and their historical data of returns over a time
interval (window). From the returns data, compute the matrix of distances
between the N stocks (as in references [3] and [4]).
dkl=
p
2 (1−Ckl) (1)
being Ckl the correlation coefficient of the returns. From the matrix
of distances, compute coordinates for the stocks in an Euclidean space of
dimension N −1. The stocks are now represented by a set {xi} of points in
RN−1. To this cloud of points apply the standard analysis of reduction of their
coordinates to the center of mass and the computation of the eigenvectors of the inertial tensor. The directions for which the eigenvalues are significantly different from those obtained applying the same technique to surrogate data (as obtained by independent time permutation for each stock) are identified as the market systematic variables. The number of systematic variables define the effective dimensions of the market space (as in [6], [7]).
It was empirically found that markets of different sizes, ranging from 70 to 424 stocks, across different time windows (from one year to 35 years)
and also from different market indexes1 have only six effective dimensions.
These six-dimensional spaces define the reduced subspaces which carry the systematic information related to the correlation structures of the markets. These dimensions capture the structure of the deterministic correlations and economic trends that are driving the market, whereas the remainder of the market space may be considered as being generated by random fluctuations. Moreover, the application of our stochastic geometry technique over time
win-dows of one year (w = 250) shows that the quite ’universal’ six-dimensional
reduction also holds for turbulent and normal periods. Both the years includ-ing the most extreme events and the years where ’business as usual’ prevails fit into a six-dimensional space.
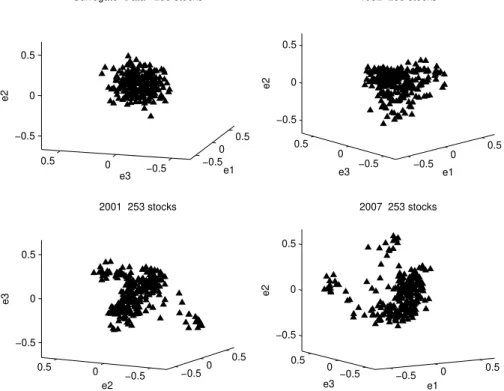
However, observing the evolution of the S&P500 market space along its leading effective dimensions, important differences appeared in the market shape (Fig.1). The most remarkable differences depend on whether the yearly period corresponds to a normal or to a turbulent period. If the yearly pe-riod contains relevant crashes, the geometric object defining the dynamics of the market is distorted, acquiring prominences in some particular directions.
The index S ([7], [8]) computes that distortion effect, namely, the lack of
uniformity along the S&P500 six effective dimensions.
St= Σ6i=1
λt(i)−λ′
t(i)
λ′t(i) = Σ
6
i=1
λt(i)
λ′t(i) −1 (2)
where λt(1), λt(2), ..., λt(6) are the six largest eigenvalues of the market
space and λ′
t(1), λ′t(2), ..., λ′t(6) are the largest six eigenvalues obtained from
surrogate data. In computing S, at a given time t, both λt and λ′t are
obtained over the same time window and for the same set of stocks. Looking for relevant distortions in the shape of the S&P500 market space through the
last 20 years, we found that amongst the highest values of the index S are
those computed for some important dates, as October 1997 and September 2001, as Fig.2 shows.
But if the geometric object defined by the dynamics of the market is distorted whenever a crisis occurs, it may be caused by groups of stock that evolve in strong synchronicity. To characterize this additional information
on the structure of the market spaces, here we define the coefficientR, which
quantifies the distribution of the correlation strengths between stocks present in the S&P500 market space along the last 20 years.
From the matrix of distances between stocks (equation 1) computed in the
reduced six dimensional space (D6) over a time window of 22 days, we apply
the hierarchical clustering process to construct the minimal spanning tree
(MST) that connects theN securities. Then the boolean graphBD6 is defined
by setting b(i, j) = 1 ifd6(i, j)≤L
D6 and b(i, j) = 0 if d6(i, j)> LD6, where
LD6 is the smallest threshold distance valued6(i, j) that insures connectivity
of the whole network in the hierarchical clustering process. This allows for
defining the coefficient R, which captures the relative distribution of the
distance values below and above the smallest threshold distance value (LD6)
that insures connectivity of the whole network.
Rt=
P
d6t(i,j)≤L D6
d6 t(i,j)
P
d6t(i,j)>L D6
d6
Results (Fig.3) show that the amount of strong correlated (short-distant) fluctuations in the network of stocks is very large for some particular crises (1997 second Black Monday, 2003 general recession and 2007-2008 Subprime Crisis). These networks display a large amount of distances whose values are below the endogenous threshold value. This is due to the emergence of a relevant set of highly correlated fluctuations of the stock returns during
mar-ket shocks forcing several weakcorrelated fluctuations to leave this category.
Although the values of the overall network distances decrease with crashes, the emergence of highly correlated groups of stocks occupying the promi-nences in the market distorted shape, leads to an increase of the value of the
endogenous thresholdLD6. As a consequence, the number of distances below
LD6 tend to be much higher than the number of those that remain above the
endogenous threshold, leading to a significant increase of the values of R.
During the Subprime Crisis, R reaches 1.4 (Fig.3), while the same
co-efficient computed for normal periods rests below 0.5 (computing R from
surrogate data yields typical values around 0.025). The evolution ofR
con-firm our previous results, identifying the major crashes in the period and detecting how peculiar it is the Winter 2008 crisis. The Subprime Crisis
constitutes the highest peaks in the evolution ofR for the period under
con-sideration. The results reveal that a major change is occurring for the last decade, imposing a new dynamic structure marked by frequent crashes. As Fig.2 shows, the crashes concentrate in the period after 1997. This difference in the empirically described evolution suggests that in the period of the easy interest rates, the ’Internet boom’ and the housing bubble, a new regime was generated, giving birth to a new phase of turbulence in the financial mar-kets. Distortion effects occurring on the market effective dimensions provide useful insight on the structure of the markets as it is revealed under shocks. Here we show that the characterization of the distribution of the correlation strengths between stocks provides additional informational on the mutation in the structure of the market, suggesting that the prominences emerging in the market shape during crisis correspond to groups of companies that move following sectoral dynamics, in an even stronger synchronization.
References
[1] Samuelson, P. (1995), Proof that properly anticipated prices fluctuate randomly, Industrial Management Review 6.
[2] Fama, E. F. (1998), Market efficiency, long-term returns and behavioral finance, Journal of Financial Economics 49.
[3] Mantegna R.N. (1999), Hierarchical structure in financial markets, Eu-ropean Physics Journal B 11.
[4] Mantegna, R.N., Stanley, H.E. (2000), An Introduction to Econophysics: Correlations and Complexity in Finance, Cambridge, Cambridge Uni-versity Press.
[5] Gopikrishnan P., Rosenow B., Plerou V. and Stanley HE (2001), Quan-tifying and Interpreting Collective Behavior in Financial Markets, Phys. Rev. E 64.
[6] Vilela Mendes R., Ara´ujo T. and Lou¸c˜a F. (2003), Reconstructing an
Economic Space from a Market Metric, Physica A, 323.
[7] Ara´ujo T., Lou¸c˜a, F. (2007), The Geometry of Crashes - A Measure of
the Dynamics of Stock Market Crises, Quantitative Finance, 7(1).
[8] Ara´ujo T., Lou¸c˜a, F. (2008), The Seismography of Crashes in Financial
−0.5 0 0.5 −0.5 0 0.5 −0.5 0 0.5
2001 253 stocks
e2
e3
−0.5 0 0.5
−0.5 0 0.5 −0.5 0 0.5 e1 2007 253 stocks
e3 e2 −0.5 0 0.5 −0.5 0 0.5 −0.5 0 0.5 e1 1992 253 stocks
e3 e2 −0.5 0 0.5 −0.5 0 0.5 −0.5 0 0.5 e1 Surrogate Data 253 stocks
e3
e2
88 89 90 91 92 93 94 95 96 97 98 99 00 01 02 03 04 05 06 07 08 0
2 4 6 8 10 12 14 16 18
253 stocks A new regime after 1997
S
S>5
Figure 2: The evolution of the structure index S - using a moving window
of one month of daily returns (w = 22) - corresponds to the evidence that,
during financial crises, the geometric object describing the stock market is distorted along definite directions.
87 88 89 90 91 92 93 94 95 96 97 98 99 00 01 02 03 04 05 06 07 08 0
0.5 1 1.5
253 stocks From Jan.1988 to Mar.2008
R
R>1
Figure 3: The evolution of the coefficient R (with w = 22) captures the