Nuno Miguel da Rocha Oliveira
Mining Microblogging Data to Model
and Forecast Stock Market Behavior
N uno Miguel da R oc ha Oliv eir a October 2013 UMinho | 2013
Mining Microblogging Dat
a to Model and F or ecas t Stoc k Mar ke t Beha vior
Universidade do Minho
Escola de Engenharia
October 2013
Master Thesis
Master in Information Systems Engineering and Management
Work performed under the guidance of Professor:
Paulo Alexandre Ribeiro Cortez
Nuno Miguel da Rocha Oliveira
Mining Microblogging Data to Model
and Forecast Stock Market Behavior
Universidade do Minho
iii
Acknowledgments
To my supervisor, Paulo Cortez for the invaluable guidance, support, collaboration and motivation.
I wish also to thank Nelson Areal, from the Department of Management and Economics of University of Minho, for his collaboration with this work.
v
Mining Microblogging Data to Model and Forecast Stock
Market Behavior
Abstract
The analysis of microblogging data may disclose relevant signals of investor sentiment and attention that can be useful to model and predict stock market variables (Bollen, Mao, & Zeng, 2011; Mao, Counts, & Bollen, 2011; Oh & Sheng, 2011; Sprenger & Welpe, 2010). Moreover, microblogging data can provide sentiment and attention indicators in a more rapid and cost-effective manner than traditional sources (e.g., large scale surveys).
In this project, we assessed the information content of microblogging data for explaining stock market variables. We created several indicators using Twitter data from nine major technological companies and analyzed their value when modeling returns, trading volume and volatility. Sentiment indicators were produced by exploring 5 popular lexical resources and two novel lexicons (emoticon based and the merge of all 6 lexicons) while attention indicators were based on the posting volume.
Despite the short period analyzed (32 days), interesting results were obtained when measuring the value of using posting volume for fitting trading volume and volatility. However, we found scarce evidence that sentiment indicators can explain stock returns.
vii
Análise de Dados de Microblogs para Modelar e Prever o
Comportamento do Mercado de Ações
Resumo
A análise de dados de microblogging pode revelar sinais relevantes do sentimento e atenção do investidor que podem ser úteis para modelar e prever variáveis do mercado de ações (Bollen et al., 2011; Mao et al., 2011; Oh & Sheng, 2011; Sprenger & Welpe, 2010). Adicionalmente, esta fonte de dados pode fornecer indicadores de sentimento e atenção de uma forma mais rápida e económica que fontes tradicionais (e.g., sondagens).
Neste projecto, avaliamos o conteudo informativo dos dados de microblogging para explicar variáveis de mercados de ações. Criamos vários indicadores utilizando dados do Twitter sobre nove grandes empresas tecnológicas e analisamos o seu valor para modelar rendibilidade, volume de transação e volatilidade. Os indicadores de sentimento foram produzidos utilizando cinco recursos léxicos populares e dois novos lexicons (emoticons e união dos seis lexicons) enquanto que os indicadores de atenção se basearam no número de tweets.
Apesar do curto período de tempo analisado (32 dias), obtivemos resultados interessantes na utilização do número de tweets para modelar o volume de transação e volatilidade. Contudo, encontramos evidência escassa que os indicadores de sentimento podem explicar as rendibilidades das ações.
ix
Table of contents
ACKNOWLEDGMENTS ... III ABSTRACT ... V RESUMO ... VII ACRONYMS/ NOTATION ... XI LIST OF FIGURES ... XIII LIST OF TABLES ...XV 1. INTRODUCTION ... 1 1.1.MOTIVATION ... 1 1.2.OBJECTIVES ... 2 1.3.ORGANIZATION ... 3 2. LITERATURE REVIEW ... 5 2.1.INTRODUCTION ... 5 2.2.BUSINESS INTELLIGENCE ... 5 2.3.DATA MINING (DM) ... 7 2.3.1. Neural Networks (NN) ... 82.3.2. Support Vector Machines (SVM) ... 8
2.3.3. Decision Trees ... 9 2.3.4. Naïve Bayes ... 10 2.4.TEXT MINING (TM) ... 11 2.4.1. Traditional TM Framework ... 12 2.4.1.1. Text Preprocessing ... 12 2.4.1.2. Text Representation ... 12 2.4.1.3. Knowledge Discovery ... 13
2.4.2. Information Extraction (IE) ... 13
2.4.3. Text Classification (TC) ... 14 2.4.4. Information Summarization ... 15 2.4.5. Text Clustering ... 17 2.4.6. TM in Social Media ... 17 2.4.6.1. Time Sensitivity ... 18 2.4.6.2. Short Length ... 19 2.4.6.3. Unstructured Phrases ... 19 2.4.6.4. Abundant Information ... 19 2.4.7. NLP Resources ... 20
2.4.7.1. Part-of-Speech (POS) Tagger ... 20
2.4.7.2. Constituency Parser ... 20
2.4.7.3. Dependency Parser ... 21
2.4.7.4. Shallow Parser ... 21
2.4.7.5. Opinion Lexicon ... 21
2.5.OPINION MINING (OM) ... 22
2.5.1. Opinion Definition ... 23
2.5.2. Document-level Sentiment Classification ... 24
2.5.3. Sentence-level Sentiment Classification ... 24
2.5.4. Aspect-level Sentiment Classification ... 25
x
2.6.UTILIZATION OF MICROBLOGGING DATA TO MODEL AND FORECAST STOCK MARKET VARIABLES ... 26
2.6.1. Investor Sentiment and Attention ... 27
2.6.2. Microblogging data ... 27
2.6.3. Stock Market Variables ... 29
2.6.4. Related work using microblogging data for stock market prediction ... 29
2.6.5. Related work applying other sources of web social data ... 31
2.6.5.1. Internet Searches ... 34
2.6.5.2. Blogs ... 37
2.6.5.3. Message Boards ... 38
2.6.6. Summary ... 40
3. EXPERIMENTS ON MODELING STOCK MARKET BEHAVIOR USING INVESTOR SENTIMENT ANALYSIS AND POSTING VOLUME FROM TWITTER ... 43
3.1.INTRODUCTION ... 43
3.2.MATERIALS AND METHODS ... 44
3.2.1. Twitter Data ... 44
3.2.2. Stock Market Data ... 47
3.2.3. Sentiment Analysis Methods ... 47
3.2.3.1. Pre-processing ... 47
3.2.3.2. Lexical Resources ... 48
3.2.3.3. Sentiment Analysis Approaches ... 49
3.2.4. Regression Models ... 50 3.2.4.1. Returns ... 51 3.2.4.2. Trading Volume ... 51 3.2.4.3. Volatility ... 52 3.2.5. Evaluation ... 52 3.3.RESULTS ... 53 3.3.1. Returns ... 53 3.3.2. Volatility ... 55 3.3.3. Trading Volume... 58 3.4.DISCUSSION ... 62 4. CONCLUSIONS ... 65 4.1.SUMMARY ... 65 4.2.DISCUSSION ... 66 4.3.FUTURE WORK ... 67 REFERENCES ... 69
xi
Acronyms/ Notation
AMZN Amazon
API Application Programming Interface BI Business Intelligence
BOW Bag Of Words DM Data Mining GI General Inquirer GOOG Google
HTML HyperText Markup Language IDF Inverse Document Frequency IE Information Extraction
INTC Intel
MAPE Mean Absolute Percentage Error ML Machine Learning
MPQA Multi-Perspective Question Answering MSFT Microsoft
MSOL Macquarie Semantic Orientation Lexicon NER Named Entity Recognition
NLP Natural Language Processing NN Neural Networks
OL Opinion Lexicon OM Opinion Mining POS Part-of-Speech
RAE Relative Absolute Error RE Relation Extraction
REST Representational State Transfer S&P Standard & Poor's
S1 First Sentiment Analysis Approach S2 Second Sentiment Analysis Approach SVM Support Vector Machine
SWN SentiWordNet TC Text Classification
xii
TF Term Frequency
TF-IDF Term Frequency - Inverse Document Frequency TM Text Mining
WIMS International Conference on Web Intelligence, Mining and Semantics
xiii
List of Figures
FIGURE 1. MAXIMUM MARGIN HYPERPLANE AND SUPPORT VECTORS .... 9
FIGURE 2. LITERATURE MAP ABOUT MINING MICROBLOGGING DATA TO MODEL AND FORECAST STOCK MARKET BEHAVIOR ... 32
FIGURE 3. LITERATURE MAP ABOUT MINING WEB DATA TO MODEL AND FORECAST STOCK MARKET BEHAVIOR ... 35
FIGURE 4. SCHEMATIC OF THE ADOPTED EXPERIMENTATION SETUP ... 45
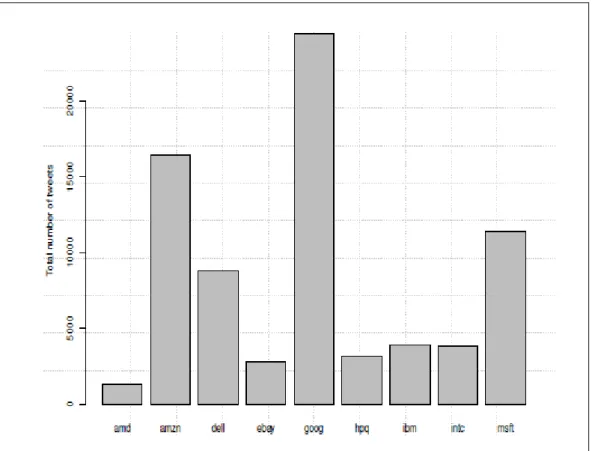
FIGURE 5. TOTAL NUMBER OF TWEETS COLLECTED FOR THE NINE SELECTED TECHNOLOGICAL COMPANIES ... 46
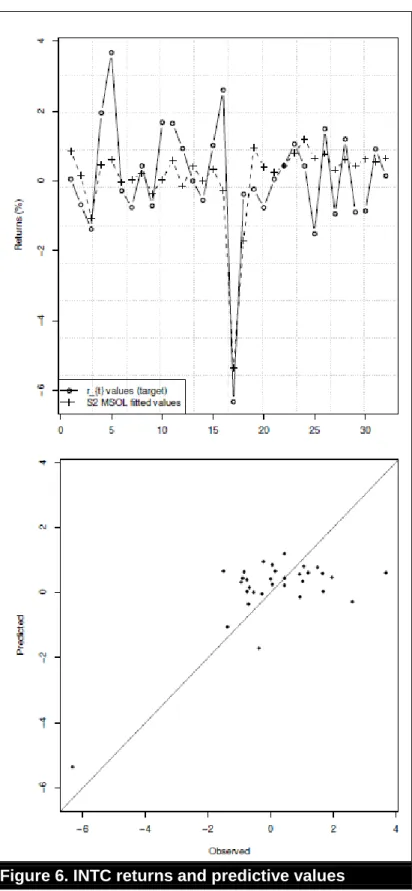
FIGURE 6. INTC RETURNS AND PREDICTIVE VALUES ... 56
FIGURE 7. VOLATILITY AND FITTED VALUES FOR AMZN ... 59
xv
List of Tables
TABLE 1. BI APPLICATIONS ... 6
TABLE 2. INTERNET TRAFFIC REPORT BY ALEXA ON SEPTEMBER 30TH, 2013 ... 18
TABLE 3. RESEARCH ABOUT MINING MICROBLOGGING DATA TO MODEL AND FORECAST STOCK MARKET BEHAVIOR ... 33
TABLE 4. RETURNS USING S1 FEATURES RESULTS ... 54
TABLE 5. RETURNS USING S2 FEATURES RESULTS ... 54
TABLE 6. VOLATILITY RESULTS... 57
TABLE 7. VOLATILITY RAE RESULTS ... 57
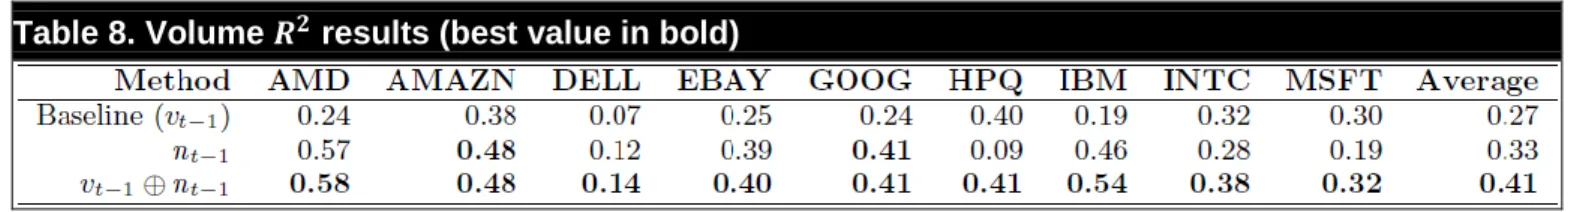
TABLE 8. VOLUME RESULTS ... 60
1
1. Introduction
1.1. Motivation
The analysis and prediction of stock market behavior is a focus of researchers’ attention for a long time. A better prediction of variables related to behavioral aspects of the stock market can lead to valuable benefits, such as the formulation of better strategies for investment portfolios.
The Efficient Market Hypothesis defends that investors act as rational agents and all existing information is reflected immediately in stock prices. However, financial research has shown that financial decisions are significantly driven by emotion and mood (Nofsinger, 2005) and investors’ attention can have an effect on asset prices and dynamics (Hirshleifer & Teoh, 2003; Merton, 1987).
Sentiment and attention indicators created from microblogging data may potentially improve the prediction of stock market variables. The community of users that utilizes these microblogging services to share information about stock market issues has grown and is potentially more representative of all investors. The analysis of its contents can allow the extraction of important signals of sentiment from investors regarding several stock market issues. Moreover, microblogging data is readily available at low cost permitting a faster and less expensive creation of indicators, compared to traditional sources (e.g., large-scale surveys), and can also contain new information that is not present in historical quantitative financial data. Furthermore, the small size of the message (maximum 140 characters) and the usage of cashtags (a hashtag identifier for financial stocks) can make it a less noisy source of data. Finally, users post very frequently, reacting to events in real-time and allowing a real-time assessment that can be exploited during the trading day.
2
Mining microblogging data to model and forecast stock market behavior is a very recent research topic that has presented promising results (Bollen et al., 2011; Fuehres, Zhang, & Gloor, 2011; Mao et al., 2011; Oh & Sheng, 2011; Ruiz, Hristidis, Castillo, Gionis, & Alejandro, 2012; Sprenger & Welpe, 2010). In such literature, it is argued that a model that accounts for investor sentiment and attention can provide a better explanation of stock market behavior and potentially be used to predict key stock market variables, such as returns, volatility and trading volume.
1.2. Objectives
This research topic is very recent and the research results are not consolidated. In this project, we intend to extend this investigation by exploring different sentiment analysis methods and concentrating in a specific sector (i.e. technological sector). The main research objectives are:
Perform a rigorous analysis of the state of the art related with mining microblogging data to model and forecast stock market behavior. This assessment should contribute to verify the relationship between microblogging features and stock market variables and also to identify opportunities to improve results in this research topic.
Evaluate the relevance of a sentiment analysis method, unexplored in this topic, to create indicators of investor sentiment. We will produce sentiment indicators using five popular and large lexical resources and two new proposed lexicons: emoticons; and ALL, which merges the six remaining resources. If this method is more effective, sentiment indicators will have added value to stock market models.
Assess the information content of Twitter data for explaining some stock market variables in the technological sector. Research in this
3
area has studied indexes or stocks from a wide range of sectors. We will consolidate existing research by focusing on individual stocks of a specific sector that has a substantial posting volume. Therefore, Twitter data may be more representative of investors sentiment and attention regarding these stocks and have more informative content for the modeling of stock market behavior.
1.3. Organization
This document is divided into four chapters:
the first introduces the theme, presents the motivation for this project and enumerates the main research objectives;
the second chapter presents the literature review that provided the theoretical support for the implementation of the work plan;
the third chapter describes the whole research project, namely the data and methods applied and the obtained results;
the final chapter summarizes the research project, presents the main conclusions and recommends future work.
5
2. Literature Review
2.1. Introduction
Mining microblogging data to model and forecast stock market behavior requires a diverse set of knowledge and skills from various fields of study. Therefore, it is convenient to perform a thorough study of diverse disciplines. This body of knowledge provides the theoretical background for the execution of the project and permits the identification of research opportunities to improve results.
In this chapter, we provide an overview of diverse fields of study related to this topic and describe the state of the art about mining microblogging data to forecast stock market behavior. We chose to highlight Text Mining and Opinion Mining due to their relevance in this research topic.
2.2. Business Intelligence
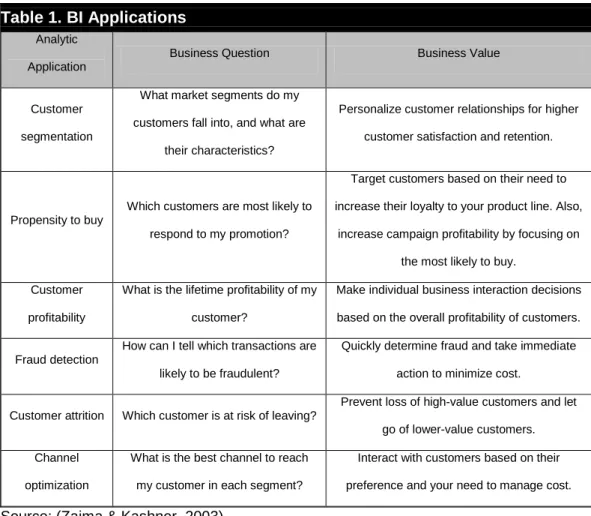
Business intelligence (BI) is an umbrella term that includes architectures, tools, databases, applications, and methodologies. BI major objective is to enable interactive access (sometimes in real time) to data, enable manipulation of these data, and to provide business managers and analysts the ability to conduct appropriate analysis (Turban, Sharda, Aronson, & King, 2007). It seeks to satisfy managers’ need of the right information at the right time, in the right place. The process of BI is based on the transformation of data to information, then to decisions, and finally to actions. Some BI applications are presented in Table 1.
6
Table 1. BI Applications
Analytic Application
Business Question Business Value
Customer segmentation
What market segments do my customers fall into, and what are
their characteristics?
Personalize customer relationships for higher customer satisfaction and retention.
Propensity to buy
Which customers are most likely to respond to my promotion?
Target customers based on their need to increase their loyalty to your product line. Also,
increase campaign profitability by focusing on the most likely to buy.
Customer profitability
What is the lifetime profitability of my customer?
Make individual business interaction decisions based on the overall profitability of customers.
Fraud detection
How can I tell which transactions are likely to be fraudulent?
Quickly determine fraud and take immediate action to minimize cost.
Customer attrition Which customer is at risk of leaving?
Prevent loss of high-value customers and let go of lower-value customers. Channel
optimization
What is the best channel to reach my customer in each segment?
Interact with customers based on their preference and your need to manage cost.
Source: (Zaima & Kashner, 2003)
A BI system may include several components, such as: a Data Warehouse with its source data; business analytics that has a collection of tools for manipulating and analyzing the data in the Data Warehouse, including Data Mining; Business Performance Management for the monitoring and analysis of performance; and a user interface (such as the dashboard) (Turban et al., 2007).
In this review we focus on the analytical component, namely Data Mining and its Text Mining variant, that are applied to mine sentiment and attention indicators from social media data to model and forecast stock market behavior.
7 2.3. Data Mining (DM)
DM is a process that uses database, statistical, mathematical, artificial intelligence, and Machine Learning (ML) techniques to extract and identify useful information and subsequent knowledge from raw data (Fayyad, Piatetsky-shapiro, & Smyth, 1996). It finds mathematical patterns that can be rules, affinities, correlations, trends, or prediction models. DM offers organizations an indispensable decision-enhancing environment to exploit new opportunities by transforming data into a strategic weapon (Turban et al., 2007). Here we present some DM common goals (Fayyad et al., 1996):
Classification: The objective is to assign the correct label to unclassified records using a model trained with a pre-classified data set.
Clustering: It aims to divide a database into segments whose members share similar qualities. Unlike classification, the clusters are unknown when the algorithm starts.
Association: It seeks to establish relationships about items that occur together in a given record. One of the main applications of this technique is the analysis of sales transactions.
Regression: The objective is to map the attributes that characterize an item into a target continuous value. There are linear and nonlinear regression techniques.
Sequence Discovery: The goal is to identify associations over time. Thus, it can contribute to understand behavior over time and have several applications such as marketing or fraud detection.
Visualization: The objective is to enable an easily understandable presentation of data. It converts complex data characteristics on clear patterns to allow users a better visualization of the complicated discoveries made in the process of DM.
8
The most widely used DM techniques in mining microblogging data to forecast stock market behavior are described in the next subsections. 2.3.1. Neural Networks (NN)
NN are inspired in the human nervous system. The model contains a system of interrelated and parallel computational units called neurons, organized in layers, forming a network. Most NN are composed by three types of layers: input, hidden, and output. The value of each neuron is calculated by linearly combining the value from neurons of the preceding layer and by applying an activation function. The activation function is selected considering the nature of the data and the assumed distribution of target variables (Bishop, 2006).
NN have disadvantages as well as advantages. They tend to be most effective where there are a very large number of variables and the relationships between them are complex and imprecise. A NN can easily be implemented in a parallel environment, with each node doing its calculations on a different processor. However, it is usually very difficult to provide a good rationale for the predictions made by a NN. Additionally, NN require more computational resources (e.g. training effort) when compared with simpler modeling techniques. In particular, the time needed for training tends to increase as the volume of the data increases, and in general, NN cannot be trained on very large databases (Turban et al., 2007).
2.3.2. Support Vector Machines (SVM)
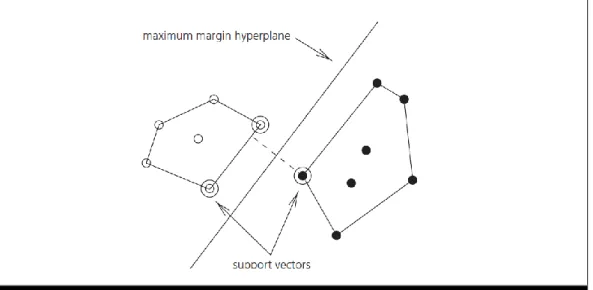
SVM is a popular ML method for tasks such as classification and regression. SVM use a linear model to implement nonlinear class boundaries by mapping input vectors nonlinearly into a high-dimensional feature space (Smola & Schölkopf, 2004). They are based on an algorithm that finds a special kind of linear model: the maximum margin hyperplane. This hyperplane is the one that gives the greatest separation between datasets classes that are linearly separable, permitting a more
9
accurate classification of the training instances. An example is shown in Figure 1.
Figure 1. Maximum margin hyperplane and support vectors
Source: (Witten & Frank, 2005)
Support vectors are the instances that are closest to the maximum margin hyperplane. They permit an easy construction of the mentioned hyperplane. All other training instances become irrelevant (Witten & Frank, 2005).
After training, new examples are mapped to the same space and, depending on which side of the hyperplane they fall, their category is predicted. Several other SVM variants have been proposed, such as Support Vector Regression, which can be applied to regression tasks. 2.3.3. Decision Trees
Decision trees are comprised of an hierarchy of if-then statements and are used in classification and clustering methods (Turban et al., 2007). They can be defined as a root followed by internal nodes, ending in leaf nodes that represent the final class choice for a pattern. Each node is labeled with a question that represents a test on an attribute and each branch represents a response to that question. The questions should be the ones that best divide the training records. A new instance is classified by
10
answering these successive questions and following the corresponding branches. The assigned class corresponds to the leaf node.
Decision trees break down problems into increasingly discrete subsets by working from generalizations to increasingly more specific information. The very general algorithm for building a decision tree is as follows (Turban et al., 2007):
1. Create a root node and select a splitting attribute.
2. Add a branch to the root node for each split candidate value and label.
3. Take the following iterative steps:
a. Classify data by applying the split value.
b. If a stopping point is reached, then create a leaf node and label it. Otherwise, build another subtree.
There are several algorithms for creating decision trees, like ID3, C4.5, C5 from ML, Classification and Regression Trees from statistics, and Chi-squared Automatic Interaction Detector from pattern recognition. Algorithms differ primarily in terms of the choice of splitting attributes, the order of splitting attributes, the number of splits, the tree structure, the stopping criteria, and the pruning of the tree.
2.3.4. Naïve Bayes
A Naïve Bayes classifier is a probabilistic approach based on the Bayes' rule with strong independence assumptions. The Bayes' formula is:
(1)
where is a specific class (e.g., theme) and x is a vector of feature values representing an event (e.g., text document). In short, this rule states that the probability of a event belonging to a particular class depends on the conditional probability of its features occurring in a class (Lewis, N’{e}dellec, & Rouveirol, 1998). Bayes' rule suggests that the
11
estimation of can be achieved by calculating , and .
Bayes classifiers use a set of labeled training instances to calculate Bayes-optimal estimates of the model parameters. Then, new examples are classified with the highest valued class according to the generative model and the Bayes' rule.
Naïve Bayes methods simplify the procedure by assuming that all attributes are independent of each other given the context of the class. Thus, the parameters for each attribute can be learned separately, facilitating the learning process. This assumption is usually false in real-world situations, however Naïve Bayes often obtains very good results (McCallum & Nigam, 1998).
2.4. Text Mining (TM)
TM intends to discover important information from unstructured or less structured text files. The main problem is that the information is not couched in a manner that is amenable to automatic processing. TM strives to bring it out in a form suitable for consumption by computers (Witten & Frank, 2005). It usually involves the process of structuring text and then extract patterns and trends from the structured data. TM is an interdisciplinary field, applying techniques from diverse areas such as Natural Language Processing (NLP), DM, ML or Information Retrieval (Aggarwal & Zhai, 2012a).
The explosion of textual contents created in social networks and web has increased the need for algorithms able to discover interesting knowledge from the data in a dynamic and scalable way (Aggarwal & Zhai, 2012a). TM can support users to quickly analyze information and make better decisions. It is applied in a wide range of domains such as business, security, marketing, research or biomedicine.
12
In the following subsections, we will describe a generic TM framework, some of the most relevant TM applications and common NLP resources. 2.4.1. Traditional TM Framework
TM processes need to perform diverse operations in order to transform text documents from an raw and unstructured format into a structured representation, and, then, to discover useful knowledge. Despite the variety of possible TM processes, an usual framework can be generically characterized by three main phases.
2.4.1.1. Text Preprocessing
This task aims to prepare and facilitate the next TM phases, transforming the input documents without losing important information. Some frequent problems of TM systems, such as the high dimensionality and sparsity of the features, are addressed in this phase (Aggarwal & Zhai, 2012a). Traditional text preprocessing methods are:
Stop word removal: elimination of common words that are considered meaningless (e.g. the, a);
Stemming (Porter, 1980): word replacement by their stem, base or root form. Many words can be represented by the same feature (e.g. the stem of "process", "processing" or "processed" is "process").
The selection of the preprocessing methods depend on the succeeding TM steps. For example, applications that require an appropriate syntactical analysis should discard a stop word removal.
2.4.1.2. Text Representation
The objective of this phase is to identify a set of features that can represent the whole content. These representational models can be constituted by diverse type of features such as characters, words, syntactic tags or concepts (Feldman & Sanger, 2007). A major challenge is to obtain a group of features that can, simultaneously, contain the
13
appropriate semantic information and be computationally efficient for the subsequent knowledge discovery. Various techniques from information extraction and computational linguistics can be adapted and applied in this phase. External knowledge sources such as dictionaries, ontologies or knowledge bases can also be utilized to generate features semantically richer (Feldman & Sanger, 2007).
The most common representation is the "Bag of words" (BOW). This approach transforms text documents into sparse numeric vectors constituted by numerical values representing the frequency of each word in the document (e.g. TF-IDF). It is a simple but limited method that ignores the linguistic structure within the text, preventing more rigorous and meaningful analysis and mining (Feldman & Sanger, 2007).
2.4.1.3. Knowledge Discovery
The final task receives the representational models from the previous phase and seeks to discover important knowledge. TM can rely on diverse existing DM methods to identify relevant patterns, connections and trends in the entire corpus (Aggarwal & Zhai, 2012a; Feldman & Sanger, 2007). These methods may deliver a very large number of results. Thus, an important operation is to limit this overabundance by defining measures of interest. Background knowledge sources such as lexicons or knowledge bases may also be utilized to create meaningful constraints in knowledge discovery operations (Feldman & Sanger, 2007).
2.4.2. Information Extraction (IE)
IE is the task of finding structured information from text such as entities, relations or events (Feldman & Sanger, 2007; J. Jiang, 2012). It is one of the main applications of TM. Many TM algorithms use IE as a starting point because it can disclose significant semantic information and support inferences about knowledge discovered in text (J. Jiang, 2012). Two essential tasks of IE are named entity recognition (NER) and relation extraction (RE).
14
The objective of NER is to identify entities from text and then to classify them into a set of types (J. Jiang, 2012). It has to recognize sequences of words that correspond to real world entities (e.g., "Barack Obama", "Google", "Great Britain") and associate it to specific entity types such as person, organization or location. Other IE tasks, such as RE or event extraction, use NER as a pre-processing step (Feldman & Sanger, 2007; J. Jiang, 2012). Thus, NER is a fundamental task in IE.
RE is the task of finding and categorizing the relations between entities (J. Jiang, 2012). For example, given the sentence "In 1928, Alexander Fleming discovered penicillin.", we can extract the following relations:
DiscovererOf(Alexander Fleming, penicillin), DiscoveredIn(penicillin, 1928 ).
IE has applications in various domains, such as:
Biomedicine: automatically identify and classify mentions of biomedical entities from literature;
Finance: extract detailed information about financial issues (e.g., takeovers) from news articles.
Intelligence: discover important information related to terrorism such as people involved, the weapons used and the targets of the attacks.
2.4.3. Text Classification (TC)
The objective of TC is to classify each data instance (e.g. news, tweets, document) into a set of categories (e.g. subject, topic, sentiment polarity) (Aggarwal & Zhai, 2012b; Feldman & Sanger, 2007). Fully automated systems explicitly assign a label to each instance, whereas semi-automated versions provide a ranking of categories but the final decision is made by the user (Feldman & Sanger, 2007).
There are two main approaches to TC. The first is the knowledge engineering approach that directly encodes expert's knowledge into the
15
system. The second approach applies ML methods to inductively build a classifier from a set of classified data. Despite the first approach outperform ML systems in some domains (e.g. document management), the ML approach is more utilized because is less labor intensive. The knowledge engineering systems require huge amounts of highly skilled labor while ML systems only demand a set of manually classified training instances (Feldman & Sanger, 2007).
Almost all popular classification techniques have been adapted to the case of text data such as decision trees, rules, Bayes methods, nearest neighbor classifiers, SVM classifiers, and NN (Aggarwal & Zhai, 2012b). Feature selection is an essential step for TC. Some features (e.g. words, n-grams) are more correlated to some classes than others. Thus, it is crucial for the classification process to determine the most relevant features for each class. Measures such as Gini Index, Information Gain, Mutual Information, are applied to assess the correlation between terms and categories (Aggarwal & Zhai, 2012b).
TC has a large range of applications, such as:
news organization: automated news categorization in web portals. spam filtering: determine whether each e-mail is spam or not.
sentiment classification: assign a sentiment polarity (e.g., positive, negative, neutral) to a message.
target marketing: classify users (e.g., socioeconomic class, geographical localization) in order to implement appropriate marketing operations (e.g., ads placement).
2.4.4. Information Summarization
A frequent TM function is to provide automatic summaries of documents (Turban et al., 2007). The objective of summarization systems is to create a concise summary of the input documents that delivers the key information (Nenkova & McKeown, 2012).
16
There are two main approaches for text summarization. Extractive methods provide a summary composed by information units extracted from the original text. Abstractive methods apply NLP techniques to produce a summary that may contain words that are not included in the input document.
The majority of summarization systems are extractive. These methods receive a single document or a set of related documents, identify the most important sentences and aggregate them to create a summary. Usually, this process is composed by three main phases: intermediate representation, sentence scoring and summary selection (Nenkova & McKeown, 2012).
The objective of the intermediate representation is to facilitate the next summarization steps. These representations can capture the topics discussed (topic representation) or include a list of indicators (indicator representation) such as sentence length, location in the document, presence of certain phrases.
The sentence scoring phase uses the intermediate representation to assign a score indicating the importance of each sentence. In topic representation approaches, these scores intend to grade the information content that each sentence convey regarding the document topics. In indicator representation approaches, the score consider the evidence from the different indicators. Context information (e.g. document genre, web page links) can also be used to determine the importance of sentences.
Finally, the system has to select the best set of sentences to form a concise and informative summary. The combination of sentences can be selected considering variables such as sentences score or similarity with other chosen sentences in order to maximize summary importance and minimize redundancy.
17
2.4.5. Text Clustering
The objective of Text Clustering is to automatically find groups of similar objects in text data (Aggarwal & Zhai, 2012c). TC applications are provided with a set of pre-classified training examples while Text Clustering is an unsupervised process that has to group an unlabeled data set into meaningful clusters without any prior information (Feldman & Sanger, 2007).
Text data can have diverse representations that require different clustering algorithms. However, the TF-IDF representation is commonly used for text processing. In these representation, the term frequency (TF) for each word is normalized by the inverse document frequency (IDF). This measure reduces the importance of common terms in the collection and increases the influence of more discriminative words.
Text-specific algorithms are necessary to improve the frequent sparse and high dimensional text representation. Many information retrieval techniques can be use for this purpose.
Text clustering can be applied to several tasks, such as:
Document Organization and Browsing: hierarchical organization of documents to facilitate the systematic browsing of the document collection.
Corpus Summarization: creation of a coherent summary of the corpus in the form of cluster-digests (Schütze & Silverstein, 1997) or word-clusters (Baker & McCallum, 1998).
Document Classification: utilization of clustering techniques to improve the classification accuracy of supervised applications. Customer segmentation: group customers with similar features. 2.4.6. TM in Social Media
Social media services (e.g., blogs, microblogs, forums) are an abundant source of opinionated text data. Nowadays, there are 5 social media
18
service among the top 10 sites according to statistics from Alexa1, as shown in Table 2 (social media services are in bold).
TM is a valuable tool to process the large amounts of text data produced by these social media services. It can satisfy more efficiently the information needs for various types of applications (e.g. marketing).
However, social media contents are produced in a quite different context from those produced in traditional media. Their users create contents in an environment of constant interaction and collaboration, differing from the unidirectional paradigm that exists in traditional media.
Thus, it has distinct characteristics that poses new challenges and opportunities. These features are (X. Hu & Liu, 2012):
2.4.6.1. Time Sensitivity
Social media contents are created very frequently. Some users may even post several times during a day (e.g., Facebook, Twitter) reacting to other comments about recent events. Thus, posting time is important to perform a proper contextualized analysis. For example, it is likely that messages written about a football team contain radically different opinions when written immediately after a defeat or a victory. These large number of
1 www.alexa.com
Table 2. Internet Traffic Report by Alexa on September 30th, 2013 Rank Website 1 Google 2 Facebook 3 Youtube 4 Yahoo! 5 Baidu 6 Wikipedia 7 QQ.com 8 LinkedIn 9 Windows Live 10 Twitter
19
time postings hold important information that can be explored for detection and monitoring of events.
2.4.6.2. Short Length
Some social media services restrict the message length (e.g. Twitter). The conciseness has advantages but also some challenges. These contents require a greater objectivity from the author and its succinctness permits more effective textual analysis than in longer standard documents. However, these messages may not provide sufficient context information. 2.4.6.3. Unstructured Phrases
Many social media messages have much less quality than traditional media contents. Users are less rigorous in the creation of text messages, producing several grammatical errors such as orthographical mistakes or incorrect punctuation. Abbreviations and acronyms are employed frequently. Some social media services (e.g., Twitter) have also specific terminology (e.g., hashtags) and structure (e.g., retweets).
These facts reduce the performance of standard NLP resources (e.g. POS and dependency taggers) and, consequently, hamper the accurate identification of the semantic meaning of these messages.
2.4.6.4. Abundant Information
In addition to the text content, social media usually contain a rich variety of information sources. These services permit to associate keywords to each message (i.e. tag information), to include connections to other users or contents (i.e. link information) and may contain other types of information such as geographical location or an author profile.
TM can extract useful information from these external sources. The analysis of the text content can be complemented by semantic clues derived from tags, links, etc. However, the abundant additional information introduces even more difficulty to an effective text collection and processing.
20
2.4.7. NLP Resources
NLP is a research area that develops tools and techniques that allow computers to understand, manipulate and generate natural language text in order to perform useful tasks (Jurafsky & Martin, 2000). TM algorithms constantly apply NLP resources to extract a more complete meaning representation from text. Some of most frequently applied NLP resources are described next.
2.4.7.1. Part-of-Speech (POS) Tagger
POS are linguistic categories assigned to words based on the role they play in the sentence. For example, in the sentence "Peter is fast", the POS tags could be proper noun ("Peter"), verb ("is") and adjective ("fast"). These tags provide semantic information about each word that can be useful to other TM tasks (e.g., entities are frequently nouns, opinion words are regularly adjectives).
The most common tag set is composed by seven tags: Article, Noun, Verb, Adjective, Preposition, Number, and Proper Noun. However, some POS taggers contain a much longer group of tags (e.g., Stanford POS Parser (Toutanova, Klein, Manning, & Singer, 2003) has 48 tags).
POS taggers already present excellent results in formal text documents. The state of the art Stanford POS Tagger achieves an 97.24% accuracy on the Penn Treebank WSJ corpus (Toutanova et al., 2003). However, the accuracy may drop substantially when processing more informal text documents such as those produced in social media services.
2.4.7.2. Constituency Parser
Constituency parsers perform a full syntactical analysis of sentences according to a constituency grammar. This resource identifies sequences of syntactically grouped elements (i.e. constituents) such as noun phrases, verb phrases, prepositional phrases, adjective phrases, and clauses (Feldman & Sanger, 2007). Each sentence can contain several constituents and each constituent can be composed by many words or
21
other phrases. Grammatical functions are also assigned to each phrase (e.g., a noun phrase may be classified as subject, object or complement). 2.4.7.3. Dependency Parser
Another type of full syntactical parsing is the dependency parsing. These parsers identify direct binary asymmetric grammatical relations (i.e. dependencies) between one word (dependent) and another word (head). The head dominates the relation, being more influential in defining the behavior of the pair. The dependent is usually the modifier, object, or complement of the head. For example, in the sentence "John writes articles", there are two dependencies: subject ("John" is the subject of the verb "writes") and object ("articles" is the object of the verb "writes"). Dependency relations are semantically richer than constituency classifications because they usually contain more grammatical roles and they already identify the head and the dependent (Covington, 2001). 2.4.7.4. Shallow Parser
Shallow parsers execute a faster but less deep analysis than full syntactical parsers. They only identify sentence components (e.g. phrases and dependencies) that are clear and unambiguous, leaving the other ones unresolved. Shallow parsers are effective for many TM applications because their level of analysis is sufficient, the results are robust and the computational effort is much smaller (Feldman & Sanger, 2007).
2.4.7.5. Opinion Lexicon
An opinion lexicon is an important resource that is employed in many sentiment classification tasks. It is composed by opinion words and phrases and the respective sentiment label (e.g. positive, negative). Their presence in the text permits to discern the sentiment orientation. For example, the sentence "The computer is good" can be easily classified as positive if the opinion lexicon contains the word "good" as positive.
There is a set of existing opinion lexicons (Baccianella, Esuli, & Sebastiani, 2010; Stone, Dunphy, Smith, & Ogilvie, 1966; Wilson, Wiebe,
22
& Hoffmann, 2009) that can be applied for sentiment classification. However, these resources may not be appropriated for specific domain and context classification. For example, the word "long" can have many sentiment orientations (e.g. "long battery life", "long debt list", "long Google stocks").
A possible solution is the creation of an opinion lexicon. However, it can be very laborious or even impracticable to construct a comprehensive set of domain opinion words and to determine their orientations.
2.5. Opinion Mining (OM)
OM is the computational treatment of opinion, sentiment and subjectivity in text. This field of study is also frequently defined as "Sentiment Analysis" (Pang & Lee, 2008). OM systems aims to extract "people’s opinions, appraisals, attitudes, and emotions toward entities, individuals, issues, events, topics and their attributes" (Liu & Zhang, 2012).
Knowing people's opinion has always been an important piece of information for decision-making processes (Pang & Lee, 2008). For example, companies always want to know consumer opinions about their products to be able to improve them and to perform adequate marketing actions. Potential customers may also want to find the opinions of actual customers before they purchase a product.
Social Media platforms (e.g., reviews, forums, blogs and social networks) have enabled an explosion of contents containing opinions regarding several topics. The huge amount of opinionated text in these platforms is a valuable source of opinions of a representative community of users, very useful for organizations and individuals. The extraction of these opinions is extremely difficult for humans. The identification and summarization of important information in large quantities of data is very challenging for the average reader (Liu & Zhang, 2012). These limitations can be overcome by OM systems that mine large amounts of opinionated
23
contents and automatically extract and summarize the opinions about a topic. These systems have widespread applications, such as:
Businesses: useful for reputation management, sales prediction, stock management, ads placements, products and services benchmarking.
Individuals: may support decisions about product purchases,
Politics: permits to understand what voters are thinking about several political issues such as politicians or political proposals. In the following subsections, we present an opinion definition that supports OM systems and describe the most common OM tasks.
2.5.1. Opinion Definition
Opinions can be expressed using subjective or objective sentences (Pang & Lee, 2008). Subjective sentences contain some emotional expressions (e.g. "I love that phone"), while objective sentences may present facts denoting opinions (e.g. "The voice of this phone is clear"). Both sentence types can be used to OM.
An opinion may have several characteristics. However, there are five features that provide the necessary information for most of the subsequent analysis. These characteristics are (Liu & Zhang, 2012):
Entity: Target object that has been evaluated (e.g. product, service, person, event, organization, topic).
Aspect: The entity attribute that has been measured.
Orientation: The opinion orientation about the aspect of the entity. It can have diverse categories (e.g. positive, negative or neutral) or be expressed with different strength/intensity levels.
Opinion Holder: The entity that has expressed the opinion. Time: The time when the opinion was expressed.
For example, in the sentence "The new iPad's processor is fast.", the opinion can be expressed by the quintuple (Entity: iPad, Aspect:
24
processor, Orientation: positive, Opinion Holder: review author, Time: time of the review). The extraction of these features enables the transformation from unstructured text to structured data and permit a more complete and effective knowledge discovery phase.
We can also have opinions comparing two or more entities. It can indicate a preference of the opinion holder and express differences or resemblances between these entities.
2.5.2. Document-level Sentiment Classification
This task considers the whole document as the information unit and attributes it a sentiment value (e.g. positive, negative, neutral, rating score). Document-level classification assumes that the document expresses opinions on a single entity from a single opinion holder. It is not appropriated to evaluate and compare diverse entities neither to identify the sentiment regarding multiple entities and aspects mentioned in the document (Liu & Zhang, 2012).
Customer reviews are suited to this type of classification because they are generally written by a single author and are about a single item. However, in many social media contents (e.g. forum, blog), the author may express opinions on multiple entities. reducing the validity of this methodology. Most existing techniques for document-level sentiment classification are based on supervised learning. These sentiment classifiers are created from classified data using supervised learning methods (e.g. SVM) in order to attribute the correct sentiment class (e.g. positive, negative, neutral). Product reviews provide an useful and common data source for supervised learning because each review usually has a rating assigned by its own author.
2.5.3. Sentence-level Sentiment Classification
Sentence-level sentiment classification is the task of assigning a sentiment class to individual sentences. Document-level sentiment
25
classification is too coarse for most applications. Thus, the sentence level classification may provide a more adequate analysis because it gives the sentiment of a larger number of information units. However, it is still not adequate for complex sentences that include opinions on multiple aspects. Sentence level is appropriate for simple sentences that contain a single opinion because it does not allow to classify more than one element of the sentence (Liu & Zhang, 2012). Many sentiment classification techniques applied in document-level can also be used in this task.
2.5.4. Aspect-level Sentiment Classification
In many situations, the document level and sentence level classification do not supply the necessary detail. A positive document or sentence does not mean that the author has positive opinions on all mentioned entities or aspects. This detailed information could be extremely valuable for decision-making.
Aspect-based sentiment analysis aims to assign the sentiment orientation of all aspects and entities. Unlike the other levels, the aspect level classification is able to discover all five items that characterize each opinion: entity, aspect, opinion orientation, opinion holder and time (Liu & Zhang, 2012). It is a more complex task that requires deeper NLP capabilities to create a richer set of results. Many techniques applied in IE (Freitag & McCallum, 2000; Jakob, 2010; Jin & Ho, 2009; Lafferty, McCallum, & Pereira, 2001), topic modeling (Brody, 2010; Lin & He, 2009; Titov & McDonald, 2008) or clustering (Su et al., 2008) can be used in the extraction of these elements.
2.5.5. Mining Comparative Opinions
Comparing two or more entities is an usual form of sentiment evaluation. These comparative opinions are different from regular opinions, because they involve more entities and have other semantic meanings and syntactic forms. The set of five features that describe regular opinions is insufficient to characterize comparative opinions. These opinions should
26
be defined by six features: entity 1, entity 2, shared aspects, preferred entity, opinion holder and time (Liu & Zhang, 2012). Thus, the OM process for comparative opinion is different from the process applied to mine regular opinions.
Comparative sentences may have different structures. There are four main comparisons types:
1. Non-equal gradable comparisons (e.g. “X is faster than Y”).
2. Equative comparisons (e.g. “the performance of X is identical to Y.”).
3. Superlative comparisons (e.g. “X is the fastest”).
4. Non-gradable comparisons, comparing but not grading aspects of two or more entities (e.g. "X tastes differently from Y.").
OM should be able to identify the type of the comparative sentence, to extract the comparative relations accordingly and to determine the preferred entity set (Ganapathibhotla & Liu, 2008; Jindal & Liu, 2006). The tasks of extracting entities, aspects, opinion holders and times may be similar to those executed for mining regular opinions. However, mining comparative opinions has a distinct task. It should identify the preferred group of entities among the various entities referred in the sentence.
2.6. Utilization of Microblogging Data to Model and Forecast Stock Market Variables
In this section, we describe the main concepts and research work about mining microblogging data to model and forecast stock market behavior. We included an additional subsection reporting the state of the art about the utilization of similar web data sources. The final subsection summarize the research results and identifies research opportunities.
27
2.6.1. Investor Sentiment and Attention
Despite, the Efficient Market Hypothesis defend that investors act as rational agents and all existing information is reflected immediately in stock prices, financial research has shown that individual investors systematically deviate from optimal trading behavior (Barber & Odean, 2008; Daniel, Hirshleifer, & Teoh, 2002) and financial decisions are significantly driven by emotion and mood (Nofsinger, 2005). Thus, investor attention and sentiment can be influential in financial decision-making and their measures can be used to identify and exploit stock mispricing.
Investor attention is a limited resource that can have an effect on asset prices and dynamics (Hirshleifer & Teoh, 2003; Merton, 1987). If decision making processes are affected by emotions (Peterson, 2007) one can argue also that investor collective sentiment can also play a role on their investment decisions and, consequently, influence stock market returns and their dynamics.
Microblogging data can be a valuable source to predict these indicators. Investors are increasingly using microblogging services (e.g. Twitter) to express their opinion and share useful information regarding several financial issues. The analysis of these contents can allow the extraction of important signals of sentiment from investors that can contain important information about stock market behavior.
2.6.2. Microblogging data
The most popular microblogging service is Twitter (www.twitter.com). Nevertheless, there is a more specific microblogging platform exclusively dedicated to stock market. StockTwits (www.stocktwits.com) has started in October 2008 and already has more than 200,000 users that share information about the market and individual stocks. Similarly to Twitter, messages are limited to 140 characters and consist of ideas, links, charts and other data.
28
Microblogging data has distinguishing characteristics that may benefit the creation of sentiment indicators, such as:
The character constraints require greater objectivity from the author and permits a more accurate linguistic analysis.
The usage of cashtags (a hashtag identifier for financial stocks) can make it a less noisy source of data.
Users post very frequently, reacting to events in real-time. This regularity allows a real-time sentiment assessment that can be exploited during the trading day.
However, these contents present some challenges to an adequate sentiment analysis. The short length of messages can generate a lack of contextual information while the informal writing style usually produces many grammatical errors, reducing the performance of NLP resources. Regarding investor attention, the number of tweets related to a stock can constitute a more precise measurement than traditional sources. Investor attention has been analyzed by the supply side of news, assuming that supply of news is positively correlated with investor attention. Nevertheless, this is not only an imperfect measure of attention but also a limited one, since news availability does not correlate directly with investors' attention to these news. However, when a tweet contains a reference to a stock ticker, it surely indicates that its author is paying attention to that stock.
Microblogging data is usually abundant and readily available at low cost. Thus, the creation of these new indicators may be more rapid, accurate and cost effective than traditional forms (e.g. large-scale surveys). They also might constitute good substitutes for traditional sources, which is particularly relevant where they are not available. In these cases, the proposed indicators can be proxies for such measures.
29
2.6.3. Stock Market Variables
Stock market variables measure diverse important aspects related to stock market and are influential in investment decisions. The most studied stock market variables in this research topic are:
Returns: Market returns measure changes in the asset value. A common formula to calculate returns is:
1
/ 1 t t t
t P P P
r (2) where Pt is the adjusted close price of day t and Pt1 is the adjusted close
price of the preceding day. Adjusted close price is the official closing price adjusted for capital actions and dividends. Returns provide useful information about the probability distribution of asset prices. This is essential for investors and portfolio managers as they use this information to value assets and manage their risk exposure.
Volatility: Volatility is a latent measure of total risk associated with a given investment. Volatility can be estimated using different approaches. Estimates of volatility are essential for portfolio selection, financial assets valuation and risk management.
Trading volume: Trading volume is the number of shares traded in each day during a trading session. Volume can be used to measure stock liquidity, which in turn has been shown to be useful in asset pricing as several theoretical and empirical studies have identified a liquidity premium. Liquidity can help to explain the cross-section of expected returns (Amihud, Mendelson, & Pedersen, 2005).
2.6.4. Related work using microblogging data for stock market prediction
Microblogging data has motivated some studies about its relationship with stock market variables. Sentiment indicators extracted from microblogging data had predictive value for future stock price directions (Bollen et al., 2011; Oh & Sheng, 2011) and returns (Mao et al., 2011; Sprenger &
30
Welpe, 2010) and were correlated with volatility (Fuehres et al., 2011). Trading volume were also correlated with the number of tweets (Sprenger & Welpe, 2010).
Bollen et al. (Bollen et al., 2011) measured collective mood states (e.g. "positive", "negative", "calm") through sentiment analysis applied to large scale Twitter data, although tweets were related with generic sentiment (e.g. "I'm feeling") and not directly related to stock market. These messages were classified using two different lexicons: the MPQA Subjectivity Lexicon (MPQA) (Wilson et al., 2009) and GPOMS, a created lexicon based on an existing psychometric instrument. Applying a Self-organizing Fuzzy NN, they found an accuracy of 86.7% in the prediction of the Dow Jones Industrial Average daily directions and a substantial reduction in the Mean Average Percentage Error (MAPE).
Sprenger and Welpe (Sprenger & Welpe, 2010) have used sentiment analysis on stock related tweets collected during a 6-month period. To reduce noise, they selected Twitter messages containing cashtags of S&P 100 companies. Each message was classified by a Naïve Bayesian method trained with a set of 2,500 tweets. Results showed that sentiment indicators are associated with abnormal returns and message volume is correlated with trading volume.
Mao et al. (Mao et al., 2011) surveyed a variety of web data sources (Twitter, news headlines and Google search queries) and tested two sentiment analysis methods to predict stock market behavior. They used a random sample of all public tweets and defined a tweet as bullish or bearish only if it contained the terms "bullish" or "bearish". They showed that their Twitter sentiment indicator and the frequency of occurrence of financial terms on Twitter are statistically significant predictors of daily market returns.
Oh and Sheng (Oh & Sheng, 2011) resorted to a microblogging service exclusively dedicated to stock market. They collected 72,221 micro blog postings from StockTwits about 1,909 stocks from NASDAQ and NYSE,
31
over a period of three months. The sentiment of the messages was classified by a BOW approach that applies a J48 classifier to produce a learning model. They verified that the extracted sentiment appears to have strong predictive value for future stock price directions.
Ruiz et al. (Ruiz et al., 2012) verified whether microblogging features are correlated with stock prices and trading volume. They collected Twitter data about for 150 companies of the S&P 500 index for the first half of 2010. The used microblogging features are related to its activity (e.g., number of posts, number of re-posts) or measure properties of an induced interaction graph (e.g., number of connected components, statistics on the degree distribution). Results show that trading volume is correlated with some graph-based features but the stock price is not strongly correlated with any of the microblogging features. Nevertheless, they created a simulator of investments applying a Twitter-Augmented Regression model that outperformed other baseline strategies.
Fuehres et al. (2011) (Fuehres et al., 2011) analyzed six months of random twitter feeds and created daily mood indicators by counting all tweets containing some key words (e.g., "fear", "worry", "hope"). They found that these emotional indicators are significantly negatively correlated with Dow Jones, NASDAQ and S&P 500, but are positively correlated with VIX.
Figure 2 illustrate the research results and Table 3 summarize these studies.
2.6.5. Related work applying other sources of web social data
Various sources of web social data have been used to model and predict stock market variables. Social media services, such as blogs and message boards, have similar characteristics to microblogs. For instance, they are an abundant source of opinionated text contents created in an interactive environment and using an informal writing style. The number of microblogging messages is also comparable to internet searches.
32 Figure 2. Literature Map About Mining Microblogging Data to Model and Forecast Stock Market Behavior
33 Table 3. Research about Mining Microblogging Data to Model and Forecast Stock Market Behavior
Paper Microblogging data collected
Sentiment Analysis Method
Analysis of the relationship of microblogging data and stock market variables Microblogging
features
Stock Market
variables Methods
Test
Period Evaluation Results
Sprenger and Welpe (2010)
Twitter data containing cashtags of S&P 100 companies, from January 1 to June 30, 2010.
Naïve Bayesian method trained with 2,500 tweets to classify messages as "buy","hold" or "sell" Bullishness index, message volume, disagreement index Abnormal returns, trading volume and volatility Pairwise correlations, contemporaneous regressions and time-sequencing regressions _ Correlation coefficients, regression coefficients, R2 and F-value Bullishness index is correlated with abnormal returns; message volume is correlated with trading volume
Bollen et al. (2011)
Twitter data containing specific sentiment expressions, from February 28 to December 19, 2008.
Messages classified using two lexicons: MPQA and GPOMS
6 mood indicators (Calm, Alert, Sure, Vital, Kind, Happy) and a generic sentiment indicator
DJIA prices and price movements Granger Causality Analysis, Self-organizing Fuzzy NN From December 1 to December 19, 2008 MAPE and direction accuracy 86.7% accuracy in predicting DJIA directions; less 15% MAPE than baseline method
Mao et al. (2011)
Random sample of Twitter data, from July 2010 to September 2011.
Tweets classified as bullish or bearish if contains the terms "bullish" or "bearish"; Tweet volumes of financial terms Twitter Investor Sentiment; Tweet Volumes of Financial Search Terms DJIA price, returns, trading volumes, market volatility (VIX) Correlation Analysis, Granger Causality Analysis, Multiple Regression Analysis From August 31 to September 29, 2011 , MAPE and direction accuracy
Twitter sentiment and Tweet volumes of financial terms are statistically significant predictors of daily market returns. Oh and Sheng (2011) StockTwits data containing tickers of 1,909 stocks (NASDAQ and NYSE), from May 11 to August 8, 2010.
J48 classifier trained with 7109 messages that labels messages as "Bullish", "Bearish" ou "Neutral" Bullishness Index; posting volume; author information Stock price directions Multiple Regression Analysis From August 1 to August 8, 2010 Direction accuracy Bullishness index appears to have strong predictive value for future stock price directions Fuehres et
al. (2011)
Random sample of Twitter data, from March 30 to September 7, 2009.
Daily mood indicators created by counting all tweets containing some key words (e.g., fear, worry, hope)
Mood indicators Index values of Dow Jones, NASDAQ, S&P 500, VIX
Correlations _ Correlation
coefficients
Mood indicators are significantly negatively correlated with Dow Jones, NASDAQ and S&P 500, but are positively correlated with VIX
Ruiz et al. (2012)
Twitter data containing expressions related to 150 companies in the S&P 500 index, during the first half of 2010.
_ Activity features;
Graph-based features
Stock prices and trading volume
Correlations _ Correlation
coefficients
Trading volume is correlated with some graph-based features