Maria de Fátima Carvalho Parafita
Evaluating balance, stability and gait
symmetry of stroke patients using
kinematic and dynamic gait lab data.
Maria de Fátima Carvalho Parafita
outubro de 2015
UMinho | 2015
Ev
aluating balance, s
tability and gait symme
tr
y of
str
ok
e patients using kinematic and dynamic gait lab dat
a.
Universidade do Minho
outubro de 2015
Dissertação de Mestrado
Ciclo de Estudos Integrados Conducentes ao
Grau de Mestre em Engenharia Biomédica
Trabalho efectuado sob a orientação do
Professor Doutor João Paulo Flores Fernandes
Maria de Fátima Carvalho Parafita
Evaluating balance, stability and gait
symmetry of stroke patients using
kinematic and dynamic gait lab data.
Universidade do Minho
II
Acknowledgments
First, I would like to give my special thanks to Professor Paulo Flores, for accepting to supervise my project and for his valuable advices that were essential to complete this work.
I am deeply grateful to the whole team of the Department for the Mechanics and Robotics from the Duisburg-Essen University, especially to Professor Andrés Kecskeméthy who was kind to receive me in his research group.
A very special and sincere thanks to Philippe Ferreira for all the time and patience in listening and clarifying my doubts. Without him this work wouldn't have been possible.
To all my friends and to my colleagues from the Biomedical Engineering course, that over the last years have shared many experiences and stories with me, a hearty thanks.
Finally and most importantly, to my family, particularly my parents and my brother, for the support and encouragement that they gave me throughout these last five years of education and personal development.
IV
Title
Evaluating Balance, Stability and Gait Symmetry of Stroke Patients using Kinematic and Dynamic Gait Lab Data
Abstract
Stroke is the most common brain disorder and in United States of America, every 40 seconds, someone has a stroke. One of the major consequence of stroke is the loss of the walking function. The gait of post-stroke individual is inefficient and is characterized by asymmetry, instability and loss of balance.
In the present work, gait kinematic and dynamic features were extracted using Matlab and symmetry indexes were computed for healthy subjects and stroke patients. Spearman's and Pearson's Correlations were applied to understand the relations between the data extracted and computed, the conventional clinical scales to assess the degree of impairment of stroke patients and the ReHabX Score.
The results obtained show that stroke patients tend to spare the affected limb and the joints' angles of the affected limb are entirely different from the non-affected. With the increase of the degree of a patient's impairment the spatio-temporal gait features tend to behave in contrast to what is considered a normal behavior and the symmetry indexes values diverge more from the value that indicates perfect symmetry. The best symmetry indexes to calculate the degree of symmetry are the Ratio I and the Limp Index and the best gait features to use in the calculation of the Ratio I index are the swing and stance times and the SW/ST. The gait features of the non-affected limb correlate better with the other gait features, the symmetry indexes, the conventional clinical scales and the ReHabX Score.
Furthermore, it was concluded that symmetry, balance and stability are gait parameters closely related and the ReHabX Score is a more suitable medical method to evaluate balance, stability and gait symmetry.
VI
Título
Avaliação do balanço, da estabilidade e da simetria da marcha de pacientes que sofreram um acidente vascular cerebral usando dados cinemáticos e dinâmicos do laboratório de marcha humana.
Resumo
O Acidente Vascular Cerebral (AVC) é a doença cerebral mais comum, sendo que a cada 40 segundos alguém, nos Estados Unidos da América, têm um AVC. Uma das principais consequências do AVC é a perda da função de caminhar. O caminhar de um indivíduo que sofreu um AVC é ineficiente, caracterizado por assimetria, instabilidade e perda de equilíbrio.
No presente trabalho, as caraterísticas cinemáticas e dinâmicas da marcha de indivíduos saudáveis e de indivíduos que sofreram um AVC foram extraídas recorrendo ao software Matlab e os índices de simetria foram calculados. As correlações de Spearman e Pearson foram aplicadas para entender as relações entre os dados extraídos e calculados, as escalas clínicas usadas para avaliar o grau de incapacidade dos pacientes e o ReHabX Score.
Os resultados obtidos mostram que os pacientes que sofreram um AVC tendem a poupar o membro afetado e os movimentos das articulações do membro afetado são bastante diferentes do não-afetado. Com o aumento do grau de incapacidade dos pacientes as características espácio-temporais da marcha tendem a comportar-se em contraste com o que é considerado um comportamento normal e os valores dos índices de simetria divergem mais do valor que indica uma perfeita simetria. Os melhores índices de simetria para calcular o grau de simetria são o Ratio I e o Limp Index e as melhores características da marcha para usar no cálculo do Ratio I são o swing time, o stance time e o SW/ST. As características da marcha do membro não-afetado correlacionam-se melhor com as outras características da marcha, os índices de simetria, as escalas clínicas convencionais e com o ReHabX Score.
Além disso, concluiu-se que a simetria, equilíbrio e estabilidade são parâmetros da marcha intimamente relacionados e o ReHabX Score é o método médico mais adequado para avaliar a estabilidade, o equilíbrio e a simetria da marcha.
VIII
Table of Contents
Acknowledgments ... II Abstract ... IV Resumo ... VI Table of Contents ... VIII Abbreviations and Acronyms ... XII List of Figures ... XIV List of Tables ... XXIV
Chapter 1: Introduction ... 1
1.1 Motivation... 2
1.2 Scope and Objectives... 3
1.3 Literature Review ... 4
1.4 Contributions of this dissertation ... 5
Chapter 2: Human Gait Fundamentals ... 7
2.1 Human Gait Description ... 8
2.2. Impact of Stroke on Human Gait ... 11
2.3 Balance, Stability and Symmetry ... 13
2.3.1 Balance ... 13
2.3.2 Stability ... 17
2.3.3 Symmetry ... 24
2.4 Clinical Methods to Evaluate the Degree of Impairment ... 27
2.5 ReHabX Score ... 30
Chapter 3: Methodologies for the Gait Features Extraction and Analysis ... 33
IX
3.2.2 Extraction of the Features ... 40
3.3 Computing Symmetry Indexes ... 42
3.4 Approach Developed and Correlation Methodologies ... 44
Chapter 4: Results and Discussion ... 47
4.1 General Gait Analysis ... 48
4.1.1 Spatio-temporal Features ... 48
4.1.2 Joints' Angles ... 58
4.2 Symmetry Indexes ... 63
4.3 Correlation Analysis ... 68
Chapter 5: Conclusions and Future Developments ... 99
5.1 Conclusions ... 100
5.2 Future Developments ... 102
Chapter 6: References ... 103
Appendix I: ReHabX Score ... 113
Appendix II: Extraction of the Gait Features in MATLAB ... 117
Appendix II.A - C3DextractorPart1 ... 118
Appendix II.B - C3DextractorPart2_GaitFeatures ... 119
Appendix II.C - Extract_Features ... 122
Appendix II.D - Script Gait Features ... 128
Appendix II.E - C3DextractorPart2_GRF ... 140
Appendix II.F - Extract_GRF ... 142
Appendix II.G - Script GRF ... 143
X Appendix III: Pearson's Correlation Coefficients ... 147 Appendix III.A - Barefoot Trials Results ... 148 Appendix III.B - Wearing Shoes Trials Results ... 157
XII
Abbreviations and Acronyms
3D Three Dimensional
A Affected
ADL Activities of Daily Living
AP Anterior-posterior
b Margin of Stability
BBS Berg Balance Scale
BI Barthel Index
BoS Base of Support
b Temporal Stability Margin
CoM Centre of Mass
CoP Centre of Pressure
CV Coefficient of Variation
CVA Cerebrovascular Accident
EMG Electromyography
FIM Functional Independent Measure
FM Floquet Multipliers
FS Foot Strike
GA Gait Asymmetry
GF Gait Feature Matrix
GRF Ground Reaction Force
HR Harmonic Ratio
ITBB Institut für Technologien der Biomechanik und Biomaterialien
kg Kilogram
m Meter
ML Medio-lateral
mRS Modified Rankin Scale
MSE Multiscale Entropy
XIII
PCA Principal Component Analysis
RQA Recurrence Quantification Analysis
s Second
SD Standard Deviation
SI Symmetry Index
SW/ST Intra-limb ratio of swing: stance time
TO Toe Off
TUG Time Up & Go
V Vertical
XCoM Extrapolated Centre of Mass
Maximum Lyapunov Exponent
Long Term Lyapunov Exponent
XIV
List of Figures
Chapter 2
Figure 1 - Illustration of the major events and phases of the gait cycle by the right leg (gray) (Whittle, 2007). ... 9 Figure 2 - Timing of single and double support during both legs gait cycle, starting with the right leg (Whittle, 2007). ... 11 Figure 3 - Outline of the 10m Walk Test adapted from Dalgas, Severinsen, and Overgaard (2012). ... 30
Chapter 3
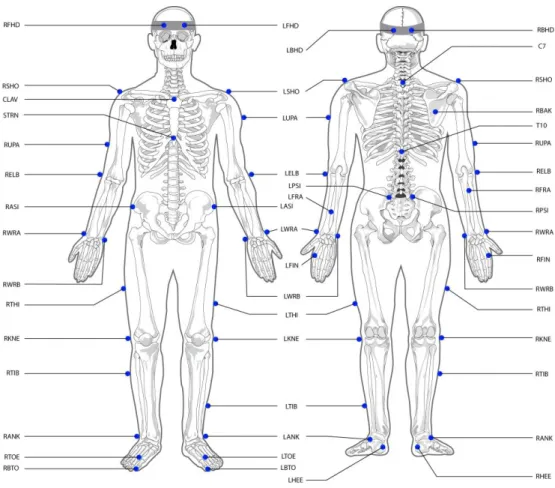
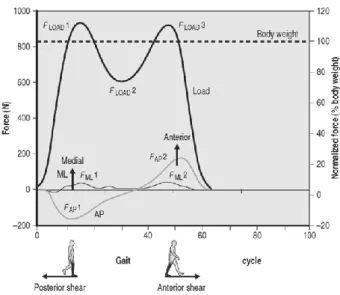
Figure 4 - Markers' position on the body. ... 35 Figure 5 - Distance features provided by a person's footprints (Whittle, 2007). ... 36 Figure 6 - Centre of Mass displacements for a healthy subject during gait (Kirtley, 2006). ... 39 Figure 7 - The three components of the ground reaction force during normal gait (Kirtley, 2006). ... 40 Figure 8 - Block diagram of the algorithm to extract the gait features. ... 40 Figure 9 - Structure of the correlation matrix. ... 45
Chapter 4
Figure 10 - Graphs of the stride length (m) behavior in the barefoot trials (A) and in the wearing shoes trials (B) for both limbs. The numbers in parentheses represents the number of subjects that constituted the groups. ... 48 Figure 11 - Graph of the stride length (m) behavior in the wearing orthoses trials for both limbs. The numbers in parentheses represents the number of subjects that constituted the groups. ... 49
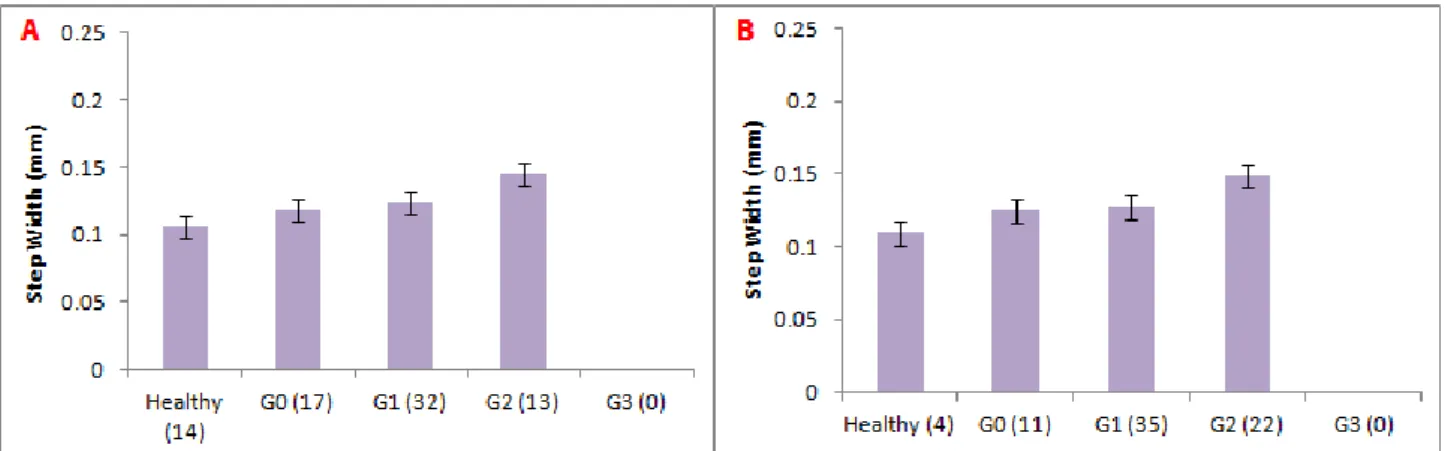
XV Figure 13 - Graph of the stride length (m) behavior in the wearing orthoses trials for both limbs. The numbers in parentheses represents the number of subjects that constituted the groups. ... 50 Figure 14 - Graphs of the step width (mm) behavior in the barefoot trials (A) and in the wearing shoes trials (B). The numbers in parentheses represents the number of subjects that constituted the groups. ... 51 Figure 15 - Graph of the step width (mm) behavior in the wearing orthoses trials. The numbers in parentheses represents the number of subjects that constituted the groups. ... 51 Figure 16 - Graphs of the cadence's (steps/min) behavior in the barefoot trials (A) and in the wearing shoes trials (B). The numbers in parentheses represents the number of subjects that constituted the groups. ... 52 Figure 17 - Graph of the cadence's (steps/min) behavior in the wearing orthoses trials. The numbers in parentheses represents the number of subjects that constituted the groups. ... 52 Figure 18 - Graphs of the velocity's (m/s) behavior in the barefoot trials (A) and in the wearing shoes trials (B). The numbers in parentheses represents the number of subjects that constituted the groups. ... 53 Figure 19 - Graph of the velocity's (m/s) behavior in the wearing orthoses trials. The numbers in parentheses represents the number of subjects that constituted the groups. ... 53 Figure 20 - Graphs of the stance time (s) behavior in the barefoot trials (A) and in the wearing shoes trials (B) for both limbs. The numbers in parentheses represents the number of subjects that constituted the groups. ... 54 Figure 21 - Graph of the stance time (s) behavior in the wearing orthoses trials. The numbers in parentheses represents the number of subjects that constituted the groups. ... 54 Figure 22 - Graphs of the swing time (s) behavior in the barefoot trials (A) and in the wearing shoes trials (B) for both limbs. The numbers in parentheses represents the number of subjects that constituted the groups. ... 55
XVI Figure 23 - Graph of the swing time (s) behavior in the wearing orthoses trials. The numbers in parentheses represents the number of subjects that constituted the groups. ... 55 Figure 24 - Graphs of the first and second double support periods behavior in the barefoot trials (A and C, respectively) and in the wearing shoes trials (B and D, respectively). The numbers in parentheses represents the number of subjects that constituted the groups. ... 56 Figure 25 - Graphs of the first double support period (A) and second double support period (B) behavior in the wearing orthoses. The numbers in parentheses represents the number of subjects that constituted the groups. ... 57 Figure 26 - Graphs of the coefficient of variation (%) behavior in the barefoot trials (A) and in the wearing shoes trials (B) for both limbs. The numbers in parentheses represents the number of subjects that constituted the groups. ... 57 Figure 27 - Graph of the coefficient of variation (%) behavior in the wearing orthoses trials. The numbers in parentheses represents the number of subjects that constituted the groups. ... 58 Figure 28 - Ankle angles of a healthy subject and a stroke patients during gait, for the right (green line) and left (red line) limbs. ... 59 Figure 29 - Knee angles of a healthy subject and a stroke patients during gait, for the right (green line) and left (red line) limbs. ... 60 Figure 30 - Hip angles of an healthy subject and a stroke patients during gait, for the right (green line) and left (red line) sides. ... 61 Figure 31 - Shoulder angles of a healthy subject and a stroke patients during gait, for the right (green line) and left (red line) limbs. ... 62 Figure 32 - Elbow angles of a healthy subject and a stroke patients during gait, for the right (green line) and left (red line) limbs. ... 63 Figure 33 - Graphs with the values of Ratio I for the barefoot (A), wearing shoes (B) and wearing orthoses (C) trials. The numbers in parentheses represents the number of subjects that constituted the groups. ... 64 Figure 34 - Graphs with the values of Ratio II for the barefoot (A), wearing shoes (B) and wearing orthoses (C) trials. The numbers in parentheses represents the number of subjects that constituted the groups. ... 65
XVII Figure 36 - Graphs with the values of Gait Asymmetry for the barefoot (A), wearing shoes (B) and wearing orthoses (C) trials. The numbers in parentheses represents the number of subjects that constituted the groups. ... 67 Figure 37 - Graphs with the values of Limp Index for the barefoot (A), wearing shoes (B) and wearing orthoses (C) trials. The numbers in parentheses represents the number of subjects that constituted the groups. ... 68 Figure 38 - Correlation matrix resulting from the Spearman's Correlation between the spatio-temporal gait features, for the barefoot trials. ... 69 Figure 39 - Correlation matrix resulting from the Spearman's Correlation between the spatio-temporal gait features, for the wearing shoes trials. ... 70 Figure 40 - Correlation matrix resulting from the Spearman's Correlation between the CoM displacements and the GRF, for the barefoot trials. ... 71 Figure 41 - Correlation matrix resulting from the Spearman's Correlation between the CoM displacements and the GRF, for the wearing shoes trials. ... 72 Figure 42 - Correlation matrix resulting from the Spearman's Correlation between the symmetry indexes, for the barefoot trials. ... 73 Figure 43 - Correlation matrix resulting from the Spearman's Correlation between the symmetry indexes, for the wearing shoes trials. ... 74 Figure 44 - Correlation matrix resulting from the Spearman's Correlation between the spatio-temporal gait features, the CoM displacements and the GRF components, for the barefoot trials. ... 74 Figure 45 - Correlation matrix resulting from the Spearman's Correlation between the spatio-temporal gait features, the CoM displacements and the GRF components, for the wearing shoes trials. ... 75 Figure 46 - Correlation matrix resulting from the Spearman's Correlation between the symmetry indexes and the spatio-temporal gait features, for the barefoot trials. ... 76
XVIII Figure 47 - Correlation matrix resulting from the Spearman's Correlation between the symmetry indexes and the spatio-temporal gait features, for the wearing shoes trials. ... 77 Figure 48 - Correlation matrix resulting from the Spearman's Correlation between the symmetry indexes, the CoM displacements and the GRF, for the barefoot trials. ... 78 Figure 49 - Correlation matrix resulting from the Spearman's Correlation between the symmetry indexes, the CoM displacements and the GRF, for the wearing shoes trials. ... 79 Figure 50 - Correlation matrix resulting from the Spearman's Correlation between the joints' angles in the sagittal plane and the spatio-temporal gait features, for the barefoot trials. ... 80 Figure 51 - Correlation matrix resulting from the Spearman's Correlation between the joints' angles in the sagittal plane and the spatio-temporal gait features, for the wearing shoes trials. . 80 Figure 52 - Correlation matrix resulting from the Spearman's Correlation between the joints' angles in the frontal plane and the spatio-temporal gait features, for the barefoot trials. ... 81 Figure 53 - Correlation matrix resulting from the Spearman's Correlation between the joints' angles in the frontal plane and the spatio-temporal gait features, for the wearing shoes trials. .. 82 Figure 54 - Correlation matrix resulting from the Spearman's Correlation between the joints' angles in the sagittal plane, the CoM displacements and the GRF components, for the barefoot trials. ... 82 Figure 55 - Correlation matrix resulting from the Spearman's Correlation between the joints' angles in the sagittal plane, the CoM displacements and the GRF components, for the wearing shoes trials. ... 83 Figure 56 - Correlation matrix resulting from the Spearman's Correlation between the joints' angles in the frontal plane, the CoM displacements and the GRF components, for the barefoot trials. ... 84 Figure 57 - Correlation matrix resulting from the Spearman's Correlation between the joints' angles in the frontal plane, the CoM displacements and the GRF components, for the wearing shoes trials. ... 85 Figure 58 - Correlation matrix resulting from the Spearman's Correlation between the joints' angles in the sagittal plane and the symmetry indexes, for the barefoot trials. ... 85
XIX angles in the frontal plane and the symmetry indexes, for the barefoot trials. ... 87 Figure 61 - Correlation matrix resulting from the Spearman's Correlation between the joints' angles in the frontal plane and the symmetry indexes, for the wearing shoes trials. ... 87 Figure 62 - Correlation matrix resulting from the Spearman's Correlation between the conventional Clinical Scales to assess the degree of impairment in stroke patients and the ReHabX Score, for the barefoot trials. ... 88 Figure 63 - Correlation matrix resulting from the Spearman's Correlation between the conventional Clinical Scales to assess the degree of impairment in stroke patients and the ReHabX Score, for the wearing shoes trials. ... 89 Figure 64 - Correlation matrix resulting from the Spearman's Correlation between the spatio-temporal gait features, the conventional Clinical Scales to assess the degree of impairment in stroke patients and the ReHabX score, for the barefoot trials. ... 89 Figure 65 - Correlation matrix resulting from the Spearman's Correlation between the spatio-temporal gait features, the conventional Clinical Scales to assess the degree of impairment in stroke patients and the ReHabX Score, for the wearing shoes trials... 90 Figure 66 - Correlation matrix resulting from the Spearman's Correlation between the CoM displacements, the GRF components, the conventional Clinical Scales and the ReHabX Score, for the barefoot trials. ... 91 Figure 67 - Correlation matrix resulting from the Spearman's Correlation between the CoM displacements, the GRF components, the conventional Clinical Scales and the ReHabX Score, for the wearing shoes trials. ... 92 Figure 68 - Correlation matrix resulting from the Spearman's Correlation between the joints' angles in the sagittal plane, the conventional Clinical Scales and the ReHabX Score, for the barefoot trials. ... 93
XX Figure 69 - Correlation matrix resulting from the Spearman's Correlation between the joints' angles in the sagittal plane, the conventional Clinical Scales and the ReHabX Score, for the wearing shoes trials. ... 94 Figure 70 - Correlation matrix resulting from the Spearman's Correlation between the joints' angles in the frontal plane, the conventional Clinical Scales and the ReHabX Score, for the barefoot trials. ... 95 Figure 71 - Correlation matrix resulting from the Spearman's Correlation between the joints' angles in the frontal plane, the conventional Clinical Scales and the ReHabX Score, for the wearing shoes trials. ... 95 Figure 72 - Correlation matrix resulting from the Spearman's Correlation between the symmetry indexes, the conventional Clinical Scales and the ReHabX Score, for the barefoot trials. ... 96 Figure 73 - Correlation matrix resulting from the Spearman's Correlation between the symmetry indexes, the conventional Clinical Scales and the ReHabX Score, for the wearing shoes trials. .. 97
Appendix III
Figure 74 - Correlation matrix resulting from the Pearson's Correlation between the spatio-temporal gait features, for the barefoot trials. ... 148 Figure 75 - Correlation matrix resulting from the Pearson's Correlation between the CoM displacements and the GRF components, for the barefoot trials. ... 148 Figure 76 - Correlation matrix resulting from the Pearson's Correlation between the symmetry indexes, for the barefoot trials. ... 149 Figure 77 - Correlation matrix resulting from the Pearson's Correlation between the spatio-temporal gait features, the CoM displacements and the GRF components, for the barefoot trials. ... 149 Figure 78 - Correlation matrix resulting from the Pearson's Correlation between the symmetry indexes and the spatio-temporal gait features, for the barefoot trials. ... 150 Figure 79 - Correlation matrix resulting from the Pearson's Correlation between the symmetry indexes, the CoM displacements and the GRF components, for the barefoot trials. ... 150
XXI in the frontal plane and the spatio-temporal gait features, for the baefoot trials. ...151 Figure 82 - Correlation matrix resulting from the Pearson's Correlation between the joints' angles in the sagittal plane, the CoM displacements and the GRF components, for the barefoot trials. ...152 Figure 83 - Correlation matrix resulting from the Pearson's Correlation between the joints' angles in the frontal plane, the CoM displacements and the GRF components, for the barefoot trials. ...152 Figure 84 - Correlation matrix resulting from the Pearson's Correlation between the joints' angles in the sagittal plane and symmetry indexes, for the barefoot trials. ...153 Figure 85 - Correlation matrix resulting from the Pearson's Correlation between the joints' angles in the frontal plane and symmetry indexes, for the barefoot trials. ...153 Figure 86 - Correlation matrix resulting from the Pearson's Correlation between the conventional Clinical Scales used to assess the level of impairment of stroke patients and the ReHabX Score, for the barefoot trials. ...154 Figure 87 - Correlation matrix resulting from the Pearson's Correlation between the spatio-temporal gait features, the conventional Clinical Scales used to assess the level of impairment of stroke patients and the ReHabX Score, for the barefoot trials. ...154 Figure 88 - Correlation matrix resulting from the Pearson's Correlation between the CoM displacements, the GRF components, the conventional Clinical Scales and the ReHabX Score, for the barefoot trials. ...155 Figure 89 - Correlation matrix resulting from the Pearson's Correlation between the joints' angles in the sagittal plane, the conventional Clinical Scales and the ReHabX Score, for the barefoot trials. ...155 Figure 90 - Correlation matrix resulting from the Pearson's Correlation between the joints' angles in the frontal plane, the conventional Clinical Scales and the ReHabX Score, for the barefoot trials. ...156
XXII Figure 91 - Correlation matrix resulting from the Pearson's Correlation between the symmetry indexes, the conventional Clinical Scales and the ReHabX Score, for the barefoot trials. ...156 Figure 92 - Correlation matrix resulting from the Pearson's Correlation between spatio-temporal gait features, for the wearing shoes trials. ...157 Figure 93 - Correlation matrix resulting from the Pearson's Correlation between the CoM displacements and the GRF components, for the wearing shoes trials. ...157 Figure 94 - Correlation matrix resulting from the Pearson's Correlation between symmetry indexes, for the wearing shoes trials. ...158 Figure 95 - Correlation matrix resulting from the Pearson's Correlation between spatio-temporal gait features, the CoM displacements and the GRF components, for the wearing shoes trials. ...158 Figure 96 - Correlation matrix resulting from the Pearson's Correlation between the symmetry and the spatio-temporal gait features, for the wearing shoes trials. ...159 Figure 97 - Correlation matrix resulting from the Pearson's Correlation between the symmetry indexes, the CoM displacements and the GRF components, for the wearing shoes trials. ...159 Figure 98 - Correlation matrix resulting from the Pearson's Correlation between the joints' angles in the sagittal plane and the spatio-temporal gait features, for the wearing shoes trials. ...160 Figure 99 - Correlation matrix resulting from the Pearson's Correlation between the joints' angles in the frontal plane and the spatio-temporal gait features, for the wearing shoes trials. ...160 Figure 100 - Correlation matrix resulting from the Pearson's Correlation between the joints' angles in the sagittal plane, the CoM displacements and the GRF components, for the wearing shoes trials. ...161 Figure 101 - Correlation matrix resulting from the Pearson's Correlation between the joints' angles in the frontal plane, the CoM displacements and the GRF components, for the wearing shoes trials. ...161 Figure 102 - Correlation matrix resulting from the Pearson's Correlation between the joints' angles in the sagittal plane and the symmetry indexes, for the wearing shoes trials. ...162 Figure 103 - Correlation matrix resulting from the Pearson's Correlation between the joints' angles in the frontal plane and the symmetry indexes, for the wearing shoes trials. ...162
XXIII Figure 105 - Correlation matrix resulting from the Pearson's Correlation between the spatio-temporal gait features, the conventional Clinical Scales used to assess the level of impairment of stroke patients and the ReHabX Score, for the wearing shoes trials. ...163 Figure 106 - Correlation matrix resulting from the Pearson's Correlation between the CoM displacements, the GRF components, the conventional Clinical Scales and the ReHabX Score, for the wearing shoes trials. ...164 Figure 107 - Correlation matrix resulting from the Pearson's Correlation between the joints' angles in the sagittal plane, the conventional Clinical Scales used to assess the level of impairment of stroke patients and the ReHabX Score, for the wearing shoes trials. ...164 Figure 108 - Correlation matrix resulting from the Pearson's Correlation between the joints' angles in the frontal plane, the conventional Clinical Scales used to assess the level of impairment of stroke patients and the ReHabX Score, for the wearing shoes trials. ...165 Figure 109 - Correlation matrix resulting from the Pearson's Correlation between the symmetry indexes and the conventional Clinical Scales used to assess the degree of impairment of the stroke patients, and the ReHabX Score, for the wearing shoes trials. ...165
XXIV
List of Tables
Chapter 2
Table 1 - Methods to assess gait balance, their description and the authors that used the respective method ... 14 Table 2 - Methods to assess gait stability, their description and the authors that used the respective method ... 18 Table 3 - Methods to assess gait symmetry, their description and the authors that used the respective method ... 25
Chapter 3
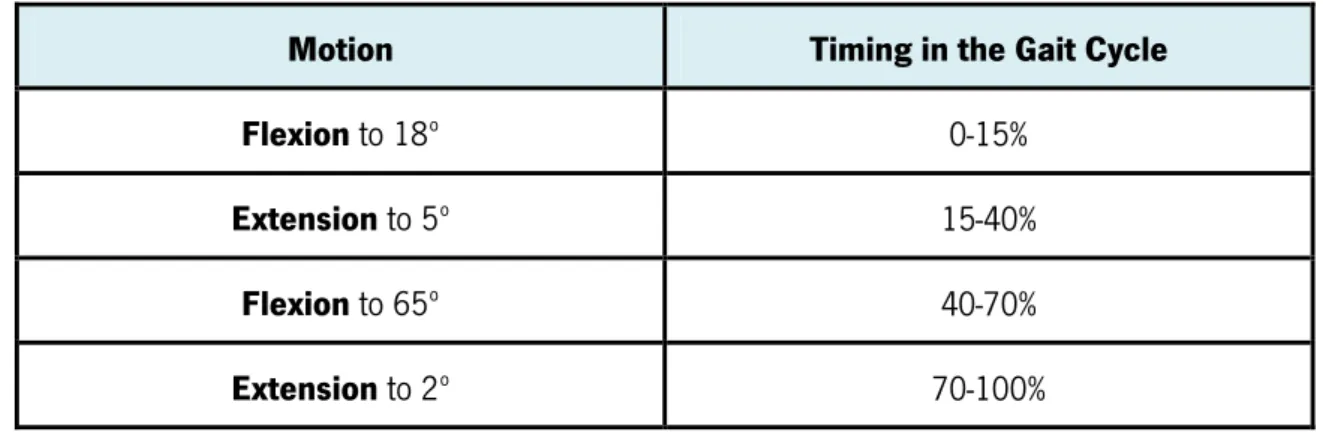
Table 4 - Average magnitude, timing and sequence of ankle motion during each stride (Perry, 1992) ... 37 Table 5 - Average magnitude, timing and sequence of knee motion during each stride (Perry, 1992) ... 38 Table 6 - Average magnitude, timing and sequence of hip motion during each stride (Perry, 1992) ... 38 Table 7 - Color scheme applied to the Spearman's and Pearson's Correlations, based on Mukaka (2012) ... 46
Appendix I
1
2
1.1 Motivation
Stroke is a common brain disorder responsible, in the United States of America, for approximately 1 of every 20 deaths in 2011. On average, every 40 seconds, someone in the United States has a stroke, and someone dies of one approximately every 4 minutes (American Heart Association, 2014).
From 2001 to 2011, the relative rate of stroke death fell by 35.1% and the actual number of stroke deaths declined by 21.2%. However, approximately 795 000 people experience a new or recurrent stroke and it is estimated that 6.6 million Americans with a age equal and superior to 20 years have had a stroke, in 2012. Projections show that by 2030 an additional 3.4 million people with a age superior and equal to 18 years will have had a stroke, a 20.5% increase in prevalence from 2012 (American Heart Association, 2014).
Portugal was, in 2010, the eighth country with the highest death rate caused by stroke in Europe. Every hour, about 6 Portuguese suffer a stroke, which result in 2 to 3 deaths (Direção Geral de Saúde, 2014).
The effects of stroke are several, especially in the individual's ability of walking independently and efficiently. After a stroke, 50% of the individuals will have no walking function (Patterson, 2010). In order to regain the ability of walking, the degree of impairment of the stroke patients is quantified, using clinical scales, with the purpose to establish the more adequate methods of recovery and rehabilitation. After the recovery and rehabilitation, 64% of the stroke individuals regain the ability to walk independently whilst 14% have the need of assistance and 22% continue unable to walk (Patterson, 2010).
The percentage of strokes occurrences and the projections for 2030, as well, the number of stroke patients that, after recovery and rehabilitation, are unable and still need assistance to walk are the motivation for this work, whose purpose is to evaluate the balance, the stability and the gait symmetry of stroke patients.
3
1.2 Scope and Objectives
The main goal of this work is to evaluate the balance, the stability and the gait symmetry of stroke patients, and for that purpose use kinematic and dynamic gait lab data.
The specific objectives of this investigation can be listed as follows:
Clarify the basic theoretical concepts related to human gait and stroke;
Review the state of the art with respect to studies related to the assessment of balance, stability and gait symmetry;
Establish a method to assess balance, stability and gait symmetry of stroke patients;
Select a method to identify the best gait features and the medical method (conventional clinical scales or ReHabX Score) that better relate with gait symmetry, balance and stability.
The methods here proposed are the extractions of the gait features (spatio-temporal, kinematic and kinetic) and the computation of the symmetry indexes followed by a statistical analysis (Pearson's Correlation Coefficient and Spearman's Rank Correlation Coefficient) to identify the relationship between data extracted, the Symmetry Indexes, the ReHabX Score and the conventional clinical methods to evaluate the degree of impairments of stroke patients. The correlation analysis allows to identify the gait features, the symmetry indexes and the medical methods that better quantify and assess the balance, stability and gait symmetry of stroke patients.
This report contains five main chapters organized as follows:
In Chapter 1, an overview of the report is provided, objectives are defined and a literature review of the dissertation topic is made.
In Chapter 2, a gait cycle description is made to provide basic knowledge of a normal human gait and the brain disorder Cerebrovascular Accident (stroke) is defined, as well its impacts in the gait are discussed. The terms balance, stability and symmetry are defined and the methods to assess them, in the literature, are presented. Ultimately the conventional clinical scales used to evaluate the degree of impairments in stroke patients and the ReHabX Score are discussed and explained.
Chapter 3 covers the methodologies applied in this work. First, the data acquisition procedure in the gait lab is exposed as so the gait features extraction in MATLAB. Then the
4 In the Chapter 4, all results are analyzed and discussed as well their implications. Finally, Chapter 5 summarizes the main conclusions of the present work and presents some suggestions for future developments.
1.3 Literature Review
Walking efficiently is a crucial function that allows the human beings to do their daily activities independently. Accidents and diseases as stroke, the most common brain disorder, can compromise the ability of walking and, consequently, an individual's independence (Belda-Lois et al., 2011; Maddox, 2013; Tortora and Derrickson, 2008). A post-stroke gait is extremely demanding for the patients and is characterized by asymmetry, instability and loss of balance (Kim and Eng, 2003; Patterson, 2010; Titianova and Tarkka, 1995; Yavuzer et al., 2006).
The aim of rehabilitation, in stroke patients, is to reverse the effects of stroke and recover the ability of walking independently, so the patients can perform their daily activities easily (Belda-Lois et al., 2011; Maddox, 2013). Rehabilitation programs rely on the patient's degree of impairment. The degree of impairment is established by the scores of the conventional clinical scales, such as the National Institutes of Healthy Stroke Scale (NIHSS) and the Time Up & Go Test. The conventional clinical scales lean, mostly, on the patient's ability to perform daily activities (Gillen, 2010; Herndon, 2006; Oliveira et al., 2008).
Gait asymmetry, instability and balance are commonly used as rehabilitation indicators in stroke patients (Gouwanda and Senanayake, 2011; Michael, Alle and Macko, 2005). Much research has been done to quantify this three gait characteristics and to understand their relation with current methods of rehabilitation.
The assessment of gait symmetry, balance and stability is usually done by gait analysis. Gait analysis characterizes the human locomotion by measuring, accurately, the movements of the body. Through the acquisition and analysis of the spatio-temporal features, kinematic and kinetic data, gait analysis provides accurate information on the degree to which a patient's gait has been affected by a stroke (Davis et al., 1991).
5 The extraction of the spatio-temporal features, kinematic and kinetic data allows the comparison between healthy individuals and stroke patients, to analyze the differences and determine which gait features should be trained in order to recover an improve the walking function (Hodt-Billington, Helbostad and Moe-Nilssen, 2008; Mullie and Duclos, 2014; Patterson et al., 2010b). Also, with the data extracted, equations are create and studied to quantify the degree of stability, balance and gait symmetry in stroke patients (Herzog et al., 1988; Mizelle, Rodgers and Forrester, 2006; Nigg et al., 2013; Patterson et al., 2010b).
Further, the relations between gait features, equations and methods to assess gait symmetry, stability and balance are determined using correlation like Pearson's Correlation Coefficient and Cross-Correlation (Kim and Eng, 2003; Park, Dankowicz and Hsiao-Wecksler, 2012; Van Schooten et al., 2014). Correlation are, also, used to determine the best symmetry indexes and gait features to use in the indexes (Patterson et al., 2010b).
To understand the consequences of rehabilitation in gait, the gait features and the scores of the conventional Clinical Scales, used to assess the degree of impairment in stroke patients, are extracted before and after rehabilitation and compared (Chen et al., 2002; Patterson et al., 2010a; Patterson et al., 2010b; Yavuzer et al., 2006). The relations between gait features in stroke patients and the conventional Clinical Scales are analyzed using correlations, such as Pearson's Correlation Coefficient (Garland et al., 2003; Karatas et al., 2004; Stevenson and Garland, 1996).
1.4 Contributions of this dissertation
The first and second chapters of the dissertation contain a current literature review on the methods used to assess balance, stability and gait symmetry and an important background knowledge regarding to human gait, consequences of stroke in the gait and clinical scales used to evaluate the degree of impairments in stroke patients.
The code to extract the gait features, presented in the appendices, was written by the author.
7
8 assess them, in the literature, are presented. Finally, the clinical scales to evaluate the degree of impairments in stroke patients and the ReHabX Score are discussed and explained.
2.1 Human Gait Description
Human gait is the most common of all human movements and is the one of the most complex movements that we learn (Winter, 1991).
Normal human walking is a periodic movement and is described as a process of locomotion in which one foot or the other is always on the ground and involves, alternately, the use of the two legs to provide support and propulsion (Rose and Gamble, 2005; Whittle, 2007).
The terms walking and gait are often used interchangeable but they differ slightly since the term walking refers to the locomotion process itself and the term gait refers to the “the manner or style of walking”, making the analyses of gait patterns more suitable than walking (Whittle, 2007).
The normal gait is a concept that is tough to describe since it involves both feminine and masculine gender, a wide range of ages, a large range of extremities of body geometry and most of the time some patients with a gait pattern that differs from the normal compensate their gait abnormalities and this is not a reason that efforts should be made to turn it into a ‘normal’ gait. Thus, the normal gait is the one within the normal limits suitable for each gender and age (Whittle, 2007).
The gait cycle is defined as the time interval between two consecutive occurrences of one of the repetitive events of walking. In the case of the right foot contact the ground first the gait cycle is only complete when the right foot contact the ground again (Whittle, 2007). Throughout the gait cycle seven events can be identify, namely:
1. Initial contact or Foot strike (FS) 2. Opposite toe off
9 4. Opposite initial contact
5. Terminal contact or Foot off (FO) 6. Feet adjacent
7. Tibia vertical
(1. Initial contact of the next cycle)
The seven events listed above subdivide the gait cycle into seven periods. Four of the periods occur in the stance phase (is the period of time when the foot is in contact with the ground) and the other three in the swing phase (period of time when the foot is not in contact with the ground; during the swing phase on the right side, only the left foot is on the ground), as illustrated in the Figure 1 (Whittle, 2007; Winter, 1991).
The four periods occurring in the stance phase are Loading Response, Mid-Stance, Terminal Stance and Pre-Swing.
The Loading Response, usually representing 10-12% of the cycle, is the double support period between foot strike and opposite foot off. During this period, the foot is lowered to the ground by plantarflexion and the ground reaction forces (GRF) increases rapidly in magnitude, as total plantar contact is reached (Magee, 2014; Perry, 1992; Whittle, 2007).
Figure 1 - Illustration of the major events and phases of the gait cycle by
10 plantarflexion to dorsiflexion (Magee, 2014; Perry, 1992; Whittle, 2007).
The Terminal Stance, representing 20% of the gait cycle, starts at foot strike and ends when the opposite foot strike occurs. At the end of terminal stance, the dorsiflexion reaches its maximum value (Magee, 2014; Perry, 1992; Whittle, 2007).
The Pre-Swing period, starts at the opposite foot strike and ends when the stance limb foot off occurs. It is the second double support period of the gait cycle. During this period, the ankle movement changes into plantarflexion and the peak of ankle plantarflexion occurs at foot off. This period lasts about 10% of the gait cycle (Magee, 2014; Perry, 1992; Whittle, 2007).
The three periods occurring in the swing phase are Initial Swing, Mid-Swing and Terminal Swing.
The Initial Swing, representing 13% of the gait cycle, begins at foot off and continues until the maximum knee flexion occurs, which coincide with feet adjacent position. During the swing phase, the ankle is moving from a plantarflexed position at toe off towards a neutral or dorsiflexed attitude in terminal swing (Magee, 2014; Perry, 1992; Whittle, 2007).
The Mid-Swing is the period between feet adjacent and tibia vertical of the cycle. At this phase, the ankle attitude becomes less important and it may be anywhere between a few degrees of plantarflexion and a few degrees of dorsiflexion. This period represents about 14% of the gait cycle (Magee, 2014; Perry, 1992; Whittle, 2007).
The Terminal Swing is the final period of the swing phase, representing 13% of the cycle. It is the deceleration phase where the knee fully extends in preparation for heel strike. In this phase, the ankle muscles activity increases to hold the ankle in position in anticipation of the greater contraction forces developed during the loading response (Magee, 2014; Perry, 1992; Whittle, 2007).
In a normal gait cycle the stance phase usually lasts about 60% and the swing phase 40%. In each cycle there are two periods of double support (periods of time when both feet are in contact with ground), each of one lasts about 10% of the cycle. As well, there are two periods of single support (period when only one limb is in contact with the ground and is equal to the swing
11 period of the contralateral limb), as it can be observed in the Figure 2 (Whittle, 2007; Winter, 1991).
2.2. Impact of Stroke on Human Gait
A Cerebrovascular Accident (CVA), also called Stroke, is the most common brain disorder (Tortora and Derrickson, 2008).
This disorder is characterized by the rapidly development of clinical signs of focal, and at times global, disturbance of cerebral function, lasting more than 24 hours or leading to death, with no apparent cause other than of vascular origin (Aho et al., 1980; Lindley, 2008). Ischemic and hemorrhagic are the two main types of strokes. The first occurs as a result of an obstruction within a blood vessel supplying blood to the brain and the second when a weakened blood vessel that ruptures and bleed into the surrounding brain (Maddox, 2013).
Although it is a brain disease, strokes can have effects on the entire body, leading to speech problems, cognitive and memory deficits, pain and paralysis or loss of sensation that will affect the daily living activities of the individual (Maddox, 2013; Tortora and Derrickson, 2008).
Paralysis is the most frequent outcome of this disorder, and can be partial (paresis) or complete (plegia). The paralysis or weakness can affect only one side of the body (Hemiplegia
Figure 2 - Timing of single and double support during both legs gait cycle, starting with the right leg
12 as well if the left hemisphere is the one being affected a right-side paralysis is felt (Fraser et al., 2008).
Walking efficiently is a vital ability to the life of all humans because it is essential to a more independent living and to perform several activities of the daily living.
After a stroke, 50% of the individuals will have no walking function. After the recovery and rehabilitation, 64% of the stroke individuals regain the ability to walk independently whilst 14% have the need of assistance and 22% continue unable to walk (Patterson, 2010).
The gait of post-stroke individuals is inefficient with higher oxygen consumption. The profile of a post-stroke gait is characterized by a slower gait velocity (in stroke patients the preferred gait velocity is 0.56-0.73 (SD 0.24-033) m/s while for healthy individuals is 1.05-150 m/s), an increased step width (also known as the 'base of support' or ''walking base'), a decreased cadence, a shorter stride length and step length (Hodt-Billington, 2012; Malone and Bastian, 2014; Mizelle, Rodgers and Forrester, 2006; Patterson, 2010).
The stance phase has a longer duration on the non-affected limb comparing to the affected, the swing phase is longer on the affected side when compared to the non-affected and there is a increase on the time spent on double support (Patterson, 2010; Titianova and Tarkka, 1995; Wong et al., 2004).
The kinematic and kinetic profiles suffers alterations on the magnitude (angle ranges, peak power and peak moments) and pattern (shape and direction of curves) (Patterson, 2010). The ground reaction forces (GRF) on the affected limb decrease and the average position of the centre of pressure (CoP) shifts towards the non-affected limb (Kim and Eng, 2003; Van Peppen et al., 2006).
Asymmetry is also one of the characteristics of an post-stroke gait that may lead to loss of bone mass density of the affected limb, problems in stability and balance control, an increased risk of musculoskeletal pain and joint degeneration on the affected limb due to fact the non-affected limb bears more body weight than the non-affected (Hurmuzlu and Basdogan, 1994; Kim and Eng, 2003; Patterson, 2010; Titianova and Tarkka, 1995; Yavuzer et al., 2006).
13 Walking for a stroke patient is extremely physically demanding and because walking is so important to an independent life, the profile of post-stroke gait has been studied using different techniques such as spatio-temporal gait parameters, electromyography (EMG), oxygen consumption measures, kinematics and kinetics measures. This studies are made to characterize and understand the degree and nature of the dysfunction in order to create a rehabilitation program more suitable to the stroke disorder patients and to facilitate the regain of the gait independence (Patterson, 2010).
2.3 Balance, Stability and Symmetry
A gait without impairment is a symmetric and a stable gait with an excellent balance control, however this are not the features of an post-stroke patient gait. The decline of the individuals' ability to walk in a stable and symmetric manner and the loss of balance control are a manifestation of a stroke and the solution of that problem is the main concern of gait assessment studies (Hurmuzlu and Basdogan, 1994; Kim and Eng, 2003; Patterson, 2010; Titianova and Tarkka, 1995).
The assessment of balance, stability and gait symmetry is been made for a long time using different methods that are presented bellow.
2.3.1 Balance
The ability to maintain functional equilibrium by keeping or returning the centre of body mass over its base support is called balance (Eckert, 1979; Horak, 1987).
Balance is an essential part of sitting, sit-to-stand and walking activities. After a stroke several patients will never the able to stand and walk, however the ones that manage to stand an walk have a delay and disrupted equilibrium reaction, exaggerated postural sway and a reduced weight-bearing on the affected limb (Yavuzer, et al., 2006).
Balance in a healthy and pathological gait can be assessed through various methods. The different methods used to assess balance are listed in Table 1, as well a short description of each one and the authors that used the method.
14
Spatio-temporal Gait Features
Spatio-temporal gait features like velocity, step length, step width, stride length and time, swing and stance times and cadence are extracted (using the trajectory of reflective markers and force platforms) during walking trial for healthy individuals and stroke patients.
Furthermore, to enable the assessment of balance, the features' values are analyzed to observe the:
differences between the paretic and non-paretic limbs, in the stroke patients;
differences between healthy individuals and stroke patients;
behavior when the individuals cross obstacles;
the consequences of rehabilitation.
Hahn and Chou, 2003 Garland et al., 2003 Yavuzer et al., 2006
Howell, Osterning and Chou, 2013
Hendrickson et al., 2014 Mullie and Duclos, 2014 Sawa et al., 2014
Head Movement Analysis
The head movement has been suggested as a valid reference for dynamic equilibrium due to its clear visibility during locomotion.
The head displacement and peak velocity in the medio-lateral direction are calculated and examined during an unobstructed walking and crossing various obstacles. Medio-lateral (ML) excursion of the reflective markers on the superior aspect of the head are used in the calculations.
Hahn and Chou, 2003
EMG
The muscles activity minimize the postural disruptions produced by perturbations, so their analysis is important to understand gait balance.
The activity of the muscles is recorded by using surface electromyography (EMG) technology, and for each muscle group 2 surface electrodes are placed vertically in the midline of the distal third of the muscle.
The EMG traces of both limbs' muscles are analyzed (Stevenson and Garland, 1996), as well EMG burst area and latency are analyzed at the patients' moment of admission and after 4 weeks of rehabilitation for both limbs (Garland et al., 2003).
Stevenson and Garland, 1996
15
Table 1 - Methods to assess gait balance, their description and the authors that used the respective method
Method
Description
References
Analysis of the Centre of
Pressure
The CoP reflects the orientation of the body segments and provides information on the strategies used to control dynamic equilibrium.
The CoP displacement, velocity, amplitude, regularity, ellipse area and root mean square amplitude and velocity in the AP and ML directions are the usual measures calculated using the data collected from the force plates.
The measures of the centre of pressure are done for both limbs of stroke patients and healthy individuals during quiet standing with the eyes open or close and with or without arm movement or during walking with or without perturbations.
Prieto et al., 1996 Stevenson and Garland, 1996 Winter et al., 1996 Niam et al., 1999 Garland et al., 2003 Geurts et al., 2005 Lin et al., 2008 Parker et al., 2008 Roerdink et al., 2009 Gray, Ivanova and Garland, 2014
Wallard et al., 2014
Analysis of the Centre of Mass
The CoM is the point of application of the resultant of the forces exerted on the test subject and provides information on the strategies used to control dynamic equilibrium.
The whole body CoM can be calculated in different ways:
as the weighted sum of each body segment, with 13 segments representing the whole body: head–neck, trunk, pelvis, upper and lower arms, upper and lower legs, feet (Hahn and Chou, 2003; Howell, Osterning and Chou, 2013; Parker et al., 2008);
using the translated kinetic and kinematic data obtained through the trajectory of the retro-reflective markers (Mullie and Duclos, 2014; Wallard et al., 2014).
The CoM displacements in the anterior-posterior (AP) and medio-lateral (ML) directions are measured and examined, as well the velocities and accelerations (using the generalized cross-validated spline algorithm).
Hahn and Chou, 2003 Parker et al., 2008
Howell, Osterning and Chou, 2013
Mullie and Duclos, 2014 Wallard et al., 2014
16
Trunk Movement Analysis
The trunk movement, due to its clear visibility during locomotion, is analyzed to assess gait balance.
There are different methods to calculate the trunk movement, such as:
using the trajectory of the reflective markers placed in the trunk area (Hahn and Chou, 2003);
using two wireless motion-recording-sensor units, of which one fixed to a belt at the level of the L3 spinous process and the other is attached to the posterior surface of the right heel with surgical tape (Sawa et al., 2014);
using an accelerometer (that measured trunk acceleration in the vertical, anterior-posterior and medio-lateral directions) over the spine at the level of L5, attached to a neoprene belt around the pelvis (Van Schooten et al., 2014).
The trunk displacement and peak velocity in the ML direction are calculated and analyzed during an unobstructed walking and crossing various obstacles (Hahn and Chou, 2003), as well the trunk variability.
Hahn and Chou, 2003 Sawa et al., 2014
Van Schooten et al., 2014
Hip Movement Analysis
The analysis of the hip movement is also a method to assess and understand gait balance.
The calculation of the paretic hip excursions (difference between peak and valleys of the curve in degrees) in the sagittal plane, during gait, and the peak extensor and abductor moments of the hip, during stance, are made using the three dimensional (3D) positions of reflective markers that are attached to the individuals. The joint angles are calculated as ordered rotations between anatomically aligned reference frames associated with adjacent body segments.
The behavior of the hip movement is analyzed before and after rehabilitation.
17
Table 1 - Methods to assess gait balance, their description and the authors that used the respective method
Method
Description
References
Pelvic Movement Analysis
The Pelvic movement is analyzed to assess gait balance since the movement of the pelvis plays an important role in the locomotion.
The methods to calculate the pelvic movement include:
the use of the trajectory of ultrasonic transducer markers, that are placed in a customized pelvic belt situated around the waist (Dickstein and Abulaffio, 2000);
the use of the trajectory of reflective markers placed in the pelvic area (Hahn and Chou, 2003; Yavuzer et al., 2006).
Pelvic displacement and peak velocity in the AP and ML directions are calculated for both of the limbs in healthy individuals and stroke patients (Dickstein and Abulaffio, 2000); as well pelvic displacement and peak velocity in ML direction during an unobstructed walking and crossing various obstacles (Hahn and Chou, 2003). Pelvic excursions (degrees) in the sagittal, frontal and transverse plane, before and after rehabilitation are, also, calculated (Yavuzer et al., 2006).
Dickstein and Abulaffio, 2000
Hahn and Chou, 2003 Yavuzer et al., 2006
Leg Movement Analysis
Both legs movement of healthy individual and stroke patients, in the AP and MP directions, are calculated through the trajectory of the ultrasonic transducer markers. The variation between the different groups values' is analyzed in order to understand the importance of the leg movement in postural sway.
Dickstein and Abulaffio, 2000
2.3.2 Stability
Stability can be defined as the ability of the human body to return to its original state without falling after a perturbation (Bruijn et al., 2013; Cotoros and Baritz, 2010).
18
Table 2 - Methods to assess gait stability, their description and the authors that used the respective method
Method
Description
References
Spatio-temporal Gait Features
Spatio-temporal gait features like velocity, step length, stride length and step width are extracted (using the trajectory of reflective markers, force platforms) during walking trial for each limb for healthy individuals and stroke patients.
The features' values are analyzed to observe, with an without the presence of perturbations, the differences between healthy individuals and stroke patients and the behavior of some features when the gait velocity changes in order to assess and understand gait stability.
Bhatt, Wening and Pai, 2005
Bruijn et al., 2010 Hak et al., 2012
Standard
Deviation (SD) Represents the standard deviation of stride time.
Bisi, Riva and Stagni, 2014 Riva et al., 2014
Riva, Bisi and Stagni, 2014
Coefficient of Variation (CV)
Calculates the variability of a certain gait parameter normalized to the mean stride time value:
An increase in the variability of gait indicates loss of stability and therefore of increased probability of falling. Examples of variability measures are gait features like stride times, step length, step width, trunk movement and joint angle time series variability.
Van Schooten et al., 2011 Kurz, Arpin and Corr, 2012 Bruijn et al., 2013
Riva et al., 2014
19
Table 2 - Methods to assess gait stability, their description and the authors that used the respective method
Method
Description
References
Analysis of the Ground Reaction
Forces
The ground reaction forces and the moments of force, in all the three planes, were obtained through force plates, during quiet stance.
The standard deviation of the vertical, lateral and antero-posterior forces are analyzed when the test subjects are standing in the platform for different amounts of time.
Le Clair and Riach, 1996
Analysis of the Centre of
Pressure
The centre of pressure is obtained through force plates, during quiet stance.
The average velocity and the standard deviation of the CoP displacements, in the AP and ML directions, are analyzed when the test subjects are standing in the platform during different amounts of time.
Le Clair and Riach, 1996
Extrapolated Centre of Mass
(XCoM)
The extrapolated centre of mass concept extends the classical condition for static equilibrium of an inverted pendulum, in which the CoM must be positioned over the base of support (BoS) by adding a linear function of the velocity of the CoM to the CoM position. The is calculated as:
where is the position of the centre of mass; is
the velocity of and is the inverted pendulum's eigenfrenquency:
with representing the acceleration of gravity and the equivalent to the pendulum length of the subject.
The can be used to calculate both the spatial margin of stability ( ) and a temporal stability margin ( ).
Bhatt, Wening and Pai, 2005
20
Margin of Stability
The margin of stability is quantified as the distance between the and the border of the BoS. The temporal stability margin ( ) it is the time that corrections to the CoM position and/or velocity can be made without the need to move the arms, trunk or to use a stepping strategy.
This method describes how close an inverted pendulum is to falling and can be seen as a reflection of a control strategy.
The margin of stability and the temporal stability margin can be defined as:
where coincides with the CoP position and if or , stability cannot be regain without compensatory strategies.
This method can be used in the analysis of medio-lateral and antero-posterior stability, however in the analysis of AP stability the and values are negative, indicating that gait cannot be stopped within that step.
Hak et al., 2012 Bruijn et al., 2013 Antonio and Perry, 2014
Harmonic Ratio (HR)
The Harmonic Ratio provides information on how smoothly subjects control their trunk during walking and gives indication of whole body balance and coordination. A higher HR indicates smoother and more stable trunk movement during gait.
The HR quantifies the smoothness of AP, ML and vertical (V) acceleration patterns of the trunk, based on amplitudes in the frequency spectra. It can be calculated by decomposing acceleration signals into harmonics using a discrete Fourier transform.
AP and V harmonic ratios are calculated by dividing even harmonics by odd harmonics, while ML is the ratio between odd an even harmonics.
Yack and Berger, 1993 Chatterjee , 2010
Bisi, Riva and Stagni, 2014 Riva et al., 2014
21
Table 2 - Methods to assess gait stability, their description and the authors that used the respective method
Method
Description
References
Maximum Floquet Multipliers (FM)
The maximum Floquet multipliers (FM) is a technique that has been successfully used to assess the dynamic stability, quantifying the rate that the walking pattern returns back to the limit cycle trajectory after experiencing a disturbance. A walking pattern is less stable if it takes more strides to return back to the limit cycle trajectory.
Calculating the FM from human gait data demand the construction of a state space from kinematic data and for that two approaches are normally used:
the direct inclusion of acquired variables (acceleration time series) into the state space;
the delay-embedding reconstruction to reconstruct a dynamical system from a sequence of observations. Floquet theory assumes that a system is strictly periodic. A Poincaré section is defined at each percentage of the gait cycle where the state of a system after one cycle ( ) is a
function ( ) of its current state ( ), for each stride k at each Poincaré section:
The limit cycle trajectories corresponding to fixed points ( ) in each Poincaré section was defined as the average trajectory across all strides:
To evaluate the effects of small perturbations on , a linearization of the previous equation is used:
.
The FM are the eigenvalues of the Jacobian matrix . The FM magnitude indicates the rate of divergence/convergence over cycles and if <1, the system remains stable, otherwise, the system tends to diverge from the limit cycle and become unstable.
Scheiner, Ferencz and Chizeck, 1995
Dingwell and Kang , 2007 Kurz, Arpin and Corr, 2012 Bruijn et al., 2013
Bisi, Riva and Stagni, 2014 Riva, Bisi and Stagni, 2014
22
Maximum Lyapunov Exponent
The maximum Lyapunov exponent () quantifies the local dynamic stability as the average logarithmic rate of divergence of a system after a small perturbation. Therefore,
quantifies the reaction of gait kinematics to an infinitely small perturbation, where the gait kinematics are regarded locally dynamically unstable when >0 and locally dynamically stable when <0.
The construction of a proper state space from any source of kinematic data, obtained during a steady-state walking trial, is the first step to calculate the maximum Lyapunov exponent.
The calculation of is achieved by either:
identifying the nearest neighbor in state space for each data point, or
identifying the nearest neighbor for data points along a single reference trajectory. It is important to point out that, for a continuous series (marker position or joint angle time series) the entire data series serves as the reference trajectory.
In both of the calculations, the log of the expansion/contraction of the Euclidean distance between these points is calculated and the local divergence exponents were estimated from the slopes of linear fits to these exponential divergence curves:
where is the Euclidean distance between the th pair of initially nearest neighbors after discrete time steps and denotes the average over all values of .
The short term Lyapunov Exponent are calculated from the slopes of linear fits to the divergence curve between 0 and 1 stride and the long term Lyapunov Exponent between 4 and 10 strides.
Dingwell et al., 2000 Bruijn et al., 2010
Van Schooten et al., 2011 Hak et al., 2012
Ihlen et al., 2012 Bruijn et al., 2013
Bisi, Riva and Stagni, 2014 Riva et al., 2014
23
Table 2 - Methods to assess gait stability, their description and the authors that used the respective method
Method
Description
References
Recurrence Quantification Analysis (RQA)
The RQA is a nonlinear technique based on local recurrence of data points in the reconstructed phase space. This technique provides a characterization of a variety of features (like CoP) of a given time series, such as the quantification of deterministic structure and nonstationarity.
Four different state spaces are constructed:
one 3D state space composed by acceleration signals in the V, ML and AP direction;
three (one per direction) 5-dimensional state spaces composed by delay- embedding of each acceleration component (delay = 10 samples).
After, a distance matrix based on Euclidean distances between normalized embedded vectors is constructed and the recurrence plot is obtained by selecting a radius of 40% of the max distance, and all cells with values below this threshold are identified as recurrent points.
Several measures are extracted from RQA, namely Recurrence Rate (RR), Determinism (DET), averaged diagonal line length (AvgL) and maximum diagonal line length (MaxL):
where is the number of points on the phase space trajectory;
where is the length of diagonal lines, represented through a histogram ( );
where is the number of diagonal lines in the reference plot.
Riley, Balasubramaniam and Turvey, 1999
Bisi, Riva and Stagni, 2014 Riva et al., 2014