spectrophotometric technique
(Simultaneous Equation Method)
Bhadresh V. Savaja, Ashutosh kumar Patidarb, Hashumati A. Rajc
a
Department of quality assurance, shree dhanvantry Pharmacy College, Kim, Surat. b
Department of pharmaceutical chemistry, shree dhanvantry Pharmacy College, Kim, Surat. c
Department of Quality assurance, shree dhanvantry Pharmacy College, Kim, Surat.
Abstract:
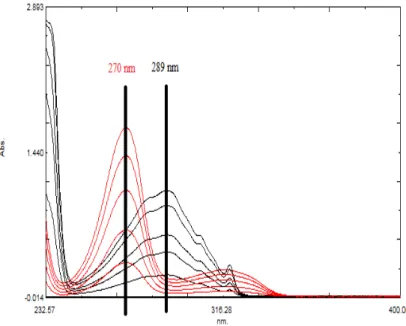
A new spectrophotometric method was developed for simultaneous determination of compounds with interfering spectra in binary mixtures without previous separation, showing significant advantages over the conventional methods regarding minimal data manipulation and applicability. The proposed method was applied for the determination of Propranolol hydrochloride and Hydrochlorothiazide in Tablets formulation, for determination of sampling wavelength, 10 μg/ml of each of PRO and HCT were scanned in 200-400 nm range and sampling wavelengths were 289 nm for PRO and 270 nm for HCT are selected for development and validation of simultaneous equation method. For this method linearity observed in the range of 10-50 μg/ml for PRP and 5-25 μg/ml for HCT, and in their pharmaceutical formulation with mean percentage recoveries 100.13± 0.86 and 100.07± 0.58, respectively. The method was validated according to ICH guidelines and can be applied for routine quality control testing.
Keywords: Spectroscopic method, simultaneous equation method, propranolol hydrochloride and hydrochlorothiazide.
1. Introduction
Many methods have been introduced for the analysis of binary mixtures among which the spectrophotometric based methods were the most simple, fast and applicable in almost all laboratories. Several manipulations were performed on the raw overlapping spectral data to enable mixture resolution for example, using different order derivatives [1-11].The aim of the present work was to develop a new simple, rapid, selective method for the simultaneous determination of components having overlapping spectra in binary mixtures, having the advantages of minimal data processing and a wider range of applications over the previously mentioned methods. To prove the ability of the newly described method in resolving the overlapping spectral data and simultaneous determination of each component, it was applied for the analysis of a mixture of propranolol hydrochloride (PRO) and hydrochlorothiazide (HCT) formulated together in the form of tablets widely used for the treatment of heart related problems accompanying several hypertension.
Fig.1 (A) is Structure of propranolol hydrochloride and (B) is structure of Hydrochlorothiazide.
1.1. Theory
We can find out concentration of both the drug from combination mixture using the simultaneous equation method. In this method using the absorbance of both the drug and mixture at their wavelength and put this value in following equation and we can find out the concentration of drugs present in combination.
Cx = (A2 × Ay1) – (A1 × Ay2)
--- --- (1)
(Ay1 × Ax2) – (Ay2 × Ax1)
Cy = (A1 × Ax2) – (A2 × Ax1)
--- --- (2) (Ax2 × Ay1) – (Ax1 × Ay2)
Where,
Cx = Concentration of drug X
Cy = Concentration of drug
A1 = Absorbanceof mixture at wavelength 1
A2 = Absorbance of mixture at wavelength 2
Ax1 = Absorptivity of drug A at wavelength 1
Ax2 = Absorptivity of drug A at wavelength 2
Ay1 = Absorptivity of drug B at wavelength 1
Ay2 = Absorptivity of drug B at wavelength 2
2. Material and method 2.1. Apparatus
A double beam UV/Visible spectrophotometer (Shimadzu model 2450, Japan) with spectral width of 2 nm, 1 cm quartz cells was used to measure absorbance of all the solutions. Spectra were automatically obtained by UV-Probe system software.
2.2. Reference samples
PRO and HCT reference standard are kindly supply by CIPLA LTD, Mumbai and CTX Life Science, Surat as a gift sample respectively.
2.3. Pharmaceutical formulation
Cipler-H tablet, labelled to contain 40 mg PRO and 20 mg HCT, manufactured by Cipla Ltd.
2.4. Materials and reagents
Methanol AR grade (RANKEM)
2.5. Standard solutions
2.5.1. Standard solution of Propranolol HCl (PRO)
10µ g/ml, HCT 0.5µ g/ml.
2.5.4. Test Sample Preparation
Dissolve tablet sample in 100 ml volumetric flask containing 100 ml methanol. Take 1 ml tablet sample solution in 10 ml volumetric flask and make up volume up to mark with methanol.
2.6. Procedures 2.6.1. Construction of calibration curves (linearity)
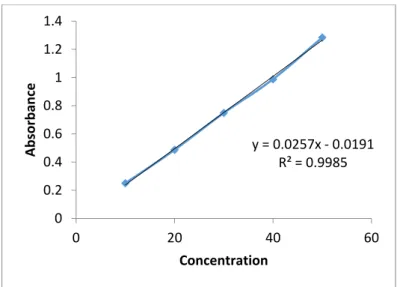
This series consisted of five concentrations of standard PRO solution ranging from 10-50 μg/ml. The solutions were prepared by pipetting out standard PRO stock solution (1ml, 2ml, 3ml, 4ml, 5ml) was transferred into a series of 10 ml volumetric flasks and volume was adjusted up to mark with Methanol. A zero order spectra of the resulting solutions were recorded, measured the absorbance at 289.0nm against a reagent blank solution (Methanol). Calibration curve was prepared by plotting absorbance versus respective concentration of PRO. This series consisted of five concentrations of standard HCT solution ranging from 5-25 μg/ml. The solutions were prepared by pipetting out Standard HCT stock solution (0.5ml, 12ml, 1.5ml, 2ml, and 2.5ml) was transferred into a series of 10 ml volumetric flasks and volume was adjusted up to mark with Methanol. A zero order spectra of the resulting solutions were recorded and measured the absorbance at 270 nm against a reagent blank solution (Methanol). Calibration curve was prepared by plotting absorbance versus respective concentration of HCT.
Fig. 3 calibration curve of propranolol hydrochloride
Fig. 4 calibration curve of hydrochlorothiazide
2.6.2. Analysis of laboratory-prepared mixtures.
Laboratory-prepared mixtures containing different ratios of PRO and HCT were prepared. By applying the procedure under linearity, absorbance at 289.0 nm was recorded for PRO and 270.0 nm were recorded for HCT. The concentration of each drug in each mixture was calculated from its corresponding Cx and Cy equation. Validity of the method was assessed by spiking the pharmaceutical formulation by known amounts of standard drug powders (standard addition technique). The recovery of the added standards was then calculated after applying the proposed method.
2.6.3. Application of the proposed method for the simultaneous determination of PRO and HCT in Cipler – H tablet
Take one tablet and dissolved into a 100-ml beaker and sonicated in 100 ml methanol for 15 min, filtered into 100- ml volumetric flask. The residue was washed three times each using 10 ml methanol and completed to the mark with the same solvent. Transfer accurately 1 ml of the extracted solution into a 10-ml measuring flask. One millilitres of PRO working solution (20 µg/ml) equivalent to 40 µg PRO was added and completed to the mark with methanol. The general procedure under linearity was followed.
3. Results and discussion
The absorbance wavelength for PRO and HCT found to be 289 and 270 nm, respectively, which is different and hence non-overlapping. Thus simultaneous determination of PRO and HCT in bulk mixture-I and tablet solution-I was found to be successful by simultaneous equation.
y = 0.0257x ‐0.0191
R² = 0.9985
0 0.2 0.4 0.6 0.8 1 1.2 1.4
0 20 40 60
Absorbance
Concentration
y = 0.0947x ‐0.0454
R² = 0.9979
0 0.5 1 1.5 2 2.5
0 10 20 30
Absorbance
mathematical transformation, proportional to the concentration of analyte. Linearity of the method was determined at five concentration levels for PRO and HCT independently.
3.3. Accuracy
The accuracy of an analytical method is the closeness of the test results to the true value. It was tested by spiking standard PRO solution in different concentration 80, 100 and 120% to a tablet solution. The tablet solution was analyzed at 289 nm for estimation of PRO. Similarly, the accuracy for HCT was determined at 270 nm, respectively.
3.4. Precision
The intra-day precision (repeatability) of method was determined by measuring the absorbance of tablet solution-I at 289 and 270 nm for PRO and HCT, respectively. Within a laboratory over a short period of time. The inter-day precision (intermediate precision) was determined by measuring the absorbance of tablet solution-I at 289 and 270 nm for PRO and HCT, respectively. Within a laboratory on three consecutive days, by different analysts. The %RSD was calculated for intra and inter-day precision.
3.5. LOD and LOQ
The LOD of an analytical method is the lowest amount of analyte in a sample which can be detected but not necessarily quantified. The detection limit (DL) of method was determined by equation, DL = (3.3 σ)/S, where, σ– standard deviation of blank response, S– slope of the calibration curve. The quantitation limit (QL) of analyte was determined by equation DL = (10 σ)/S, where, σ– standard deviation of blank response, S– slope of the calibration curve
3.6. Robustness and ruggedness
Robustness and ruggedness of the method has been evaluated at two different levels i.e. change in stock solution and changing the instrument.
4. Analysis of commercial tablets
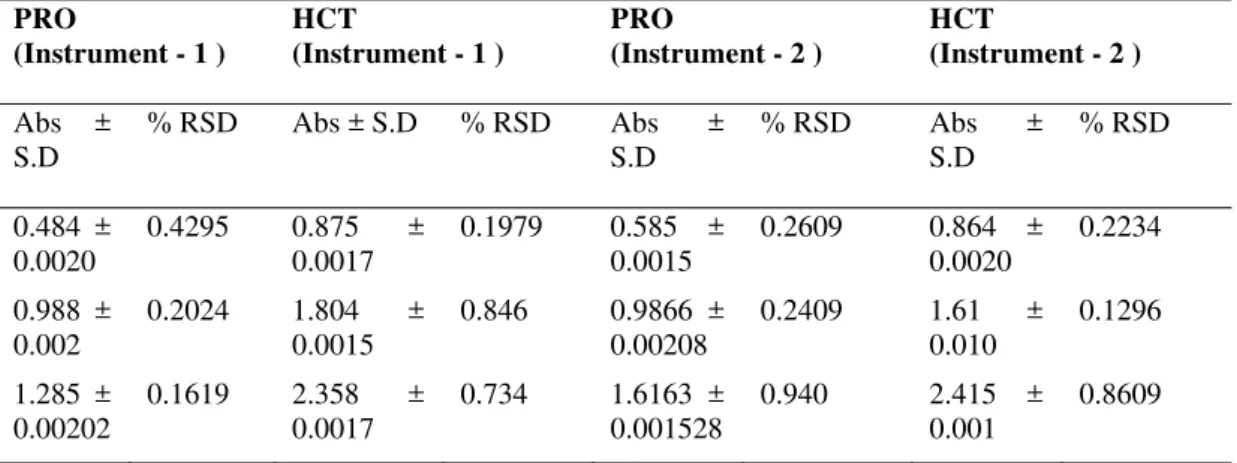
The proposed method was successfully applied to the analysis of both mixtures in their pharmaceutical preparations. Results obtained were precise and in good agreement with the labelled claim as concluded from the satisfactory values of % recovery and RSD (%) gathered in table 2 and 3. Proposed method is precise and accurate, and give same result in same day and between the day and this data is gathered in table 1. When we change in standard stock concentration or changed the instrument that time also this proposed method give good result this data also gathered in table 4 and 5.
Table 1: Inter day and intraday precision data for propranolol and hydrochlorothiazide in three different concentration ranges.
Analyte Nominal Value
(µg/Ml)
Within Day Between Day
Found ± SD(µg/Ml) %RSD Found ± SD(µg/Ml) %RS D
PRO 10 9.82 ± 0.01 0.1133 10.24 ± 0.0662 0.6465
20 19.32 ± 0.07 0.4041 20.29 ± 0.0724 0.3579
30 29.58 ± 0.087 0.3156 30.54 ± 0.0566 0.3646
HCT 5 4.96 ± 0.04 0.8064 5.15 ± 0.04836 0.9106
10 9.9690 ± 0.049 0.51 10.12 ± 0.006 0.680
Table 2: Accuracy data for propranolol hydrochloride with % recovery and % RSD
Concentration of PRO from formulation (µg/ml) Amount of PRO spiked (µg/ml) Total amount (µg/ml) Amount found (µg/ml) % recovery
S.D % RSD
40 8 48 48.2234 100.46 0.001 0.955
40 10 50 50.9428 100.88 0.00577 0.650
40 12 52 51.1872 101.43 0.00095 0.947
Table 3: Accuracy data for hydrochlorothiazide with % recovery and % RSD
Concentration of HCT from formulation (µg/ml) Amount of HCT spiked (µg/ml) Total amount (µg/ml) Amount found (µg/ml) % recovery
S.D % RSD
20 4 24 25.223 100.89 0.005292 0.5245
20 5 25 24.5388 100.15 0.00500 0.4994
20 6 26 26.3041 101.17 0.00095 0.6712
Table 4: Robustness and ruggedness data into that change in stock concentration in that concentration of stock – 1 is 100 µg/ml and concentration of stock – 2 is 500 µg/ml.
PRO
(Stock 100 µg/ml )
HCT
(Stock 100 µg/ml )
PRO
(Stock 500 µg/ml )
HCT
(Stock 500 µg/ml )
Abs ± S.D
% RSD Abs ± S.D % RSD Abs ± S.D
% RSD Abs ± S.D
% RSD
0.484 ± 0.0020
0.4295 0.875 ±
0.0017
0.1979 0.4953 ± 0.001525
0.3053 0.776 ±
0.00173
0.2408
0.988 ± 0.002
0.20240 1.804 ± 0.0015
0.846 0.9066 ±
0.002082
0.2295 1.605 ±
0.00202
0.6212
1.285 ± 0.00202
0.1619 2.358 ±
0.0017
0.734 1.414 ±
0.0015
0.1079 2.950 ±
0.02569
0.414
Table 5: Robustness and ruggedness data into that change in instrument used, in that instrument 1 and 2 are used.
PRO
(Instrument - 1 )
HCT
(Instrument - 1 )
PRO
(Instrument - 2 )
HCT
(Instrument - 2 )
Abs ± S.D
% RSD Abs ± S.D % RSD Abs ± S.D
% RSD Abs ± S.D
% RSD
0.484 ± 0.0020
0.4295 0.875 ± 0.0017
0.1979 0.585 ± 0.0015
0.2609 0.864 ±
0.0020
0.2234
0.988 ± 0.002
0.2024 1.804 ± 0.0015
0.846 0.9866 ±
0.00208
0.2409 1.61 ±
0.010
0.1296
1.285 ± 0.00202
0.1619 2.358 ± 0.0017
0.734 1.6163 ±
0.001528
0.940 2.415 ±
0.001
5 Inter day precision 0.35 – 0.64 0.35-0.91 6 Accuracy (%recovery ±
SD) 100.2624 ± 0.00486 100.0697 ± 0.006764
7 LOD (µg/ml) 0.089 0.036
8 LOQ (µg/ml) 0.90 0.50
9 Robustness and
ruggedness
0.16 – 0.42 0.19-0.84
5. Conclusion
A novel, simple, rapid and sensitive method is proposed for the analysis of two binary mixtures with overlapping spectra. The method involves the generation of absorbance spectra followed by measurement of the absorbance. The proposed method does not require any sophisticated mathematical treatment for the absorption data, and it exhibits several advantages over other spectrophotometric methods for resolution of binary mixtures. The applicability of the developed method was evaluated through the determination of both drug combinations in several laboratory-prepared mixtures and in pharmaceutical tablets with good accuracy and precision. Therefore, the presented methodology is adequate for the routine quality control analysis of these fixed-dose combinations.
Conflict of interest
The authors confirm that this article content has no conflict of interest.
Acknowledgements
Declared none.
References
[1] S. Altinos, D. J. Tekeli. Analysis of glimepiride by using derivative UV spectrophotometric method, Pharm. Biomed. Anal., 2011, 24:
507.
[2] J. Chaudhary, A. Jain, V. Saini, Analytical Method Development and Validation for the Simultaneous estimation of Alprazolam and
Propranolol in their combined dosage form. Int. J. Drug Delivery., 2012, 4: 310-315.
[3] S. J. Daharwal, Development and Validation of UV Spectrophotometric Method for Simultaneous Estimation of Diazepam and
Propranolol in Bulk Drug and Its Formulations. Asian J. Pharm. Ana., 2013, 3: 20-23.
[4] M. Suman, N. C. Rao, S. K. Kumar, P. Venkateswarlu, Development of Simple Spectrophotometric Method for the Determination of
Propranolol using p-Chloranilic acid in Bulk and Dosage forms. Res. J. Pharm. Bio. Chem. Sci., 2013, 4: 342-346.
[5] N. A. Shivarkar, P. B. Dudhe, M. A. Nagras, K. S. Jain, Simultaneous Estimation of Flunarizine dihydrochloride and Propranolol
hydrochloride in Bulk Drug and Capsule. Int. J. ChemTech Res., 2012, 4: 1007-1012.
[6] K. S. Rao, M. Panda, N. Keshar, Spectrophotometric methods for the simultaneous estimation of losartan potassium and
hydrochlorothiazide in tablet dosage forms. Chronicles of Young Scientists., 2011, 2: 155-159.
[7] N. S. Abdelwahab, Spectrophotometric methods for simultaneous determination of Carvedilol and Hydrochlorothiazide in combined
dosage form. Arabian J. Chem., 2011, (in press)
[8] M. C. Ferraro, P. M. Castellano, T. S. Kaufman, Simultaneous determination of amiloride hydrochloride and hydrochlorothiazide in
synthetic samples and pharmaceutical Formulations by multivariate analysis of spectrophotometric data. J. Pharm. Biomed. Anal., 2002, 30: 1121-1131.
[9] T. S. Belala, N. Hoda, G. Daabeesb, M. A. Khalekb, M. S. Mahrousb, M. M. Khamis, New simple spectrophotometric method for
determination of the binary mixtures (atorvastatin calcium and ezetimibe; candesartan cilexetil and hydrochlorothiazide) in tablets. J. Pharm. Anal., 2013, 3: 118–126.
[10] N. M. Bhatia, R. B. Desai, S. D. Jadhav, simultaneous estimation of losartan potassium and hydrochlorothiazide from tablets by first
order derivative spectroscopy. Int. J. Pharm Pharm. Sci., 2013, 5: 231-235.
[11] V. R. Galande, K. G. Baheti, S. Indraksha, M. H. Dehghan, Estimation of Amlodipine Besylate, Valsartan and Hydrochlorothiazide in
Bulk Mixture and Tablet by UV Spectrophotometry. Indian J. Pharm. Sci., 2012, 74: 18-23.
[12] Indian Pharmacopoeia, the Indian Pharmacopoeia Commission, Ghaziabad, Govt. of India Ministry of Health and Family Welfare,
2010, vol. III, 1987.
[13] K.D. Tripathi , Essentials of Medical Pharmacology, Sixed Ed., Jaypee Brother’s Medical Publishers (P) LTD, st Louis, 2008.
[14] Indian Pharmacopoeia, the Indian Pharmacopoeia Commission, Ghaziabad, Govt. of India Ministry of Health and Family Welfare,
2010, vol. II, 1451.