Ciência Rural, v.48, n.3, 2018.
Number of experiments for adaptability and stability
analysis in maize by Lin and Binns method
Número de experimentos para a análise de adaptabilidade e estabilidade em milho pelo método de Lin e Binns Alberto Cargnelutti Filho1* José Paulo Guadagnin2
ISSNe 1678-4596
Received 02.27.17 Approved 12.11.17 Returned by the author 02.01.18
INTRODUCTION
In the final stage of a plant breeding program, it is important to evaluate the cultivars agronomic performance in different environments (locations, years and seasons). The cultivars may have differential behavior according to the environmental variations. This differential behavior is attributed to the genotypes x environment interaction. In the presence of this interaction, it is appropriate to carry out analyzes of adaptability and stability, to ensure greater safety
indications of cultivars (CRUZ & REGAZZI, 1997; CRUZ & CARNEIRO, 2003).
The choice of the methodology of adaptability and stability analysis, which provides higher security regarding the cultivars indication, depends on the number of environments available, the precision required and the type of information desired (CRUZ & REGAZZI, 1997; CRUZ & CARNEIRO, 2003). Comparisons among methodologies of adaptability and stability analysis, based on the maize grain yield, have been performed by SCAPIM et al. (2000),
1Departamento de Fitotecnia, Centro de Ciências Rurais (CCR), Universidade Federal de Santa Maria (UFSM), 97105-900, Santa Maria, RS,
Brasil. E-mail: [email protected]. *Corresponding author.
2Engenheiro Agrônomo, Pesquisador Aposentado da Fundação Estadual de Pesquisa Agropecuária (FEPAGRO), Rua Alfredo Chaves, 243,
Veranópolis, RS, Brasil.
ABSTRACT: The objective of this study was to determine the necessary number of experiments to analyze the adaptability and stability of maize cultivars (Zea mays L.) using the Lin and Binns method. Grain yield data extracted from 63 maize cultivar trials were used. Trials were divided in six groups of experiments, according to the cycle (early and super early) and the agricultural year (2002/2003, 2003/2004, and 2004/2005). In each group, from the set of all experiments (reference file) new data files were formed by combinations in groups of 2, 3, 4, ..., n-1 experiments, with a total of 10,683 files. For each file, the estimation of the adaptability and stability parameter (Pi) of the Lin and Binns method was calculated. To verify the degree of association of the estimates of Pi obtained with the combinations of experiments and with all the experiments (reference), Spearman correlation coefficient (r) was used. Number of experiments giving values of r≥0.80 in 100% of the combinations was considered sufficient. Seven experiments sufficed for the analysis of adaptability and stability of maize cultivars by the method of Lin and Binns.
Key words: Zea mays, genotype x environment interaction, cultivar indication.
RESUMO: O objetivo deste trabalho foi determinar o número necessário de experimentos para a análise de adaptabilidade e estabilidade de cultivares de milho (Zea mays L.) por meio do método de Lin e Binns. Foram usados os dados de produtividade de grãos de 63 ensaios de competição de cultivares de milho. Os ensaios foram divididos em seis grupos de experimentos, conforme o ciclo (precoce e superprecoce) e o ano agrícola (2002/2003, 2003/2004 e 2004/2005). Em cada grupo, a partir do conjunto de todos os experimentos (arquivo referência), formaram-se novos arquivos de dados por meio de combinações em grupos de 2, 3, 4, ..., n-1 experimentos do grupo, totalizando 10.683 arquivos. Para cada arquivo foi calculada a estimativa do parâmetro de adaptabilidade e estabilidade (Pi) do método de Lin e Binns. Para verificar o grau de associação das estimativas de Pi obtidas com as combinações de experimentos e com todos os experimentos (referência), foi utilizado o coeficiente de correlação de Spearman (r). Considerou-se como suficiente o número de experimentos que proporciona valores de r≥0,80 em 100% das combinações. Sete experimentos foram suficientes para a análise de adaptabilidade e estabilidade de cultivares de milho por meio do método de Lin e Binns.
Palavras-chave: Zea mays, interação genótipos x ambientes, indicação de cultivares.
MURAKAMI et al. (2004), CARGNELUTTI FILHO et al. (2007), CARGNELUTTI FILHO et al. (2009a), SCHMILDT et al. (2011) and OLIVEIRA et al. (2013). Generally, in these studies, the focus was to evaluate the concordance/discordance among the methodologies, as well as the cultivars indication.
Theoretical foundations concerning the appropriate number of environments for experimentation for the study of genotypes x environment interaction were discussed by RESENDE (1998). Conversely, applied studies, i.e., studies based on data from experiments for evaluation of bean cultivars have been developed with the purpose of determining the necessary number of experiments for cultivars comparison (CARGNELUTTI FILHO et al., 2006), cluster (CARGNELUTTI FILHO et al., 2009b) and path analysis (CARGNELUTTI FILHO et al., 2011). Optimal number of trials for the prediction of grain yield of wheat genotypes aimed for selection and recommendation of cultivars was studied by BENIN et al. (2014).
Definition of the necessary number of experiments (environments) for the analysis of adaptability and stability, is important to ensure that the estimates are reliable. Methodologies based on analysis of variance can be applied with a smaller number of environments (minimum of three environments) when for example, the methodologies based on regression analysis are compared (CRUZ & REGAZZI, 1997). An efficient method of adaptability and stability analysis, based on non-parametric statistics, is the LIN & BINNS (1988) (MURAKAMI et al., 2004). More details of this methodology are described in CRUZ & CARNEIRO (2003). The same lacks of studies on the required number of environments. It is supposed that few environments may be insufficient to generate reliable estimates and many environments can mean unnecessary investments, because the gains in precision of the estimates may be negligible.
The objective of this study was to determine the necessary number of experiments (environments) to analyze the adaptability and stability of maize cultivars (Zea mays L.) using the Lin and Binns
method, based on the grain yield.
MATERIALS AND METHODS
Grain yield data, at 13% of moisture, of 63 trials (experiments or environments) to compare maize cultivars (Zea mays L.), carried out in the state of Rio
Grande do Sul were used in this study. The experiments belonged to the state category. In this category the cultivars were those not indicated to farmers yet. Experiments were classified into six groups according
to the cycle (early and very early) and the agricultural year (2002/03, 2003/04 and 2004/05). Thus, the groups were formed: early - 2002/2003 (P3) with 36 cultivars and 10 environments; early - 2003/2004 (P4) with 40 cultivars and 11 environments; early - 2004/2005 (P5) with 32 cultivars and 10 environments; super early - 2002/2003 (SP3) with 11 cultivars and 9 environments; super early - 2003/2004 (SP4) with 9 cultivars and 12 environments; and super early - 2004/2005 (SP5) with 17 cultivars and 11 environments (Table 1). In all experiments, the random block design with three replications and plot consisting of two rows with 5m in length, spaced at 0.8m were used.
The variance joint analysis of the grain yield was performed, in each group of experiments, considering cultivars with fixed effect and environments as random. The selective accuracy
(SA) was estimated by the expression: SA=(1-1/F)0.5
(RESENDE & DUARTE, 2007). The value of the F test to cultivar (F) was calculated by the expression: F=MSG/MSGE, where MSG is the mean square to
cultivar and MSGE is the mean square of the interaction
cultivar x environment (CRUZ, 2013).
For the study, the necessary number of experiments for analysis of adaptability and stability, in each group, the following data files were organized: groups P3 and P5, a file formed with the 10 experiments (reference) and the other by a combination of 10 experiments in groups of two (45), three (120), four (210), five (252), six (210), seven (120), eight (45) and nine (10) experiments, with a total of 1,013 files in each group; groups P4 and SP5, a file formed with the 11 experiments (reference) and the other by a combination of 11 experiments in groups of two (55), three (165), four (330), five (462), six (462), seven (330), eight (165), nine (55) and ten (11) experiments, with a total of 2,036 files in each group; group SP3, a file formed with the 9 experiments (reference) and the other by a combination of 9 experiments in groups of two (36), three (84), four (126), five (126), six (84), seven (36) and eight (9) experiments, totaling 502 files; and group SP4, a file formed with the twelve experiments (reference) and the other by a combination of twelve experiments in groups of two (66), three (220), four (495), five (792), six (924), seven (792), eight (495), nine (220), ten (66) and eleven (12) experiments, with a total of 4,083 files.
cultivar i, being more stable to cultivate with lower value of Pi; Yij is the grain yield of the i-th cultivar in the j-th environment (experiment); Mj is the maximum response of grain yield among all cultivars in the environment j; n is the number of environments (CRUZ & CARNEIRO, 2003).
In each group of experiments, the Pi values, obtained with all experiments were used as a reference. To verify the degree of association among the estimates of Pi obtained with combinations de 2, 3, 4, ..., n experiments with estimates of Pi obtained with all experiments (reference) the Spearman correlation coefficient (r) was used. The following values 1013, 2036, 1013, 502, 4083 and 2036r were calculated; respectively, for the groups P3, P4, P5, SP3, SP4 and SP5. Values of r equal to 1.00 and -1.00; respectively, indicated full concordance and total discordance of the classificatory positions between two variables. Thus, the closer to 1.00 for the estimate of r the greater the concordance in the classification of cultivars based on Pi.
In each group of experiments, the following statistics was calculated: minimum, maximum,
amplitude, mean, percentile 25, median, percentile
75 and asymmetry of the Spearman correlation coefficient (r) among the combinations of 2, 3, 4, ..., n experiments. Then, the number was counted and the percentage of cases (combinations) was calculated in which r was greater than or equal to 0.70, 0.75, 0.80, 0.85, 0.90, 0.95 and 1. It is desirable to find the number of experiments in which all r values are equal to 1. This means that the Pi values of the number of experiments in relation to all experiments (reference group) would be concordant. Upon not existing this situation, to define the number of experiments, it is possible to establish a lower level of concordance. Thus, it was considered as sufficient the number of experiments that provides values of r≥0.80, in 100% of cases. Statistical analyzes were performed using the program Genes (CRUZ, 2013) and with the application Microsoft Office Excel®.
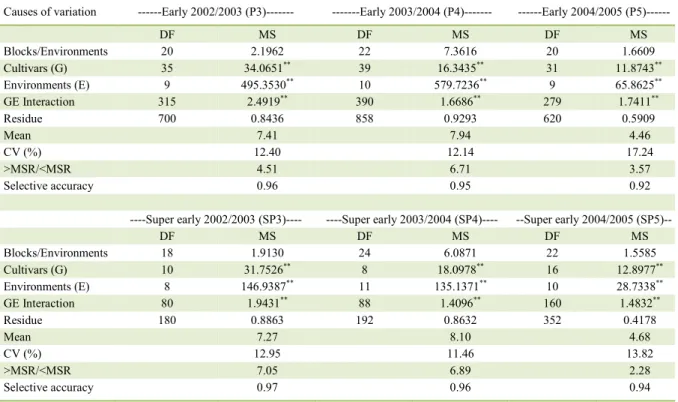
Table 1 - Variance jointanalysis,degreesoffreedom(DF) and significanceof the mean square(MS)of the sourcesof variation, in relation to grain yield, in t ha-1, mean, coefficientof variation (CV),relationshipbetween the largest and the smallestresidual
mean square among the environments (>MSR/<MSR) and selectiveaccuracyofsixgroupsofmaizeexperiments.
Causesof variation ---Early 2002/2003 (P3)--- ---Early 2003/2004 (P4)--- ---Early 2004/2005 (P5)---
DF MS DF MS DF MS
Blocks/Environments 20 2.1962 22 7.3616 20 1.6609
Cultivars(G) 35 34.0651** 39 16.3435** 31 11.8743**
Environments(E) 9 495.3530** 10 579.7236** 9 65.8625**
GE Interaction 315 2.4919** 390 1.6686** 279 1.7411**
Residue 700 0.8436 858 0.9293 620 0.5909
Mean 7.41 7.94 4.46
CV (%) 12.40 12.14 17.24
>MSR/<MSR 4.51 6.71 3.57
Selective accuracy 0.96 0.95 0.92
----Super early 2002/2003 (SP3)---- ----Super early 2003/2004 (SP4)---- --Super early 2004/2005 (SP5)--
DF MS DF MS DF MS
Blocks/Environments 18 1.9130 24 6.0871 22 1.5585
Cultivars(G) 10 31.7526** 8 18.0978** 16 12.8977**
Environments(E) 8 146.9387** 11 135.1371** 10 28.7338**
GE Interaction 80 1.9431** 88 1.4096** 160 1.4832**
Residue 180 0.8863 192 0.8632 352 0.4178
Mean 7.27 8.10 4.68
CV (%) 12.95 11.46 13.82
>MSR/<MSR 7.05 6.89 2.28
Selective accuracy 0.97 0.96 0.94
RESULTS AND DISCUSSION
Relationship between the largest and the smallest residual mean square of environments ranged between the groups of 2.28 (SP5) to 7.05 (SP3) (Table 1). When this relationship is lower than seven, CRUZ & REGAZZI (1997) established that the residual variances are homogeneous. Due to the proximity to this value, the group SP3 (>MSR/<MSR=7.05) was also considered as homogeneous regarding the residual variances, which allows the joint analysis performing. There was cultivar x environment interaction (p<0.01) for grain yield, in the six groups of experiments (Table 1). The interaction shows differentiated behavior of cultivars in environments, and thus, the indication of cultivars, through the analysis of the adaptability and stability, is a proper procedure. Values of
selective accuracy (SA) were equal to or higher than 0.92. Thus, it can be inferred that the experimental precision was very high (SA≥0.90), according to RESENDE & DUARTE (2007).
Spearman’s correlation coefficient (r) among the estimates of Pi obtained with combinations of 2, 3, 4, ..., n experiments and estimates of Pi obtained with all experiments (reference) oscillated between r = 0.10 to 1.00, indicating different levels of concordance (Tables 2 and 3). The closer to 1.00 for the estimate of r the greater the concordance in the classification of cultivars based on Pi. Generally, the default behavior of r was similar in the 6 groups of experiments (P3, P4, P5, SP3, SP4 and SP5), showing the same trends, differing slightly, concerning the magnitude of the concordances. The minimum and maximum
Table 2 - Minimum, maximum, amplitude, mean, percentile 25 (P25), median, percentile 75 (P75) and asymmetry of the Spearman
correlation coefficient (r) among the estimates of the parameter of adaptability and stability(Pi) of LIN &BINNS (1988) obtained at the combinations of 2, 3, 4, ..., n experimentswith Pi of all the experiments (reference). Grain yield data of maize cultivars of early cycle evaluated in the agricultural years of 2002/2003, 2003/2004 and 2004/2005.
Experiments Combinations Minimum Maximum Amplitude Mean P25 Median P75 Asymmetry
---Early cycle group - agricultural year 2002/2003 (P3), n=10 experiments---
2 45 0.633 0.924 0.290 0.833 0.807 0.854 0.881 -1.099
3 120 0.691 0.968 0.277 0.884 0.860 0.894 0.914 -1.249
4 210 0.785 0.973 0.188 0.916 0.901 0.920 0.939 -1.140
5 252 0.838 0.984 0.146 0.939 0.924 0.942 0.956 -0.758
6 210 0.909 0.991 0.082 0.957 0.944 0.960 0.970 -0.420
7 120 0.925 0.993 0.067 0.971 0.963 0.972 0.982 -0.723
8 45 0.955 0.997 0.042 0.982 0.975 0.985 0.988 -0.851
9 10 0.977 0.999 0.022 0.992 0.989 0.993 0.996 -1.407
10 1 1.000 1.000 0.000 1.000 1.000 1.000 1.000 -
---Early cycle group - agricultural year 2003/2004 (P4), n=11 experiments---
2 55 0.511 0.893 0.383 0.759 0.687 0.773 0.832 -0.621
3 165 0.639 0.935 0.296 0.824 0.787 0.827 0.876 -0.612
4 330 0.728 0.957 0.229 0.868 0.839 0.874 0.902 -0.576
5 462 0.776 0.967 0.191 0.899 0.878 0.905 0.923 -0.613
6 462 0.839 0.977 0.137 0.923 0.908 0.925 0.943 -0.569
7 330 0.872 0.981 0.109 0.943 0.929 0.945 0.958 -0.548
8 165 0.906 0.988 0.081 0.959 0.948 0.961 0.972 -0.610
9 55 0.935 0.991 0.056 0.972 0.965 0.974 0.983 -0.704
10 11 0.965 0.995 0.031 0.984 0.982 0.985 0.992 -1.004
11 1 1.000 1.000 0.000 1.000 1.000 1.000 1.000 -
---Early cycle group - agricultural year 2004/2005 (P5), n=10 experiments---
2 45 0.479 0.919 0.439 0.758 0.709 0.794 0.843 -1.019
3 120 0.555 0.937 0.382 0.831 0.807 0.846 0.876 -1.325
4 210 0.649 0.965 0.316 0.877 0.857 0.888 0.912 -1.350
5 252 0.747 0.978 0.231 0.910 0.888 0.919 0.940 -1.010
6 210 0.837 0.982 0.146 0.936 0.921 0.943 0.959 -1.004
7 120 0.870 0.989 0.120 0.956 0.944 0.961 0.975 -1.185
8 45 0.910 0.994 0.084 0.971 0.964 0.977 0.984 -1.548
9 10 0.953 0.997 0.044 0.985 0.983 0.988 0.993 -2.182
values, average, percentile 25, median and percentile 75 of r, showed an increase with the increase in the number of experiments and the amplitude showed a decrease, both with a trend to stabilize. This pattern of behavior, as expected, reflects greater concordance with the reference (all experiments) as the number of experiments is increased.
However, this increase of concordance occurs in a non-linear manner, that is by increasing gradually from two experiments to the total group experiments (n), significant increases are noted and then gradual reduction of these increases. For example, considering the early group in the agricultural year 2002/2003 (P3), it is observed that the average r
of 45 combinations of two experiments was 0.833. Whereas the average of 120 combinations of three experiments was 0.884. It means that when going from 2 to 3 experiments there was an increase of 6.12% in concordance of Pi. Following this reasoning, increases were observed of 3.62%, 2.51%, 1.92%, 1.46%, 1.13%, 1.02% and 0.81%, shifting from 3 to 4, 4 to 5, 5 to 6, 6 to 7, 7 to 8, 8 to 9 and 9 to 10 experiments, respectively (Table 2). This behavior pattern of r was observed in the other five groups (Tables 2 and 3). Therefore, from the effect of a certain number of experiments the gain in the classification of the stability of the cultivars becomes increasingly smaller (inexpressive), being possible to Table 3 - Minimum, maximum, amplitude, mean, percentile 25 (P25), median, percentile 75 (P75) and asymmetry of the Spearman
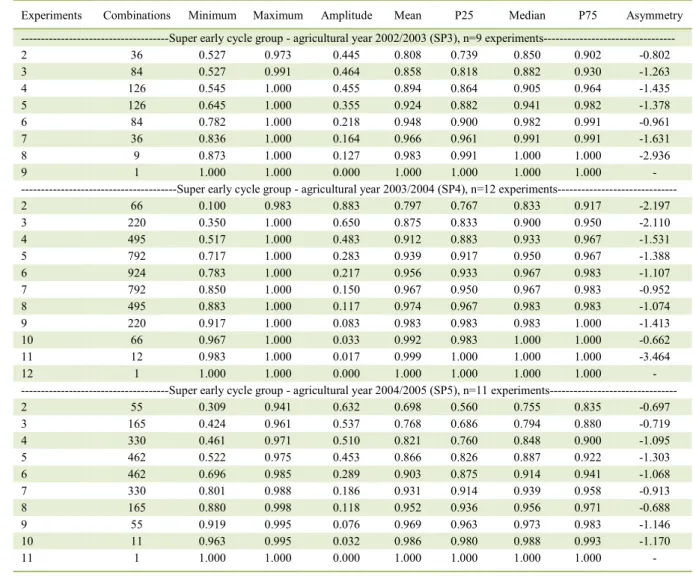
correlation coefficient (r) among the estimates of the parameter of adaptability and stability(Pi) of LIN &BINNS (1988) obtained at the combinations of 2, 3, 4, ..., n experimentswith Pi of all the experiments (reference). Grain yield data of maize cultivars of super early cycle evaluated in the agricultural years of 2002/2003, 2003/2004 and 2004/2005.
Experiments Combinations Minimum Maximum Amplitude Mean P25 Median P75 Asymmetry
---Super early cycle group - agricultural year 2002/2003 (SP3), n=9 experiments---
2 36 0.527 0.973 0.445 0.808 0.739 0.850 0.902 -0.802
3 84 0.527 0.991 0.464 0.858 0.818 0.882 0.930 -1.263
4 126 0.545 1.000 0.455 0.894 0.864 0.905 0.964 -1.435
5 126 0.645 1.000 0.355 0.924 0.882 0.941 0.982 -1.378
6 84 0.782 1.000 0.218 0.948 0.900 0.982 0.991 -0.961
7 36 0.836 1.000 0.164 0.966 0.961 0.991 0.991 -1.631
8 9 0.873 1.000 0.127 0.983 0.991 1.000 1.000 -2.936
9 1 1.000 1.000 0.000 1.000 1.000 1.000 1.000 -
---Super early cycle group - agricultural year 2003/2004 (SP4), n=12 experiments---
2 66 0.100 0.983 0.883 0.797 0.767 0.833 0.917 -2.197
3 220 0.350 1.000 0.650 0.875 0.833 0.900 0.950 -2.110
4 495 0.517 1.000 0.483 0.912 0.883 0.933 0.967 -1.531
5 792 0.717 1.000 0.283 0.939 0.917 0.950 0.967 -1.388
6 924 0.783 1.000 0.217 0.956 0.933 0.967 0.983 -1.107
7 792 0.850 1.000 0.150 0.967 0.950 0.967 0.983 -0.952
8 495 0.883 1.000 0.117 0.974 0.967 0.983 0.983 -1.074
9 220 0.917 1.000 0.083 0.983 0.983 0.983 1.000 -1.413
10 66 0.967 1.000 0.033 0.992 0.983 1.000 1.000 -0.662
11 12 0.983 1.000 0.017 0.999 1.000 1.000 1.000 -3.464
12 1 1.000 1.000 0.000 1.000 1.000 1.000 1.000 -
---Super early cycle group - agricultural year 2004/2005 (SP5), n=11 experiments---
2 55 0.309 0.941 0.632 0.698 0.560 0.755 0.835 -0.697
3 165 0.424 0.961 0.537 0.768 0.686 0.794 0.880 -0.719
4 330 0.461 0.971 0.510 0.821 0.760 0.848 0.900 -1.095
5 462 0.522 0.975 0.453 0.866 0.826 0.887 0.922 -1.303
6 462 0.696 0.985 0.289 0.903 0.875 0.914 0.941 -1.068
7 330 0.801 0.988 0.186 0.931 0.914 0.939 0.958 -0.913
8 165 0.880 0.998 0.118 0.952 0.936 0.956 0.971 -0.688
9 55 0.919 0.995 0.076 0.969 0.963 0.973 0.983 -1.146
10 11 0.963 0.995 0.032 0.986 0.980 0.988 0.993 -1.170
define the number of experiments for the analysis of adaptability and stability.
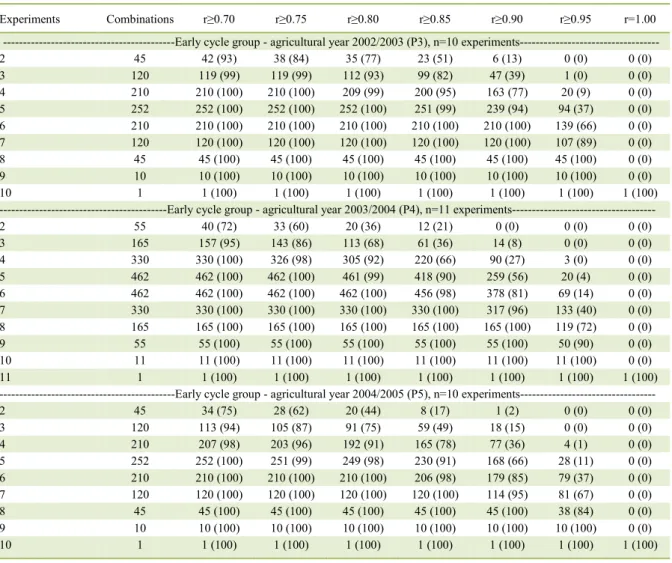
In the group of 10 experiments of early cycle in the agricultural year 2002/2003, in 42 of the 45 combinations of two experiments the Spearman’s correlation coefficient (r) was ≥0.70, that is, in 93% of all the cases (Table 4). Percentage of 100% was obtained with 4, 4, 5, 6, 5 and 7 experiments, for the groups P3, P4, P5, SP3, SP4 and SP5, respectively. This percentage of 100% is appropriate. However, greater magnitude of association (higher score of r, preferably equal to 1.00) should be pursued. However, the acquisition of 100% of the cases with r=1.00 (perfect concordance), was only possible with the set of all experiments (reference)
(Tables 4 and 5). Alternatively, the option to take a lower level of concordance (example: r≥0.80) makes it possible to determine the number of experiments. Thus, upon assuming as sufficient the number of experiments that provides 100% of the cases with values of r≥ 0.80, it was observed that 5, 6, 6, 7, 7 and 7 experiments are sufficient, for the groups P3, P4, P5, SP3, SP4 and SP5, respectively. So, it can be inferred that seven experiments are enough for the analysis of adaptability and stability of maize cultivars. A similar number of experiments was established by CARGNELUTTI FILHO et al. (2006), CARGNELUTTI FILHO et al. (2009b), CARGNELUTTI FILHO et al. (2011) and BENIN et al. (2014).
Table 4 - Number of combinations and respective percentage, between parentheses, in which theSpearmans correlation coefficient (r)
among the estimates of the parameter of adaptability and stability(Pi) of LIN & BINNS (1988) obtained at the combinations of 2, 3, 4, ..., n experimentswith Pi of all the experiments (reference), was greater than or equal to 0.70, 0.75, 0.80, 0.85, 0.90,
0.95 and 1.00. Grain yield data of maize cultivars of early cycle evaluated in the agricultural years of 2002/2003, 2003/2004 and 2004/2005.
Experiments Combinations r≥0.70 r≥0.75 r≥0.80 r≥0.85 r≥0.90 r≥0.95 r=1.00
---Early cycle group - agricultural year 2002/2003 (P3), n=10 experiments---
2 45 42 (93) 38 (84) 35 (77) 23 (51) 6 (13) 0 (0) 0 (0)
3 120 119 (99) 119 (99) 112 (93) 99 (82) 47 (39) 1 (0) 0 (0)
4 210 210 (100) 210 (100) 209 (99) 200 (95) 163 (77) 20 (9) 0 (0)
5 252 252 (100) 252 (100) 252 (100) 251 (99) 239 (94) 94 (37) 0 (0)
6 210 210 (100) 210 (100) 210 (100) 210 (100) 210 (100) 139 (66) 0 (0)
7 120 120 (100) 120 (100) 120 (100) 120 (100) 120 (100) 107 (89) 0 (0)
8 45 45 (100) 45 (100) 45 (100) 45 (100) 45 (100) 45 (100) 0 (0)
9 10 10 (100) 10 (100) 10 (100) 10 (100) 10 (100) 10 (100) 0 (0)
10 1 1 (100) 1 (100) 1 (100) 1 (100) 1 (100) 1 (100) 1 (100)
---Early cycle group - agricultural year 2003/2004 (P4), n=11 experiments---
2 55 40 (72) 33 (60) 20 (36) 12 (21) 0 (0) 0 (0) 0 (0)
3 165 157 (95) 143 (86) 113 (68) 61 (36) 14 (8) 0 (0) 0 (0)
4 330 330 (100) 326 (98) 305 (92) 220 (66) 90 (27) 3 (0) 0 (0)
5 462 462 (100) 462 (100) 461 (99) 418 (90) 259 (56) 20 (4) 0 (0)
6 462 462 (100) 462 (100) 462 (100) 456 (98) 378 (81) 69 (14) 0 (0)
7 330 330 (100) 330 (100) 330 (100) 330 (100) 317 (96) 133 (40) 0 (0)
8 165 165 (100) 165 (100) 165 (100) 165 (100) 165 (100) 119 (72) 0 (0)
9 55 55 (100) 55 (100) 55 (100) 55 (100) 55 (100) 50 (90) 0 (0)
10 11 11 (100) 11 (100) 11 (100) 11 (100) 11 (100) 11 (100) 0 (0)
11 1 1 (100) 1 (100) 1 (100) 1 (100) 1 (100) 1 (100) 1 (100)
---Early cycle group - agricultural year 2004/2005 (P5), n=10 experiments---
2 45 34 (75) 28 (62) 20 (44) 8 (17) 1 (2) 0 (0) 0 (0)
3 120 113 (94) 105 (87) 91 (75) 59 (49) 18 (15) 0 (0) 0 (0)
4 210 207 (98) 203 (96) 192 (91) 165 (78) 77 (36) 4 (1) 0 (0)
5 252 252 (100) 251 (99) 249 (98) 230 (91) 168 (66) 28 (11) 0 (0)
6 210 210 (100) 210 (100) 210 (100) 206 (98) 179 (85) 79 (37) 0 (0)
7 120 120 (100) 120 (100) 120 (100) 120 (100) 114 (95) 81 (67) 0 (0)
8 45 45 (100) 45 (100) 45 (100) 45 (100) 45 (100) 38 (84) 0 (0)
9 10 10 (100) 10 (100) 10 (100) 10 (100) 10 (100) 10 (100) 0 (0)
In the study of CARGNELUTTI FILHO et al. (2006), the authors concluded that seven experiments allow the identification of superior cultivars of beans, with 85% of accuracy. Seven and six experiments were considered sufficient to identify divergent bean cultivars, by cluster of Ward and Tocher, respectively (CARGNELUTTI FILHO et al., 2009). Still, CARGNELUTTI FILHO et al. (2011) defined that seven experiments are sufficient for the path analysis in bean cultivars. BENIN et al. (2014) concluded that the optimum number of experiments for the prediction of grain yield of wheat, with an accuracy of 80%, ranged between 8 and 14. RESENDE (1998)
emphasized that there is no reason to use more than nine experiments, for the selection based on averages. A smaller number, i.e., three experiments ensured reliable calibration/validation of the CROPGRO-Soybean model (FENSTERSEIFER et al., 2017).
In this study, it was demonstrated that the greater the number of experiments, the greater the concordance with the set of experiments used as reference. However, the gains in concordance decreases gradually with the increase of the number of experiments. Thus, seven experiments (environments) can be taken as a reference for studies of adaptability and stability of maize cultivars through the Lin and Binns’ method, Table 5 - Number of combinations and respective percentage, between parentheses, in which theSpearmans correlation coefficient (r)
among the estimates of the parameter of adaptability and stability(Pi) of LIN & BINNS (1988) obtained at the combinations of 2, 3, 4, ..., n experimentswith Pi of all the experiments (reference), was greater than or equal to 0.70, 0.75, 0.80, 0.85, 0.90,
0.95 and 1.00. Grain yield data of maize cultivars of super early cycle evaluated in the agricultural years of 2002/2003, 2003/2004 and 2004/2005.
Experiments Combinations r≥0.70 r≥0.75 r≥0.80 r≥0.85 r≥0.90 r≥0.95 r=1.00
---Super early cycle group - agricultural year 2002/2003 (SP3), n=9 experiments---
2 36 28 (77) 26 (72) 22 (61) 18 (50) 11 (30) 2 (5) 0 (0)
3 84 74 (88) 72 (85) 67 (79) 60 (71) 38 (45) 16 (19) 0 (0)
4 126 121 (96) 116 (92) 112 (88) 98 (77) 72 (57) 43 (34) 3 (2)
5 126 124 (98) 120 (95) 119 (94) 113 (89) 85 (67) 57 (45) 5 (3)
6 84 84 (100) 84 (100) 83 (98) 80 (95) 65 (77) 52 (61) 7 (8)
7 36 36 (100) 36 (100) 36 (100) 34 (94) 32 (88) 28 (77) 8 (22)
8 9 9 (100) 9 (100) 9 (100) 9 (100) 8 (88) 8 (88) 5 (55)
9 1 1 (100) 1 (100) 1 (100) 1 (100) 1 (100) 1 (100) 1 (100)
---Super early cycle group - agricultural year 2003/2004 (SP4), n=12 experiments---
2 66 56 (84) 52 (78) 43 (65) 28 (42) 24 (36) 9 (13) 0 (0)
3 220 209 (95) 201 (91) 192 (87) 152 (69) 115 (52) 56 (25) 1 (0)
4 495 491 (99) 483 (97) 473 (95) 421 (85) 343 (69) 196 (39) 7 (1)
5 792 792 (100) 789 (99) 784 (98) 762 (96) 678 (85) 438 (55) 30 (3)
6 924 924 (100) 924 (100) 923 (99) 918 (99) 876 (94) 658 (71) 77 (8)
7 792 792 (100) 792 (100) 792 (100) 792 (100) 785 (99) 656 (82) 108 (13)
8 495 495 (100) 495 (100) 495 (100) 495 (100) 494 (99) 444 (89) 90 (18)
9 220 220 (100) 220 (100) 220 (100) 220 (100) 220 (100) 214 (97) 62 (28)
10 66 66 (100) 66 (100) 66 (100) 66 (100) 66 (100) 66 (100) 37 (56)
11 12 12 (100) 12 (100) 12 (100) 12 (100) 12 (100) 12 (100) 11 (91)
12 1 1 (100) 1 (100) 1 (100) 1 (100) 1 (100) 1 (100) 1 (100)
---Super early cycle group - agricultural year 2004/2005 (SP5), n=11 experiments---
2 55 34 (61) 29 (52) 23 (41) 13 (23) 4 (7) 0 (0) 0 (0)
3 165 119 (72) 107 (64) 78 (47) 55 (33) 26 (15) 3 (1) 0 (0)
4 330 284 (86) 259 (78) 220 (66) 163 (49) 81 (24) 16 (4) 0 (0)
5 462 443 (95) 423 (91) 379 (82) 311 (67) 186 (40) 33 (7) 0 (0)
6 462 461 (99) 461 (99) 437 (94) 397 (85) 283 (61) 81 (17) 0 (0)
7 330 330 (100) 330 (100) 330 (100) 321 (97) 272 (82) 118 (35) 0 (0)
8 165 165 (100) 165 (100) 165 (100) 165 (100) 157 (95) 100 (60) 0 (0)
9 55 55 (100) 55 (100) 55 (100) 55 (100) 55 (100) 47 (85) 0 (0)
10 11 11 (100) 11 (100) 11 (100) 11 (100) 11 (100) 11 (100) 0 (0)
because they provided similar results to the set of all experiments (reference). However, before generalizing this information, further studies with this focus are suggested, involving more methodologies of adaptability and stability analysis and more scenarios formed by the combination of different numbers of cultivars, number of repetitions and number of experiments in the culture of maize and other crops. In practical terms, in the final phase of a plant breeding program, when planning a network for the evaluation of cultivars, it is important to establish a number of experiments (environments) to generate enough reliability in the conclusions. It is important to consider that few experiments may lead to greater uncertainty and many experiments can be time-consuming and financially unviable.
CONCLUSION
Seven experiments (environments) are sufficient to analyze the adaptability and stability of maize cultivars (Zea mays L.) through the Lin and
Binns’ method, based on grain yield.
ACKNOWLEDGEMENTS
The authors thank the researchers who helped carry out the experiments. To the Conselho Nacional de Desenvolvimento Científico e Tecnológico (CNPq), for granting the ‘Productivity in Research’ grant to Alberto Cargnelutti Filho.
REFERENCES
BENIN, G. et al. Optimum number of wheat trials in different growing regions. Ciência Rural, v.44, p.247-252, 2014.
Available from: <http://www.scielo.br/scielo.php?script=sci_artt ext&pid=S0103-84782014000200009>. Accessed: Jan. 08, 2018.
doi: 10.1590/S0103-84782013005000152.
CARGNELUTTI FILHO, A. et al. Association between adaptability and stability methods in corn. Ciência Rural, v.39,
p.340-347, 2009a. Available from: <http://www.scielo.br/scielo. php?script=sci_arttext&pid=S0103-84782009000200005>. Accessed: Jan. 08, 2018. doi: 10.1590/S0103-84782008005000080.
CARGNELUTTI FILHO, A. et al.Comparison of adaptability and stability methods related to grain yield of maize cultivars. Bragantia,
v.66, p.571-578, 2007. Available from: <http://www.scielo.br/ scielo.php?script=sci_arttext&pid=S0006-87052007000400006>. Accessed: Jan. 08, 2018. doi: 10.1590/S0006-87052007000400006.
CARGNELUTTI FILHO, A. et al. Number of necessary experiments for the cluster analysis in common bean cultivars. Ciência Rural,
v.39, p.371-378, 2009b. Available from: <http://www.scielo.br/ scielo.php?script=sci_arttext&pid=S0103-84782009000200009>. Accessed: Jan. 08, 2018. doi: 10.1590/S0103-84782008005000059.
CARGNELUTTI FILHO, A. et al. Number of necessary experiments for the comparison in common bean cultivars. Ciência Rural,
v.36, p.1701-1709, 2006. Available from: <http://www.scielo.br/
scielo.php?script=sci_arttext&pid=S0103-84782006000600006>. Accessed: Jan. 08, 2018. doi: 10.1590/S0103-84782006000600006.
CARGNELUTTI FILHO, A. et al. Number of necessary experiments for the path analysis in common bean. Ciência Rural, v.41, p.564-572,
2011. Available from: <http://www.scielo.br/scielo.php?pid=S0103-84782011000400003&script=sci_abstract&tlng=pt>. Accessed: Jan.
08, 2018. doi: 10.1590/S0103-84782011005000036.
CRUZ, C.D. GENES - a software package for analysis in experimental statistics and quantitative genetics. Acta Scientiarum Agronomy,
v.35, p.271-276, 2013. Available from: <http://www.scielo.br/scielo. php?pid=S1807-86212013000300001&script=sci_abstract&tlng=pt>. Accessed: Jan. 08, 2018. doi: 10.4025/actasciagron.v35i3.21251.
CRUZ, C.D.; CARNEIRO, P.C.S. Modelos biométricos aplicados ao melhoramento genético. Viçosa: UFV, 2003. v.2. 585 p.
CRUZ, C.D.; REGAZZI, A.J. Modelos biométricos aplicados ao melhoramento genético. 2.ed. Viçosa: UFV, 1997. 390p.
FENSTERSEIFER, C.A. et al. On the number of experiments required to calibrate a cultivar in a crop model: The case of CROPGRO-soybean.
Field Crops Research, v.204, p.146-152, 2017. Available from: <https://
www.sciencedirect.com/science/article/pii/S0378429017300709>. Accessed: Jan. 08, 2018. doi: 10.1016/j.fcr.2017.01.007.
LIN, C.S.; BINNS, M.R. A superiority measure of cultivar performance for cultivar x location data. Canadian Journal of Plant Science, v.68, p.193-198, 1988.
MURAKAMI, D.M. et al. Some considerations about two methodologies for stability and adaptability analysis. Ciência Rural,
v.34, p.71-78, 2004. Available from: <http://www.scielo.br/scielo. php?pid=S0103-84782004000100011&script=sci_abstract&tlng=pt>. Accessed: Jan. 08, 2018. doi: 10.1590/S0103-84782004000100011.
OLIVEIRA, R.B.R. et al. Adaptability and stability of maize landrace varieties. Semina: Ciências Agrárias, v.34, p.2555-2564, 2013.
Available from: <http://www.uel.br/revistas/uel/index.php/semagrarias/ article/viewFile/10379/13680>. Accessed: Jan. 08, 2018. doi:
10.5433/1679-0359.2013v34n6p2555.
RESENDE, M.D.V. Genotype x environment interaction and adequate number of trials based on the Snedecor statistics (F) from joint analysis of variance. Boletim de Pesquisa Florestal, p.55-66, 1998. Available
from: <https://ainfo.cnptia.embrapa.br/digital/bitstream/CNPF-2009-09/4954/1/mresende.pdf>. Accessed: Jan. 08, 2018.
RESENDE, M.D.V.; DUARTE, J.B. Precision and quality control in variety trials. Pesquisa Agropecuária Tropical, v.37,
p.182-194, 2007. Available from: <https://www.revistas.ufg.br/pat/article/ view/1867/1773>. Accessed: Jan. 08, 2018.
SCAPIM, C.A. et al. Yield stability in maize (Zea mays L.) and correlations among the parameters of the Eberhart and Russell, Lin and Binns and Huehn models. Genetics and Molecular Biology,
v.23, p.387-393, 2000. Available from: <http://www.scielo.br/scielo. php?script=sci_arttext&pid=S1415-47572000000200025>. Accessed: Jan. 08, 2018. doi: 10.1590/S1415-47572000000200025.
SCHMILDT E.R. et al. Evaluation of methodologies of adaptability and stability in corn cultivars. Acta Scientiarum Agronomy, v.33, p.51-58,