Adaptability and yield stability of cowpea elite lines of semi-prostrate
growth habit in the cerrado biome
1Adaptabilidade e estabilidade produtiva em linhagens elite de feijão-caupi de porte
semiprostrado no Cerrado brasileiro
Massaine Bandeira e Sousa2, Kaesel Jackson Damasceno-Silva3*, Maurisrael de Moura Rocha3, José Ângelo
Nogueira de Menezes Júnior3 and Laíze Raphaelle Lemos Lima4
ABSTRACT -The effects of the genotype × environment interaction can be reduced by using cultivars with high adaptability and good yield stability. Studies on this subject allow identification of genotypes of predictable behavior, and responsive to environmental variations in specific and general conditions, in favorable or unfavorable environments. The objective of this work was to evaluate the adaptability and phenotypic stability of cowpea elite lines of semi-prostrate growth habit in the Cerrado biome in Brazil. Twenty cowpea genotypes of semi-prostrate growth habit were evaluated in nine VCU (value for cultivation and use) tests from 2010 to 2012. Grain yield data were subjected to analysis of variance, and stability and adaptability analyses were carried out by the methods of Eberhart and Russell (1966), Lin and Binns (1988) (modified), Wricke (1965), and Annicchiarico (1992). The method of Wricke (1965) was not very descriptive, since it indicates only the contribution of each genotype to the genotype × environment interaction. The results obtained by the methods of Lin and Binns (1988) (modified), Annicchiarico (1992) and Eberhart and Russell (1966) were more descriptive, and similar in indicating the most promising cultivar (BRS-Xiquexique) and lines (Pingo-de-Ouro-1-2, 676F-1, MNC01-649F-2-1 and MNC02-677F-2). These lines have potential for the development of new cultivars because they present adaptability and yield stability in the Cerrado biome of Brazil.
Key words:Vigna unguiculata. Genotype × Environment Interaction. Grain yield.
RESUMO - Os efeitos da interação genótipos por ambientes podem ser reduzidos, utilizando-se cultivares com ampla adaptabilidade e boa estabilidade produtiva. O estudo desse tema possibilita a identificação de genótipos de comportamento previsível e que sejam responsivos às variações ambientais, em condições específicas (ambientes favoráveis ou desfavoráveis) ou amplas. Este trabalho foi realizado com o objetivo de avaliar a adaptabilidade e estabilidade fenotípica de linhagens elite de feijão-caupi de porte semiprostrado na região de Cerrado do Brasil. Foram avaliados vinte genótipos de feijão-caupi em nove ensaios VCU (Valor de Cultivo e Uso) de porte semiprostrado, no período de 2010 a 2012. Os dados de produtividade de grãos foram submetidos a análises de variância e em seguida a análises de estabilidade e adaptabilidade pelos métodos de Eberhart e Russell (1966), Lin e Binns (1988) modificado, Wricke (1965) e Annicchiarico (1992). A metodologia de Wricke (1965) demonstrou ser pouco informativa, por indicar apenas a contribuição de cada genótipo para a interação genótipo × ambiente. Os resultados obtidos pelos métodos Lin e Binns (1988) modificado, Annicchiarico (1992) e Eberhart e Russell (1966), foram mais informativos, sendo coincidentes em indicar o cultivar BRS Xiquexique e as linhagens Pingo-de-Ouro-1-2, MNC02-676F-1, MNC01-649F-2-1 e MNC02-677F-2 como os mais promissores. Essas linhagens possuem potencial para lançamento como cultivares, por apresentarem adaptabilidade e estabilidade produtiva na região do cerrado brasileiro.
Palavras-chave:Vigna unguiculata. Interação Genótipos × Ambientes. Produtividade de Grãos.
DOI: 10.5935/1806-6690.20170098 *Autor para correspondência
Recebido para publicação em 29/08/2016; aprovado em 09/01/2017
1Parte da Dissertação de Mestrado do primeiro autor, financiada pela CAPES
INTRODUCTION
Cowpea [Vigna unguiculata (L.) Walp] is cultivated
in the Northeast, North and Center-West regions of Brazil. However, the average productivity of cowpea crops varies greatly among different regions, mainly due to environmental variations and the use of genetic materials that are not very productive or with undesirable characteristics (FREIRE FILHOet al., 2011).
One of the main challenges in genetic improvement of species is to understand genotype × environments interaction (G×E), which is assessed by the evaluation of the genotypes in different environments (CRUZ; CARNEIRO; REGAZZI, 2014). The evaluation of G×E is very important because of the possibilities of genotypes behave differently in different environments due to G×E (RESENDE; DUARTE, 2007). This behavior affects the selection gain and makes it difficult to recommend cultivars with wide adaptability.
Studies on adaptability and stability of plant species provide tools to identify genotypes that present high productivity in different environmental conditions (FIGUEIREDOet al., 2015, PEREIRAet al., 2012). The
adaptability and stability of cowpea genotypes have been the goal of several studies (BARROSet al., 2013; NUNES et al., 2014; ROCHAet al., 2007; SANTOSet al., 2016;
VALADARESet al., 2010). These studies have subsidized
the improvement and release of cultivars in several states of the North, Northeast and Center-West regions of Brazil (FREIRE FILHOet al., 2011).
There are several methods to evaluate the G×E and to determine the adaptability and yield stability of the cultivars. According to the Eberhart and Russell (1966) method, based on simple linear regression, an ideal cultivar presents overall adaptability and stability while maintaining a good performance when the environmental conditions are unfavorable. However, when the data do not fulfill the assumptions of the regression analysis, an alternative would be the use of non-parametric analyzes such as the method of Lin and Binns (1988) (modified) described by Cruz, Carneiro and Regazzi (2014). This method allows the identification of the most stable genotypes by a single parameter of stability and adaptability, and includes the deviations in relation to the maximum yield obtained in each environment; making it possible to detail this information for favorable and unfavorable environments. Other examples are the method of Annicchiarico (1992), which presents an easy application and is based on the estimation of a risk index for the recommendation of a given cultivar; and the method of Wricke (1965), called ecovalence, which is estimated by the distribution of the sum of squares of the G×E into parts due to single genotypes. This method
has an easy interpretation; however, the data need to be balanced to meet the assumptions of a regression analysis (CARVALHOet al., 2016).
Choosing the method to characterize genotypes regarding adaptability and stability depends on the available experimental data, the required precision, and the type of information desired by the breeder (CRUZ; CARNEIRO; REGAZZI, 2014). Each one of these methods has peculiarities that can contribute to improve the analysis; and in some cases, these methods may be complementary to each other, therefore, it is important to use more than one method (PEREIRAet al., 2009). In
this context, the objective of this study was to evaluate the adaptability and phenotypic stability of cowpea elite lines of semi-prostrate growth habit in the Cerrado biome in Brazil.
MATERIAL AND METHODS
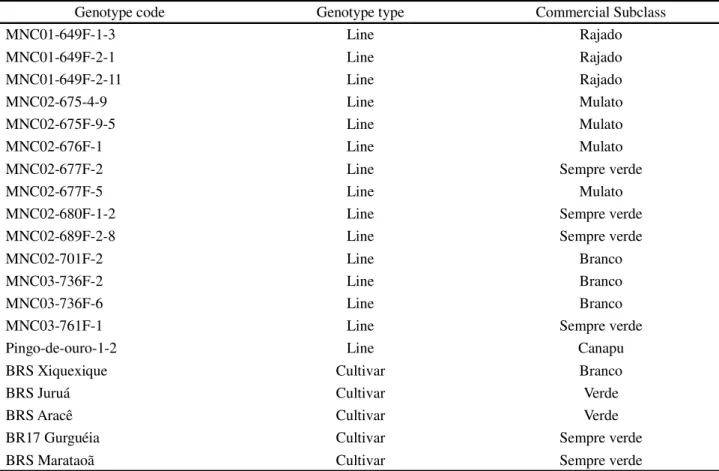
Twenty cowpea genotypes of semi-prostrate growth habit from VCU (value for cultivation and use) tests were evaluated, where fifteen lines were from the Embrapa Mid-North Cowpea Breeding Program and five were commercial cultivars (Table 1). Nine experiments were conducted under rainfed conditions, in the 2010, 2011 and 2012 crop seasons, in three locations: Balsas and São Raimundo das Mangabeiras in the State of Maranhão (MA), and Primavera do Leste in the state of Mato Grosso (MT) (Table 2).
All experiments were conducted in a complete randomized block experimental design with four replications. The randomization was performed individually for each environment. The plots of the experiments consisted of four 5.0-meter rows spaced 0.80 m apart, with 0.25 m between plants, and the evaluation area consisted of the two central rows. Weed, pest and disease control was carried out according to the recommendations for cowpea (FREIRE FILHO; LIMA; RIBEIRO, 2005).
Table 1 - Cowpea genotypes of semi-prostrate growth habit evaluated in nine experiments conducted in Balsas MA, São Raimundo das Mangabeiras MA, and Primavera do Leste MT, in the 2010, 2011 and 2012 crop seasons
Genotype code Genotype type Commercial Subclass
MNC01-649F-1-3 Line Rajado
MNC01-649F-2-1 Line Rajado
MNC01-649F-2-11 Line Rajado
MNC02-675-4-9 Line Mulato
MNC02-675F-9-5 Line Mulato
MNC02-676F-1 Line Mulato
MNC02-677F-2 Line Sempre verde
MNC02-677F-5 Line Mulato
MNC02-680F-1-2 Line Sempre verde
MNC02-689F-2-8 Line Sempre verde
MNC02-701F-2 Line Branco
MNC03-736F-2 Line Branco
MNC03-736F-6 Line Branco
MNC03-761F-1 Line Sempre verde
Pingo-de-ouro-1-2 Line Canapu
BRS Xiquexique Cultivar Branco
BRS Juruá Cultivar Verde
BRS Aracê Cultivar Verde
BR17 Gurguéia Cultivar Sempre verde
BRS Marataoã Cultivar Sempre verde
Table 2 -Geographic coordinates, average annual precipitation and soil class of the sites used for nine experiments conducted in Balsas MA, São Raimundo das Mangabeiras MA, and Primavera do Leste MT, in the 2010, 2011 and 2012 crop seasons
1/Source: www.climate-data.org
Location/State Elevation Latitude (S) Longitude (W) 1/ Average annual precipitation Soil
Balsas MA 324 m 07º54’ 45º96’ 1190 mm Oxisol
São Raimundo das Mangabeiras MA 511 m 06º53’ 45º39’ 1157 mm Oxisol Primavera do Leste MT 636 m 15°33’ 54°17’ 1784 mm Oxisol
the mean error and the G×E were adjusted according to the method of Cochran (1954). The Scott-Knott test at 5% probability was used to identify the existence of homogeneous groups, by minimizing the variation within, and maximizing between groups.
The evaluation of genotype adaptability and stability was performed using the following methods: Eberhart and Russell (1966), Lin and Binns (1988) (modified) (CRUZ; CARNEIRO; REGAZZI, 2014), Wricke (1965) and Annicchiarico (1992).
In the method of Eberhart and Russell (1966), the adaptability was given by the estimation of the parameterβ1i
and by the average yieldβ0i; and the stability by the variance
of the regression deviations δij, according to the following
modelYij=β0i+ β1iIj+ δij +Ʃij, where:Yij is the average grain
yield (kg ha-1) of genotypei in environmentj;β
0i is the overall
mean;β1i is the linear regression coefficient; Ij is the environmental index; δij is the variance of the regression
deviations; and Ʃij is the mean experimental error.
According to the method of Lin and Binns (1988) (modified) described by Cruz, Carneiro and Regazzi (2014), the decomposition of Pi in the parts
equation: , where:P
i is the estimation of the
adaptability and stability of the genotype i; Yij is the
yield of the genotypei in the environment j; M
j is the
maximum observed response among all genotypes in the
j environment; and α is the number of environments.
In the Annicchiarico method (1992), the confidence indexIi was calculated for the favorable and unfavorable
environments according to the equation: Ii = Ȳi - Z(1-α)Si,
whereinȲi is the overall mean of genotypei in percentage;
Z is the percentile (1-α) of the cumulative normal distribution function; α is the level of significance; and
Si is the standard deviation of the percentage values. The
coefficient of confidence was 75%, i.e., α = 0.25.
The stability parameter proposed by Wricke (1965) was estimated using the statistic ωi, through the equation: ωi= rƩfĜA2IJ = rƩf(Yij - Ȳi.- Ȳ.i +Ȳ..)
2, where: Y
ij is the mean of the genotypei in the environmentj;Ȳi. is the mean
of genotypei;Ȳ.i is the mean of the environmentj; andȲ..
is the overall mean.
The individual and joint analysis of variance, and tests of comparison of means, stability and adaptability were performed using the software GENES (CRUZ, 2013).
RESULTS AND DISCUSSION
The genotypes presented significant differences (p<0.05) by the analysis of individual variances, in all
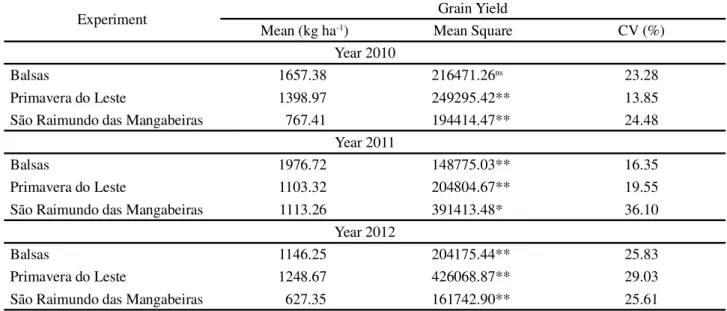
Table 3 - Individual analysis of variance of the grain yield (GY) of 20 cowpea genotypes of semi-prostrate growth habit evaluated in nine experiments conducted in Balsas MA, São Raimundo das Mangabeiras MA, and Primavera do Leste MT, in the 2010, 2011 and 2012 crop seasons
** = significant at 1% probability; * = significant at 5% probability; andns = not significant by the F test; CV = coefficient of variation (%)
environments, except Balsas in 2010 (Table 3). This result denotes genetic variability among the genotypes evaluated, which is essential to proceed with the genotype selection process.
The coefficient of variation (CV) of the experiments evaluated ranged from 13.85 to 36.10% (Table 3). The means and CV of the tests varied, denoting the different conditions to which the genotypes were subjected. The coefficient of variation (CV) is an estimate of the experimental error of the overall mean of the test, and an indication of the experimental accuracy. According to Pimentel-Gomes (2000), observed CV can be classified as low (lower than 10%), average (10% to 20%), high (20% to 30%), and very high (higher than 30%). The CV values found in this work were within the range found in other studies on cowpea, such as Barroset al. (2013), Benvindo et al. (2010), Bertini, Teófilo and Dias (2009), and Silva
and Neves (2011).
The joint analysis of variance showed significant differences (p<0.01) for the sources of variation of
environments, genotypes, and G×E (Table 4). The significant effect of the G×E indicates the different response of the genotypes to the environments, thus requiring analyzes of adaptability and phenotypic stability.
The grain yield of the genotypes presented homogeneous groups by the Scott-Knott test (p<0.05)
(Table 5). The edaphoclimatic conditions of São Raimundo das Mangabeiras MA, affected the performance of the genotypes, decreasing their productive performance.
Experiment Grain Yield
Mean (kg ha-1) Mean Square CV (%) Year 2010
Balsas 1657.38 216471.26ns 23.28
Primavera do Leste 1398.97 249295.42** 13.85
São Raimundo das Mangabeiras 767.41 194414.47** 24.48 Year 2011
Balsas 1976.72 148775.03** 16.35
Primavera do Leste 1103.32 204804.67** 19.55
São Raimundo das Mangabeiras 1113.26 391413.48* 36.10 Year 2012
Balsas 1146.25 204175.44** 25.83
Primavera do Leste 1248.67 426068.87** 29.03
Table 4 - Joint analysis of variance of the grain yield (kg ha-1) of 20 cowpea genotypes of semi-prostrate growth habit evaluated
in nine experiments conducted in Balsas MA, São Raimundo das Mangabeiras MA, and Primavera do Leste MT, in the 2010, 2011 and 2012 crop seasons
** = significant at 1% probability, and * = significant at 5% probability by the F test; CV = coefficient of variation (%);1/ DF adjusted by the
method described by Cochran (1954)
Source of Variation DF Mean Square
Block/Environment 27 231841.49
Environment (E) 8 13829048.67**
Genotypes (G) 19 685650.21**
G×E 1131/ 254147.92**
Residual 3661/ 120566.11
Mean (kg ha-1) 1226.59
CV (%) 28.30
Genotypes Mean1/ Eberhart and Russell Wricke
β2/
1i Wi Wi(%) σ23/di R2(%)
BRS Xiquexique 1451.20 a 0.83ns 1402892 4.88 23235* 75
MNC02-701F-2 1439.61 a 1.39** 2404072 8.37 32845* 88
MNC02-675-4-9 1324.23 b 1.11ns 2253794 7.85 56209** 76 MNC02-677F-5 1323.40 b 1.27* 1577257 5.49 20179ns 88
MNC02-676F-1 1308.84 b 0.88ns 699581 2.44 656ns 87
Pingo-de-ouro-1-2 1299.41 b 0.80ns 902563 3.14 3119ns 84 MNC01-649F-1-3 1298.85 b 1.05ns 1628026 5.67 36047* 79 MNC01-649F-2-11 1282.84 b 0.70* 2174646 7.57 38410** 62 MNC02-675F-9-5 1243.80 b 0.72* 1225799 4.27 6783ns 78 MNC01-649F-2-1 1241.37 b 0.83ns 647764 2.26 4041ns 89 MNC02-677F-2 1239.02 b 1.19ns 1326516 4.62 18648ns 87
BRS Marataoã 1233.84 b 1.33** 2127175 7.41 32685* 87
MNC02-689F-2-8 1219.27 b 1.18ns 687196 2.39 -3592ns 94
MNC03-761F-1 1211.27 b 0.73* 1128896 3.93 4692ns 80
MNC03-736F-2 1183.71 b 1.22ns 1030329 3.59 5523ns 92 BR17 Gurguéia 1141.99 c 1.01ns 871283 3.03 9559ns 87 MNC02-680F-1-2 1131.18 c 0.78ns 1183909 4.12 11901ns 79 MNC03-736F-6 1087.52 c 1.41** 1912348 6.66 12679ns 92
BRS Aracê 1031.32 c 0.80ns 1653783 5.76 29855* 71
BRS Juruá 839.15 d 0.70* 1880888 6.55 27992* 66
Overall Mean 1226.60 28718716 100
** = significant at 1% probability; * = significant at 5% probability; andns = not significant by the t test;1/Means followed by the same letter belong
to the same class (p≤ 0.05);2/H
0: β1i = 1;3/H0: σ2di = 0
Regarding the average grain yield, the line MNC02-701F-2 (1451.MNC02-701F-20 kg ha-1) and the cultivar BRS-Xiquexique (1439.60 kg ha-1)—both from the branco commercial subclass—stood out from the others, presenting promising yields, with good adaptation to the edaphoclimatic conditions of the cerrado biome in Maranhão. However, the overall average yield found in this study (1226.60 kg ha-1) is lower than the averages found by Teixeira et al. (2010) (1307.00 kg ha-1) and Silva and Neves (2011) (1436.35 kg ha-1) in cowpea crops also in the Cerrado biome.
The regression coefficient (β1i = 1) of the model proposed by Eberhart and Russell (1966), measures the adaptability of the genotypes, and the stability of their behavior is measured by the variance of regression deviations (σ2
di = 0) and by the coefficient of determination (R2). According to Cruz, Carneiro and Regazzi (2012), the R2 assists in the evaluation of stability, when the σ2
di are significant. The lines MNC02-676F-1, MNC01-649F-2-1, MNC02-677F-2 and Pingo-de-Ouro-1-2 presented high grain yields, wide adaptability (β1i = 1), high stability (σ2
di = 0) and coefficient of determination (R2) greater than 84 (Table 5).
In the evaluation using the method of Wricke (1965), the most stable genotypes, those that contributed least to the interaction, were MNC01-649F-2-1, MNC02-689F-2-8, MNC02-676F-1 and Pingo-de-Ouro-1-2 and BR17-Gurguéia (Table 5). However, the results were not very descriptive in detecting stable and adapted genotypes. The limitation of this methodology is that it indicates only the contribution of each genotype to the G×E; thus, it cannot show the performance of the genotypes, requiring complementation by other methodologies of adaptability analysis.
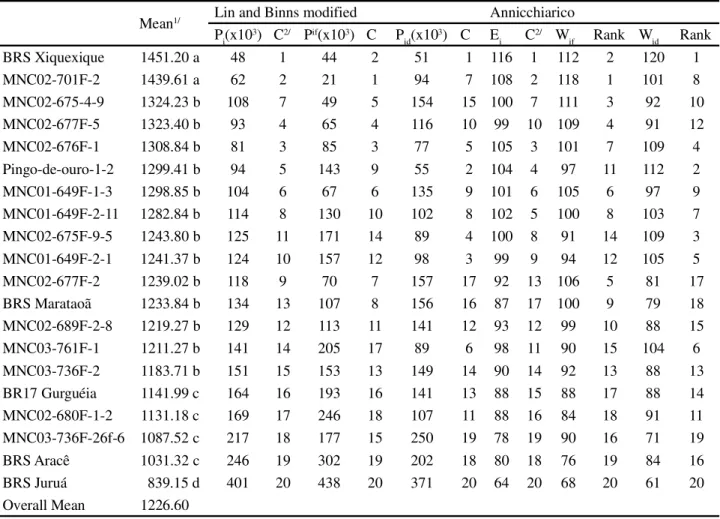
According to the methodology of Lin and Binns (1988) (modified) (CRUZ; CARNEIRO; REGAZZI, 2014), which classifies genotypes for adaptability and phenotypic stability in favorable and unfavorable environments, the most stable genotype is the one that shows the smallest deviation in maximum yield in each environment, i.e., the smallest Pi. Therefore, the lines MNC04-677F-5, MNC02-701F-2 and MNC02-676F-1, and the cultivar BRS-Xiquexique, in addition to presenting the lowest overall Pi, also presented the first positions for the parameters Pi, favorable and unfavorable (Table 6).
The cultivar BRS-Xiquexique was the most stable, the second most responsive to the favorable environments, and the most adapted to unfavorable environments. The line MNC02-701F-2 was the most responsive to the favorable environments. The most stable and adapted genotypes are the most productive ones.
According to Pereira et al. (2009), an advantage
of the method of Lin and Binns (1988) is the immediate identification of more stable genotypes due to the use of the single parameter Pi. Nuneset al. (2014) and Shiringani
and Shimelis (2011) evaluated cowpea crops and found similar results regarding the parameter Pi, thus confirming that the most adapted and stable genotypes always have the highest yields.
According to the method of Annicchiarico (1992), the genotypes BRS-Xiquexique, MNC02-676F-1, MNC02-701F-2, Pingo-de-Ouro-1-2, MNC01-649F-1-3 and MNC01-649F-2-11 were identified with confidence indexes (Wi) greater than 100% (Table 6). The genotypes BRS-Xiquexique, MNC02-701F-2, MNC02-675-4-9, MNC02-677F-5, MNC02-676F-1, MNC01-649F-1-3 and MNC02-677F-2 stood out in favorable environments (Wif); and in unfavorable environments (Wid), 45% of the genotypes surpassed the average of the environments, especially BRS-Xiquexique and Pingo-de-Ouro-1-2.
The Eberhart and Russell (1966) methodology was efficient to indicate genotypes of wide adaptability and high stability, especially the genotypes MNC02-676F-1, MNC01-649F-2-1, MNC02-677F-2 and Pingo-de-Ouro-1-2. This is probably the most appropriate method, since it considers the productivity, adaptability and stability of each cultivar. The genotypes MNC02-676F-1, MNC01-649F-2-1 are among the most stable genotypes, according to methodology of Wricke (1965). This result is similar to that found by Mendes de Paula
et al. (2014), where the methods of Wricke (1965) and
Eberhart and Russell (1966) tended to select the most stable genotypes.
On the other hand, the method based on non-parametric statistics of Lin and Binns (1988) (modified), and the method of Annicchiarico (1992) indicate the genotypes BRS-Xiquexique and MNC02-701F-2 as those that had the highest yields with high instability and responsiveness to favorable environments. This result is an advantage of this method over methods based on analysis of variance. Conversely, Pereira et al. (2009)
Mean1/ Lin and Binns modified Annicchiarico Pi(x103) C2/ Pif(x103) C P
id(x103) C Ei C2/ Wif Rank Wid Rank BRS Xiquexique 1451.20 a 48 1 44 2 51 1 116 1 112 2 120 1 MNC02-701F-2 1439.61 a 62 2 21 1 94 7 108 2 118 1 101 8 MNC02-675-4-9 1324.23 b 108 7 49 5 154 15 100 7 111 3 92 10 MNC02-677F-5 1323.40 b 93 4 65 4 116 10 99 10 109 4 91 12 MNC02-676F-1 1308.84 b 81 3 85 3 77 5 105 3 101 7 109 4 Pingo-de-ouro-1-2 1299.41 b 94 5 143 9 55 2 104 4 97 11 112 2 MNC01-649F-1-3 1298.85 b 104 6 67 6 135 9 101 6 105 6 97 9 MNC01-649F-2-11 1282.84 b 114 8 130 10 102 8 102 5 100 8 103 7 MNC02-675F-9-5 1243.80 b 125 11 171 14 89 4 100 8 91 14 109 3 MNC01-649F-2-1 1241.37 b 124 10 157 12 98 3 99 9 94 12 105 5 MNC02-677F-2 1239.02 b 118 9 70 7 157 17 92 13 106 5 81 17 BRS Marataoã 1233.84 b 134 13 107 8 156 16 87 17 100 9 79 18 MNC02-689F-2-8 1219.27 b 129 12 113 11 141 12 93 12 99 10 88 15 MNC03-761F-1 1211.27 b 141 14 205 17 89 6 98 11 90 15 104 6 MNC03-736F-2 1183.71 b 151 15 153 13 149 14 90 14 92 13 88 13 BR17 Gurguéia 1141.99 c 164 16 193 16 141 13 88 15 88 17 88 14 MNC02-680F-1-2 1131.18 c 169 17 246 18 107 11 88 16 84 18 91 11 MNC03-736F-26f-6 1087.52 c 217 18 177 15 250 19 78 19 90 16 71 19 BRS Aracê 1031.32 c 246 19 302 19 202 18 80 18 76 19 84 16 BRS Juruá 839.15 d 401 20 438 20 371 20 64 20 68 20 61 20 Overall Mean 1226.60
CONCLUSIONS
1. Considering the results obtained by the joint use of the methods Lin and Binns (1988) (modified), Annicchiarico (1992) and Eberhart and Russell (1966) is important for analyses in cowpea, since each one has peculiarities that can contribute to the choice of adapted, stable and productive genotypes;
2. The cultivar BRS-Xiquexique and the lines Pingo-de-ouro-1-2, MNC02-676F-1, MNC01-649F-2-1 and MNC02-677F-2 were considered promising. The lines of the commercial subclassescanapu,mulatto, rajado
and sempre-verde have potential to be released as
commercial cultivars, because they have adaptability and stability for the evaluated environments. The line MNC02-701F-2 presented adaptability and stability for the Cerrado biome, however, it does not have potential
as commercial cultivar, since it does not exceed the cultivar BRS-Xiquexique, both belonging to thebranco
commercial subclass.
REFERENCES
ANNICCHIARICO, P. Cultivar adaptation and recommendation from alfafa trials in Northern Italy.Journal of Genetics and Plant Breeding, v. 46, n. 3, p. 269-278, 1992.
BARROS, M. A.et al. Adaptabilidade e estabilidade produtiva
de feijão-caupi de porte semiprostrado.Pesquisa Agropecuária Brasileira, v. 48, n. 4, p. 403-410, 2013.
BENVINDO, R. N. et al. Avaliação de genótipos de
feijão-caupi de porte semi-prostrado em cultivo de sequeiro e irrigado.
Comunicata Scientiae, v. 1, n. 1, p. 23-28, 2010.
1/Means followed by the same letter belong to the same class (p≤0.05);2/Genotype stability classification.
BERTINI, C. H. C. M.; TEÓFILO, E. M.; DIAS, F. T. C. Divergência genética entre acessos de feijão-caupi do banco de germoplasma da UFC.Revista Ciência Agronômica, v. 40, n. 1, p. 99-105, 2009.
CARVALHO, L. C. B.et al. Evolution of methodology for the
study of adaptability and stability in cultivated species.African Journal of Agricultural Research, v. 11, n. 12, p. 990-1000, 2016.
COCHRAN, W. G. The combination of estimates from different experiments.Biometrics, v. 10, n. 1, p. 101-129, 1954. CRUZ, C. D. Genes: a software package for analysis in experimental statistics and quantitative genetics. Acta Scientiarum Agronomy, v. 35, n. 3, p. 271-276, 2013.
CRUZ, C. D.; CARNEIRO, P. C. S.; REGAZZI, A. J.Modelos biométricos aplicados ao melhoramento genético. 3. ed. Viçosa, MG: UFV, 2014. 668 p. v. 2.
CRUZ, C. D.; REGAZZI, A. J.; CARNEIRO, P. C. S.Modelos biométricos aplicados ao melhoramento genético. 4. ed. Viçosa, MG: UFV, 2012. 514 p. v. 1.
EBERHART, S. A.; RUSSELL, W. A. Stability parameters for comparing varieties.Crop Science, v. 6, n. 1, p. 36-40, 1966.
FIGUEIREDO, U. J. et al. Adaptability and stability of genotypes of sweet sorghum by GGEBiplot and Toler methods.Genetic Molecular Research, v. 14, n. 3, p. 11211-11221, 2015.
FREIRE FILHO, F. R. et al. Feijão-caupi: produção,
melhoramento genético, avanços e desafios. Brasília, DF: Embrapa Informação Tecnológica, 2011. 81 p.
FREIRE FILHO, F. R.; LIMA, J. A. A.; RIBEIRO, V. Q. Feijão-caupi: avanços tecnológicos. Brasília: Embrapa Informação Tecnológica, 2005. 519 p.
LIN, C. S.; BINNS, M. R. A. Superiority measure of cultivar performance for cultivars x location data.Canadian Journal of Plant Science, v. 68, n. 1, p. 193-198, 1988.
MENDES DE PAULA, T. O.et al. Relationships between methods
of variety adaptability and stability in sugarcane. Genetics and Molecular Research, v. 13, n. 2, p. 4216-4225, 2014.
NUNES, H. F. et al. Grain yield adaptability and stability
of blackeyed cowpea genotypes under rainfed agriculture in
Brazil.African Journal of Agricultural Research, v. 9, n. 2, p. 255-261, 2014.
PEREIRA, H. S. et al. Adaptabilidade e estabilidade de
genótipos de feijoeiro-comum com grãos tipo carioca na Região Central do Brasil. Pesquisa Agropecuária Brasileira, v. 44, n. 1, p. 29-37, 2009.
PEREIRA, M. A. B.et al. Adaptability and productive stability
of tomato genotypes in high temperature. Revista Ciência Agronômica, v. 43, n. 2, p. 330-337, 2012.
PIMENTEL-GOMES, F. Curso de estatística experimental. São Paulo: Nobel, 2000. 466 p.
RESENDE, M. D. V.; DUARTE, J. B. Precisão e controle de qualidade em experimentos de avaliação de cultivares.Pesquisa Agropecuária Tropical, v. 37, n. 3, p. 182-194, 2007.
ROCHA, M. M.et al. Adaptabilidade e estabilidade produtiva de genótipos de feijão-caupi de porte semi-ereto na Região Nordeste do Brasil.Pesquisa Agropecuária Brasileira, v. 42, n. 9, p. 1283-1289, 2007.
SANTOS, A. et al. Adaptability and stability of erect cowpea
genotypes via REML/BLUP and GGE Biplot. Bragantia, v. 75, n. 3, p. 299-306, 2016.
SHIRINGANI, R. P.; SHIMELIS, H. A. Yield response and stability among cowpea genotypes at three planting dates and test environment.African Journal of Agricultural Research, v. 6, n. 14, p. 3259-3263, 2011.
SILVA, J. A. L.; NEVES, J. A. Produção de feijão-caupi semi-prostrado em cultivos de sequeiro e irrigado.Revista Brasileira de Ciências Agrárias, v. 6, n. 1, p. 29-36, 2011.
TEIXEIRA, I. T.et al. Desempenho agronômico e qualidade
de sementes de cultivares de feijão-caupi na região do cerrado. Revista Ciência Agronômica, v. 41, n. 2, p. 300-307, 2010.
VALADARES, R. N. et al. Adaptabilidade e estabilidade
fenotípica em genótipos de feijão-caupi (Vigna unguiculata
(L.) Walp.) de porte ereto/semi-ereto nas mesorregiões leste e sul maranhense. Agropecuária Científica no Semi-Árido, v. 6, n. 2, p. 21-27, 2010.