Revista Brasileira de
Engenharia Agrícola e Ambiental
Campina Grande, PB, UAEA/UFCG – http://www.agriambi.com.br
v.22, n.5, p.326-331, 2018
Yield and water use of cherry tomato
under water availability and potassium doses
DOI: http://dx.doi.org/10.1590/1807-1929/agriambi.v22n5p326-331
Adriano B. Pacheco
1, Tonny J. A. da Silva
1, Edna M. Bonfim-Silva
1, Hamilton A. W. Castro
1& Marcio Koetz
1A B S T R A C T
The objective of this study was to evaluate the yield and water use of cherry tomatoes under soil water availability and potassium (K) doses in a greenhouse. The experiment was conducted in randomized blocks in a 52 fractional factorial design, corresponding to five levels of water availability and five K doses, with 13 combinations (4-0; 4-250; 4-500; 14-125; 14-375; 24-0; 24-250; 24-500; 34-125; 34-375; 44-0; 44-250; 44-500) (kPa-mg dm-3) and four replicates. A drip irrigation system with semi-automated irrigation control was used. The analyzed variables were shoot dry matter, number of fruits, yield, water consumption and water use efficiency. Highest cherry tomato yield occurs at soil water tension of 24 kPa and K dose of 290 mg dm-3. Soil water tension of 44 kPa and K dose of 290 mg dm-3 allow for higher water use efficiency in cherry tomato. Cherry tomato yield and water use are influenced by soil water availability and K doses in greenhouse.
Produtividade e uso da água de tomateiro cereja
sob disponibilidades hídricas e doses de potássio
R E S U M O
Objetivou-se avaliar a produtividade e o uso da água do tomateiro cereja em ambiente protegido sob disponibilidades hídricas e doses de potássio. O experimento foi conduzido em casa de vegetação utilizando unidades experimentais de 12 dm3 de volume de solo e com delineamento experimental de blocos casualizados em esquema fatorial fracionado 52, com cinco disponibilidades hídricas e cinco doses de potássio, com 13 combinações (4-0; 4-250; 4-500; 14-125; 14-375; 24-0; 24-250; 24-500; 34-125; 34-375; 44-0; 44-250; 44-500) (kPa mg dm-3) e quatro repetições. Foi utilizado o sistema de irrigação por gotejamento com controle da irrigação semiautomatizado. As variáveis analisadas foram massa seca da parte aérea, número de frutos, produtividade, consumo e eficiência no uso da água. A partir dos modelos de regressão constatou-se que a maior produtividade do tomateiro cereja ocorre na tensão de água no solo de 24 kPa e na dose de potássio de 290 mg dm-3. A tensão de água no solo de 44 kPa e a dose de potássio de 290 mg dm-3 possibilitam maior eficiência no uso da água pelo tomateiro cereja. A produtividade e o uso da água do tomateiro cereja são influenciados pelas disponibilidades hídricas do solo e doses de potássio em ambiente protegido.
Key words:
Lycopersicon esculentum Mill. available water
potassium fertilization
Palavras-chave:
Lycopersicon esculentum Mill. água disponível
adubação potássica
1 Universidade Federal de Mato Grosso/Instituto de Ciências Agrárias e Tecnológicas. Rondonópolis, MT. E-mail: [email protected] - ORCID:
0001-5991-7997; [email protected] - ORCID: 0002-6978-7652; [email protected] (Corresponding author) - ORCID: 0000-0003-1989-8431; [email protected] - ORCID: 0000-0003-0692-0820; [email protected] - ORCID: 0000-0002-7412-532X
Introduction
Tomato (Lycopersicon esculentum Mill.) is one of the main vegetables produced in Brazil, especially the cultivars of the Cherry group, for their characteristic taste, notable aspects in food products and high added value. Cherry tomato plants have good adaptation to various production systems, with lower use of fertilizers and pesticides (Lúcio et al., 2016).
Tomato production systems in protected environment are well consolidated due to the possibilities of microclimatic control. Despite the high initial investment, the protected environment modifies the interactions between the development and production of plants and water use, due to the reduction in global solar radiation incidence and wind, which reduces the evapotranspiration (Reis et al., 2009). Considering also the greater control over the water applied through irrigation, plants in protected environment exhibit, besides higher yield and fruit quality, high water use efficiency (Viol et al., 2017).
Nevertheless, for the planning of production systems in protected environments no recommendations are found in fertilization bulletins considering their particularities. Among the nutrients, potassium (K) stands out as the cation at highest concentration in plants, with relevant physiological and metabolic functions such as enzymatic activation, translocation of assimilates and action in osmotic regulation, contributing to improvements in water use (Taiz & Zeiger, 2013).
Given the above, this study aimed to evaluate the production and water use of cherry tomato in protected environment under water availability levels and K doses.
Material and Methods
The experiment was carried out in greenhouse with adiabatic cooling system, located at the experimental sector of the Institute of Agricultural and Technological Sciences of the Federal University of Mato Grosso, Rondonópolis-MT, Brazil (16° 27' 51" S; 54° 34' 50" W; 284 m). The study was conducted from February to July 2016 and the meteorological conditions inside the greenhouse were: mean temperature of 27.7 ºC, mean relative humidity of 72.6% and mean global solar radiation of 3.98 MJ m-2 d-1.
The experiment was set in randomized blocks, with five water availability levels in the soil (4, 14, 24, 34 and 44 kPa) and five K doses (0, 125, 250, 375 and 500 mg dm-3), in a 5² fractional factorial design, based on the central composite adapted from Littell & Mott (1975), resulting in 13 treatments (4-0; 4-250; 4-500; 14-125; 14-375; 24-0; 24-250; 24-500; 34-125; 34-375; 44-0; 44-250; 44-500) (kPa, mg dm-3), with four replicates, in a total of 52 experimental units.
Soil was collected in a Cerrado area with dystrophic Red Latosol (EMBRAPA, 2013) in the 0-0.2 m layer, and sieved through a 2-mm mesh for chemical and granulometric characterization (EMBRAPA, 1997) and through a 4-mm mesh for liming and settling in the pots.
The soil showed the following results in the chemical and granulometric analyses: pH (CaCl2) = 4.0; P = 1.4 mg dm-3; K = 23 mg dm-3; Ca = 0.4 cmol
c dm
-3; Mg = 0.2 cmol c dm
-3; Al = 0.8 cmolc dm-3; H = 5.4 cmol
c dm
-3; OM = 27.1 g dm-3; SB = 0.7
cmolc dm-3; CEC = 6.8 cmol c dm
-3; V = 9.7%; sand = 423 g kg-1; silt = 133 g kg-1; clay = 444 g kg-1. Liming was performed using dolomitic limestone (80.3% RNV) to increase base saturation to 80%, after a 40-day incubation period.
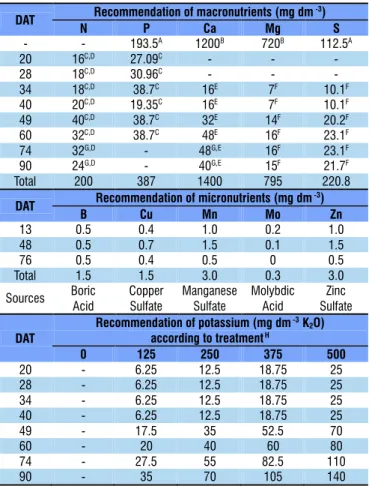
Fertilizations with macro- and micronutrients were adapted from Alvarenga (2013) (Table 1), considering that the soil volume to be explored by the root system would be limited. Thus, all fertilizers recommended were split to avoid possible risks of salinity by fertilization, and nutrients were balanced by using different sources.
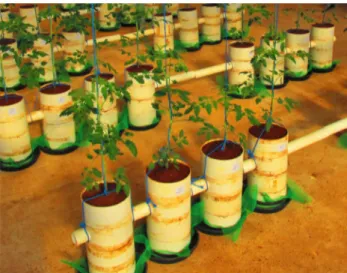
The experimental units were made using polyvinyl chloride (PVC) pipes of 20 cm diameter and 40 cm height, totaling a volume of 12.57 dm3. At height of 25 cm, 5-cm-diameter holes were made using a hole saw to install the access tube that allows to monitor soil moisture using the Diviner 2000® capacitance probe. Each experimental unit received 12 dm3 of soil.
The access tubes were installed horizontally passing through four pots to use the Diviner 2000® probe, as used by Pereira et al. (2016). Since readings are taken every 0.1 m, the experimental units had diameter of 0.2 m and were spaced by 0.1 m, totaling one reading in the center of the pot (Figure 1).
Previous calibration was performed to determine the relationship between soil water tension and volumetric moisture and the relationship between the volumetric moisture measured by the capacitance probe and the standard volumetric moisture. The first relationship is necessary to determine the reference volumetric moisture for each treatment of soil water
Sources used: A - Single superphosphate incorporated to the soil at transplanting; B - Dolomitic limestone applied as liming; C - Monoammonium phosphate (A.R.); D - Urea; E - Calcium chloride (A.R.); F - Magnesium sulfate (A.R.); G - Calcium nitrate; H - Potassium chloride (A.R.)
DAT Recommendation of macronutrients (mg dm
-3)
N P Ca Mg S
- - 193.5A 1200B 720B 112.5A
20 16C,D 27.09C - -
-28 18C,D 30.96C - -
-34 18C,D 38.7C 16E 7F 10.1F 40 20C,D 19.35C 16E 7F 10.1F 49 40C,D 38.7C 32E 14F 20.2F 60 32C,D 38.7C 48E 16F 23.1F
74 32G,D - 48G,E 16F 23.1F
90 24G,D - 40G,E 15F 21.7F
Total 200 387 1400 795 220.8
DAT Recommendation of micronutrients (mg dm
-3)
B Cu Mn Mo Zn
13 0.5 0.4 1.0 0.2 1.0
48 0.5 0.7 1.5 0.1 1.5
76 0.5 0.4 0.5 0 0.5
Total 1.5 1.5 3.0 0.3 3.0
Sources Boric Acid
Copper Sulfate
Manganese Sulfate
Molybdic Acid
Zinc Sulfate
DAT
Recommendation of potassium (mg dm-3K
2O)
according to treatmentH
0 125 250 375 500
20 - 6.25 12.5 18.75 25
28 - 6.25 12.5 18.75 25
34 - 6.25 12.5 18.75 25
40 - 6.25 12.5 18.75 25
49 - 17.5 35 52.5 70
60 - 20 40 60 80
74 - 27.5 55 82.5 110
90 - 35 70 105 140
Figure 1. Set of experimental units demonstrating access tube installation to monitor soil moisture with the capacitance probe
tension, while the second one is necessary to correct the differences between readings by the probe and the standard volumetric moisture of the soil. Soil water tension was measured by tensiometers.
Calibration was used to obtain the relationship between soil water tension and standard volumetric moisture (Eq. 1) (R2 = 0.97), which was used to determine the volumetric moisture for the water availability according to each treatment desired, as a function of soil water tension. For the tensions 4, 14, 24, 34 and 44 kPa, the corresponding volumetric moisture contents were 0.336, 0.199, 0.159, 0.137 and 0.123 cm3 cm-3, respectively.
θ = −
0 5994 0 418
. . .
T
where:
θ - volumetric soil moisture determined by the standard method, cm3 cm-3; and,
T - Water tension in the soil, kPa.
In the experiment, soil moisture monitoring for irrigation was daily performed using the capacitance probe. The volumetric moisture to determine the water depth applied per experimental unit was obtained by the relationship between the volumetric moisture measured by the capacitance probe and the standard volumetric moisture (Eq. 2) (R2 = 97.3).
θ=1 0737×θ −0 0068 2000
. .
Diviner
where:
θ - volumetric soil moisture determined by the standard method, cm3 cm-3; and,
θDiviner2000 - volumetric moisture measured by the Diviner 2000®, cm3 cm-3.
Volumetric soil moisture (standard) and soil volume in the pot were used to calculate the water volume (Eq. 3) required to reach the desired volumetric moisture, according to the water availability treatment. The accumulated water depth relative to the daily water consumption along the crop cycle was used as the water consumption by tomato plants.
where:
V - water volume (cm3);
θtreat - moisture for the desired treatments (cm3 cm-3); θactual - volumetric moisture (cm3 cm-3);
12000 - value referring to the soil volume in the experimental unit (cm3).
A drip irrigation system with semi-automated control was used. Solenoid valves were actuated by the serial port relay modules controlled by an Arduino BlackBoard of RoboCore®. The architecture of the program used by the controller was developed in the environment of the Arduino platform. The controller’s software application was developed to receive data of dripper flow rate, water volume to be applied per experimental unit and irrigation start time. To ensure safe communication, the programming sequence was sent to the controller every second.
Tomato seedlings were produced on polystyrene trays with commercial substrate and vermiculite at 1:1 proportion, where one seed of the cultivar ‘BRS Iracema’ was planted in each cell. One seedling was transplanted to each pot, when it showed three to four true leaves, on April 2, 2016.
At 7 days after transplanting, treatments were differentiated according to the water availability levels. Plants were trained using a narrow ribbon and grown with a single stake until approximately 2 m height from the base, and the other lateral shoots were eliminated as proposed by Marim et al. (2005).
Shoot dry matter (leaves + stem) was determined at 110 days after transplanting, by drying in a forced-air oven at 65 ºC until constant weight. Fruits were harvested periodically as they became ripe, determining the total number of fruits and yield (total fruit fresh weight) between 62 and 110 days after transplanting. Water consumption was considered from seedling transplantation to the end of crop cycle, obtained by the cumulative water depth applied in each experimental unit. Water use efficiency was determined by the relationship between fruit yield and water consumption.
The data were subjected to analysis of variance by F test at 0.05 probability level. When the interaction was significant, response-surface study was conducted or the data were fitted to linear and quadratic regression models when there was isolated significance for factors, using the Statistical Analysis System (SAS, 2014).
Results and Discussion
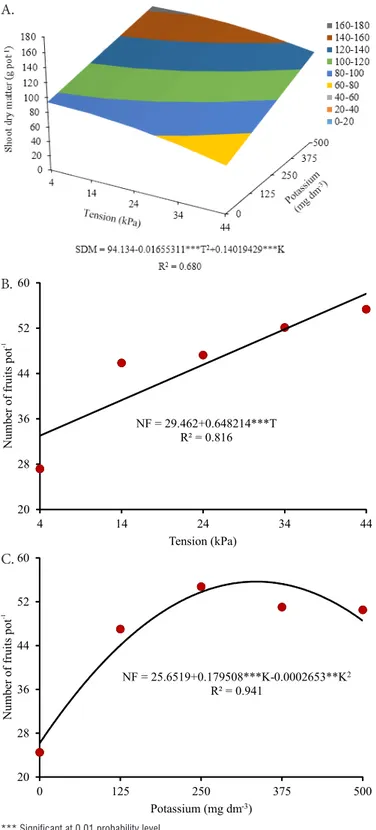
There was significant interaction between water availability and K doses for shoot dry matter. The significant response surface shows highest shoot dry matter (164 g plant-1) at water availability level of 4 kPa combined with K dose of 500 mg dm-3, promoting increment of 62% in comparison to the combination of 44 kPa and absence of K fertilization (Figure 2A).
The effect of water availability on the shoots was similar to that found by Candido et al. (2015), who observed an increment in tomato shoot dry matter as water depth increased. Bowles et al. (2016) also studied tomato under deficit conditions and
V=
(
θtreat−θactual)
×12000(1)
(2)
availability levels, the data fitted to a linear regression model, with highest number of fruits (58 fruits plant-1) found at tension of 44 kPa, an increment of 45% in comparison to the tension of 4 kPa (Figure 2B).
According to Rocha et al. (2010), higher number of fruits is not necessarily correlated with increasing yield because the quantity of sink organs per photoassimilates increases, which demands good nutrition to maintain a rapid fruit development.
For K fertilization, the data of number of fruits fitted to a quadratic regression model. Highest number of fruits (56 fruits pot-1) was observed at K dose of 338 mg dm-3, an increment of 54% compared with the absence of K fertilization (Figure 2C).
Higher number of fruits with the increment in K fertilization may be related to the functions of transport of sugars, amino acids and organic anions through the phloem, going from the leaves and stem to the fruits (Mengel & Viro, 1974), allowing to meet higher quantity of sink organs and promoting better setting of tomato fruits.
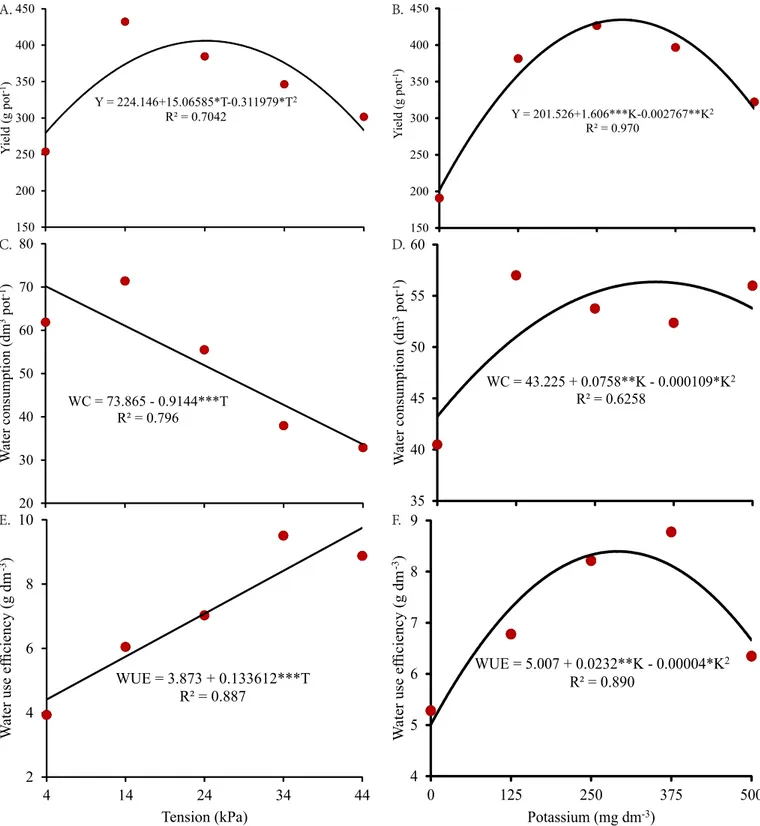
Cherry tomato yield showed isolated significant difference for water availability levels and K doses, both with fit to a quadratic regression model. Highest production of fruits (406 g plant-1) was observed at water availability of 24 kPa, an increment of 31% compared with the 4 kPa water availability level (Figure 3A).
For yield, Santana et al. (2010) and Zhang et al. (2016) observed in tomato under water depths a behavior similar to that found in the present study, in which water stress, through either excess or deficit, reduces the production potential. Kuşçu et al. (2014), Candido et al. (2015), Bogale et al. (2016) and Bowles et al. (2016) worked with tomato under water deficit condition and also observed reduction in yield.
Highest yield (434 g plant-1) was observed at K dose of 290 mg dm-3, an increment of 54% in comparison to the absence of K fertilization (Figure 3B).
Increment in yield as K fertilization increases may be related to the functions of transport of photoassimilates aided by potassium. Mengel & Viro (1974) observed in tomato plants the positive effect of K on the transport of sugars, amino acids and organic anions from leaves and stem to the fruits.
Water consumption showed isolated significant difference for water availability levels and K doses. For water availability levels, the data fitted to a linear regression model, with lowest consumption (33.6 dm-3 plant-1) at tension of 44 kPa, a reduction of 52% in comparison to the tension of 4 kPa (Figure 3C).
Water consumption data in the present study corroborate those of Kuşçu et al. (2014) and Zhang et al. (2016), who worked with tomato under water depths and observed increment in evapotranspiration as the applied water depth increased. Bowles et al. (2016) worked with tomato under deficit condition and observed that there was reduction in the water depth applied.
For K doses, cherry tomato water consumption data fitted to a quadratic regression model. Highest consumption (55.3 dm3 plant-1) was found at K dose of 348 mg dm-3, an increment of 22% in comparison to the absence of K fertilization (Figure 3D).
*** Significant at 0.01 probability level
Figure 2. Shoot dry matter (SDM) (A) and number of fruits (NF) (B and C) of ‘BRS Iracema’ cherry tomatoes under water availability levels and potassium doses in dystrophic Red Latosol
NF = 29.462+0.648214***T R² = 0.816
20 28 36 44 52 60
4 14 24 34 44
Number of fruits pot
-1
Tension (kPa)
NF = 25.6519+0.179508***K-0.0002653**K2
R² = 0.941
20 28 36 44 52 60
0 125 250 375 500
Number of fruits pot
-1
Potassium (mg dm-3)
A.
B.
C.
found reduction in shoot dry matter. Kanai et al. (2011) found reduction in the shoot dry matter of tomato plants under extreme K deficiency in hydroponics.
Larger shoots represent for the plants an increment in the capacity of synthesis, storage and transport of photoassimilates to meet the demand of sink organs, such as vegetative growth and particularly fruit formation (Taiz & Zeiger, 2013).
***, ** and * significant at 0.001, 0.01 and 0.05 probability levels, respectively
Figure 3. Yield (Y) (A and B), water consumption (WC) (C and D) and water use efficiency (WUE) (E and F) of ‘BRS Iracema’ cherry tomato under water availability levels and potassium doses in dystrophic Red Latosol
Y = 224.146+15.06585*T-0.311979*T2
R² = 0.7042
150 200 250 300 350 400 450
Y
ield (g pot
-1)
Y = 201.526+1.606***K-0.002767**K2
R² = 0.970
150 200 250 300 350 400 450
Y
ield (g pot
-1)
WC = 73.865 - 0.9144***T R² = 0.796
20 30 40 50 60 70 80
W
ater consumption (dm
3pot -1)
WC = 43.225 + 0.0758**K - 0.000109*K2
R² = 0.6258
35 40 45 50 55 60
W
ater consumption (dm
3pot -1)
WUE = 3.873 + 0.133612***T R² = 0.887
2 4 6 8 10
4 14 24 34 44
W
ater use ef
ficiency (g dm
-3)
Tension (kPa)
WUE = 5.007 + 0.0232**K - 0.00004*K2
R² = 0.890
4 5 6 7 8 9
0 125 250 375 500
W
ater use ef
ficiency (g dm
-3)
Potassium (mg dm-3)
A. B.
C. D.
E. F.
Higher water consumption is due to the greater vegetative and reproductive development of cherry tomato plants, promoted by the increment in K fertilization, because it is directly related to crop evapotranspiration. Water consumption is of great importance from the agricultural point of view because water is a limited resource to agriculture (Reichardt & Timm, 2012).
Cherry tomato water use efficiency showed isolated significant difference for water availability levels and K doses. For water availability levels, the data fitted to a linear regression model. Highest water use efficiency (9.7 g dm-3) was observed at
water availability of 44 kPa, an increment of 55% in comparison to the 4 kPa level (Figure 3E).
Increase in water use efficiency with reduction of the available water in the soil has also been found by Santana et al. (2010), Candido et al. (2015) and Bogale et al. (2016), who reported increase in tomato water use efficiency as water availability decreased.
Increment in tomato water use efficiency due to K fertilization results from the functions performed by this nutrient, controlling cell osmotic potential, absorption and retention of water in the cells and stomatal opening and closure, maintaining cell turgor even when cell expansion occurs, promoting efficient water use (Taiz & Zeiger, 2013).
Conclusions
1. Cherry tomato yield and water use are influenced by water availability levels and potassium doses, in pot cultivation in a greenhouse.
2. Highest cherry tomato yield occurs at soil water tension of 24 kPa and potassium dose of 290 mg dm-3.
3. Soil water tension of 44 kPa and potassium dose of 290 mg dm-3 lead to higher water use efficiency in cherry tomato.
Literature Cited
Alvarenga, M. A. R. Tomate: Produção em campo, casa de vegetação e hidroponia. 2.ed. rev. e ampl. Lavras: Editora Universitária de Lavras, 2013. 455p.
Bogale, A.; Nagle, M.; Latif, S.; Aguila, M.; Müller, J. Regulated deficit irrigation and partial root-zone drying irrigation impact bioactive compounds and antioxidant activity in two select tomato cultivars. Scientia Horticulturae, v.213, p.115-124, 2016. https:// doi.org/10.1016/j.scienta.2016.10.029
Bowles, T. M.; Barrios-Masias, F. H.; Carlisle, E. A.; Cavagnaro, T. R.; Jackson, L. E. Effects of arbuscular mycorrhizae on tomato yield, nutrient uptake, water relations, and soil carbon dynamics under deficit irrigation in field conditions. Science of the Total Environment, v.566-567, p.1223-1234, 2016. https://doi. org/10.1016/j.scitotenv.2016.05.178
Candido, V.; Campanelli, G.; D’Addabbo, T.; Castronuovo, D.; Perniola, M.; Camele, I. Growth and yield promoting effect of artificial mycorrhization on field tomato at different irrigation regimes. Scientia Horticulturae, v.187, p.35-43, 2015. https://doi. org/10.1016/j.scienta.2015.02.033
EMBRAPA - Empresa Brasileira de Pesquisa Agropecuária. Manual de métodos de análise de solo. 2.ed. Rio de Janeiro: EMBRAPA-SPI, 1997. 212p.
EMBRAPA - Empresa Brasileira de Pesquisa Agropecuária. Sistema brasileiro de classificação de solos. Rio de Janeiro: EMBRAPA-SPI, 2013. 342p.
Kanai, S.; Kanai, S.; Moghaieb, R. E.; El-Shemy, H. A.; Panigrahi, R.; Mohapatra, P. K.; Ito, J.; Nguyen, N. T.; Saneoka H.; Fujita, K. Potassium deficiency affects water status and photosynthetic rate of the vegetative sink in green house tomato prior to its effects on source activity. Plant Science, v.180, p.368-374, 2011. https://doi. org/10.1016/j.plantsci.2010.10.011
Kuşçu, H.; Turhan, A.; Demir, A. O. The response of processing tomato to deficit irrigation at various phenological stages in a sub-humid environment. Agricultural Water Management, v.133, p.92-103, 2014. https://doi.org/10.1016/j.agwat.2013.11.008
Littell, R. C.; Mott, G. O. Computer assisted design and analysis of response surface experiments in agronomy. Soil and Crop Society of Florida Proceedings, v.34, p.94-97, 1975.
Lúcio, A. D. C.; Sari, B. G.; Pezzini, R. V.; Liberalesso, V.; Delatorre, F.; Faé, M. Heterocedasticidade entre fileiras e colheitas de caracteres produtivos de tomate cereja e estimativa do tamanho de parcela. Horticultura Brasileira, v.34, p.223-230, 2016. https:// doi.org/10.1590/S0102-053620160000200012
Marim, B. G.; Silva, D. J. H. da; Guimarães, M. de A.; Belfort, G. Sistemas de tutoramento e condução do tomateiro visando produção de frutos para consumo in natura. Horticultura Brasileira, v.23, p.951-955, 2005. https://doi.org/10.1590/S0102-05362005000400018
Mengel, K.; Viro, M. Effect of potassium supply on the transport of photosynthates to the fruits of tomatoes (Lycopersicon esculentum). Physiologia Plantarum, v.30, p.295-300, 1974. https:// doi.org/10.1111/j.1399-3054.1974.tb03660.x
Pereira, M. T. J.; Silva, T. J. A. da; Bonfim-Silva, E. M. Soil water content and wood ash fertilization on the cultivation of gladiolus. Revista Brasileira de Engenharia Agrícola e Ambiental, v.20, p.350-356, 2016. https://doi.org/10.1590/1807-1929/agriambi. v20n4p350-356
Reichardt, K.; Timm, L. C. Solo, planta e atmosfera: Conceitos, processos e aplicações. 2.ed. Barueri: Manole, 2012. 500p. Reis, L. S.; Souza, J. L. de; Azevedo, C. A. V. de. Evapotranspiração
e coeficiente de cultivo do tomate caqui cultivado em ambiente protegido. Revista Brasileira de Engenharia Agrícola e Ambiental, v.13, p.289-296, 2009. https://doi.org/10.1590/S1415-43662009000300010
Rocha, M. de Q.; Peil, R. M. N.; Cogo, C. M. Rendimento do tomate cereja em função do cacho floral e da concentração de nutrientes em hidroponia. Horticultura Brasileira, v.28, p.466-471, 2010. https://doi.org/10.1590/S0102-05362010000400015
Santana, M. J.; Vieira, T. A.; Barreto, A. C.; Cruz, O. C. da. Resposta do tomateiro irrigado a níveis de reposição de água no solo. Irriga, v.15, p.443-454, 2010. https://doi.org/10.15809/ irriga.2010v15n4p443
SAS - Statistical Analysis System. Versão 9.4 Output delivery system: User's guide. Cary: SAS Institute, 2014. 1178p.
Taiz, L.; Zeiger, E. Fisiologia vegetal. 5.ed. Porto Alegre: Artmed, 2013. 609p.
Viol, M. A.; Carvalho, J. de A.; Lima, E. M. de C.; Mattos, R. W.; Rezende, F. C.; Rodrigues, J. L. M. Déficit hídrico e produção do tomate cultivado em ambiente protegido. Revista Brasileira de Agricultura Irrigada, v.11, p.1244-1253, 2017. https://doi. org/10.7127/rbai.v11n100580