AJA VOL (3) ISSUE 3, 2016: 50-57
Azarian Journal of Agriculture
www.azarianjournals.ir Azarian Journals
Research article ISSN:2383-4420
50
Assessments of saline water application and different irrigation intervals on soil and
soybean yield
Meysam Abedinpour
Article Info ABSTRACT
Accepted: 23 June 2016
The global water crisis reminds the important of enhancing water productivity in agriculture to increase the crop production and food security. Declining availability of fresh water resources has become a worldwide problem which promotes the new alternative sources of water-supply to overcome to this issue. In this goal, the effects of different irrigation intervals and water quality on soybean growth and soil properties were investigated by a field split plot experiment in a randomized completely block design water in three replications. Different saline water levels (1, 4 and 7 dS m-1) and
three irrigation intervals (7, 10 and 13 days) were arranged as studied factors in main and subplot, respectively. The maximum performance was obtained by the treatment of
7 days irrigation interval+non-saline water which produced 3760 and 8355 kg ha-1 grain
yield and biomass, respectively. Also, maximum water use efficiency of 9.08 kg ha -1mm-1 was obtained by 13 days irrigation interval+7 dS m-1 salinity. Maximum soil
salinity (ECe) in different soil layers was observed in the highest irrigation saline water
treatment (7 dS m-1) in all irrigation intervals. Moreover, irrigation with highest salinity
level (S3) resulted in the salt accumulation in the root zone from 1.4 dS m-1 (before
sowing) up to 5.7 dS m-1 at the end of growing period. Therefore, based on soil salinity
and crop yield, irrigation interval 7 days at lower levels of irrigation water salinities (up to 4 dS m-1) is suitable for soybean production in the semi-arid environment.
Keywords: Interval irrigation, Salinity, Soybean, Sustainability, Water use efficiency
INTRODUCTION1
ecause of increasing world population and thereafter increasing demand for food, use of fresh water resources has increased (Wallace 2000). On the other hand, the world's fresh water resources are limited; that forced farmers to use low quality waters. It is well known that due to high concentrations of soluble salts, the use of such waters may result not only in the decrease of crop yield, but also in the reduction in soil water infiltration capacity (Qadir et al. 2000). Salinity is a great problem in agriculture, especially in the coastal areas of the world. In many arid and semi-arid regions the soil salinity is caused by natural processes or by crop irrigation with saline water (Meloni et al. 2004). Adoption of suitable salinity control measures requires determination of
Assistant professor, Kashmar Higher Education Institute, Kashmar, Iran
*Email: [email protected]
salt and water movement through the soil profile and prediction of crop response to soil water and soil salinity, subject to various climatic, edaphic, and agronomic factors (Ferrer et al. 1999). Soil salinity impairs physiological functions by multiple mechanisms, including water stress, specific ion toxicity, ion imbalance stress, and induced nutrient deficiency. The relative importance of these detrimental stresses may vary according to crop species, growth stages, and the duration of the stress imposed (Munns and Tester, 2008; Zhang et al. 2010). Soybean seed is a major source of high-quality protein and oil for human consumption (Katerji et al. 2003). In soybean, salinity stress inhibits seed germination and seedling growth, reduces nodulation, and decreases biomass accumulation and yield (Essa 2002). Soybean is classified as a moderately salt-tolerant crop and the final yield of soybean will be reduced when soil salinity exceeds 5 dS m-1 (Ashraf 1994). In this
51
stress can considerably reduce growth and consequently grain yield per plant in soybean cultivars (El-Sabagh et al. 2015). Han and Lee (2005) found that salinity in soil decreased plant growth, photosynthesis, stomatal conductance and mineral uptake in soybean plants compared to those from non-saline soil. In Iran, besides water scarcity, water quality is deteriorating and water salinity is increasing due to uncontrolled discharges of untreated or poorly treated wastewater, over-abstraction of the aquifers, and the excessive use of fertilizers in agriculture. About 12% of Iran's surface waters are saline; so the role of saline water use with fresh water in the future would be undeniable (Anonymous 2009). Keeping this in view, soybean production is very important in the Golestan province, which more than of 50 percent of total soybean production in Iran producing in this province. Therefore, determination of suitable irrigation interval through saline water for soybean growth is very vital for achieving sustainability in grain production and soil quality in a semi-arid environment.
MATERIALS AND METHODS
Field experiment was conducted at the Asrieh field, Gorgan City, Golestan province during summer of 2012. The experimental farm is located in 36° 51’ N latitude and 54 º 29’ E longitudes with an average elevation of 86 m above mean sea level. The experiment was planned in a split plot design having three irrigation intervals viz. 7 (I1), 10 (I2)
and 13 days (I3) as main plots and three saline
water levels (viz. non saline, S1; 4 (S2) and 7 dS m-1
(S3) as sub plots with three replications. Soybean
cultivar Williams was sown in five rows of 2.5 × 3m plot size and the replications were separated by 2 m. The furrows were 45 cm apart with plant spacing of 10cm in each furrow. Saline water was prepared by mixing fresh water with sodium chloride salt. Same amount of irrigation water were applied for each treatment during the growing period. At the beginning of the growing period, all treatments were irrigated with fresh water.
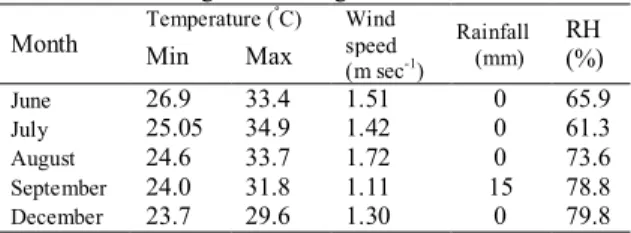
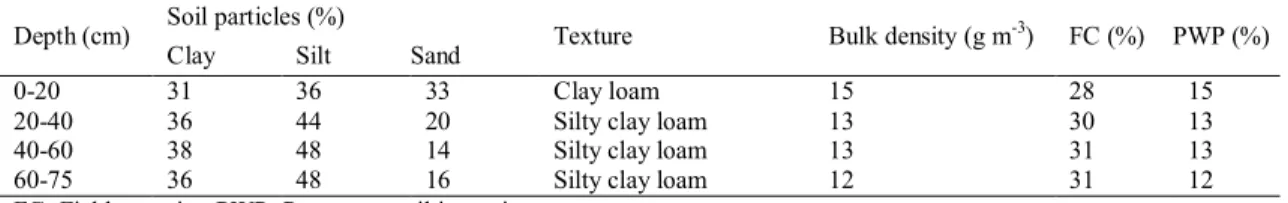
Data of weather parameters vis. Rainfall, maximum and minimum daily air temperature is prepared in Table 1. Soil samples were taken at initial condition at depths of 0-20, 20-40, 40-60 and 60-90 cm. Soil samples were analyzed to study the soil texture, soil moisture content, soil electrical
conductivity, soil pH, Ca2+ , Mg2+, and Na+ . Soil
texture was determined by hydrometer method. Soil Ca2+ and Mg2+ were measured by titration
method. Also, flame photometer was used to determine the amount of soil Na+. Morover, Soil
electrical conductivity was analyzed using saturation past. Table 2 and 3 shows the physical and chemical properties of the soil at initial condition. Irrigation water depth was calculated using soil moisture before irrigation to replenish the soil profile (up to the root zone) to field capacity, using the following equation (Israelsen and Hansen 1962):
dn=
fc
i
RD
i
B
d (1)Where: dn: is the net irrigation water depth (mm),
θfC: Soil water content at field capacity, θi: Soil
water content before irrigation (weight basis in %),
RDi: Depth of root development in each soil layer
(mm) and Bd: Bulk density of the given soil layer
(g cm-3). The dates of irrigations were determined
based on the root zone soil moisture content approached (50% of total available water (TAW)) and was considered as the manageable allowable deficit (MAD), which did not cause any stress to the plant. Root growth value was estimated by the following sigmoidal root growth model (Borg and Grimes 1986):
RDi= RDMax[0.5 + 0.5 sin (3.03( ) -1.47)] (2)
Where RDi is root depth attained at any day after
sowing (DAS), RDMax is maximum root depth,
DTM: Days after sowing to maximum root depth.
All terms are in mm day-1. The maximum rooting
depth of soybean was 0.9 m.
Crop water use efficiency (WUE) is calculated as follows (Howell et al. 1995):
WUE=
ETC
Y
(3)Where:Y: grain yield (kg ha-1), ETC: crop
evapotranspiration (mm), Soil moisture were measured regularly at varying soil depths of 20cm to 90 cm and also before and after irrigation treatments to measure the parameters required for estimation of actual crop evapotranspiration (ETC, mm/day) using Eq. 4 (Jenesen 1973).
ETC=
t
S
D
P
I
n i
1 1 2 (4)
Where: I, P and D are irrigation, precipitation and deep percolation from the bottom of root zone (mm), n the number of layers, ΔS is the thickness of each soil layer (mm), θ1 and θ2 are the
Table 1. The average meteorological data in 2012
Month Temperature (
ºC) Wind speed (m sec-1)
Rainfall (mm) RH (%)
Min Max
June 26.9 33.4 1.51 0 65.9
July 25.05 34.9 1.42 0 61.3
August 24.6 33.7 1.72 0 73.6
September 24.0 31.8 1.11 15 78.8
December 23.7 29.6 1.30 0 79.8
52
volumetric soil water content (cm3 cm-3) 24 hr after
and before next irrigation, and Δt is the time interval between two consecutive measurement (day). The furrows in the experimental plots were closed by bunds and the water table depth was below 4m from the ground surface. Therefore, the surface runoff and the vertical upward seepage or the capillary flow to the root zone was assumed negligible in the calculation of ETC using Eq. 4. Besides this, the drainage below root zone, after a number of soil-water content measurements, was considered to be negligible. So the Eq. 4 was reduced to:
ET = I + P ± ∆S (5)
The field water budgeting as mentioned above is commonly used to measure total actual water use or crop evapotranspiration (ETC) when lysimeter facilities are not available (Farahani 2009).
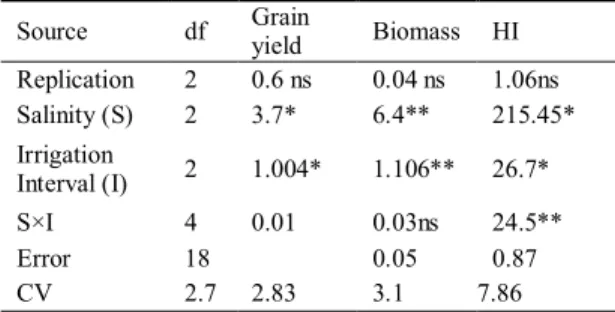
Analysis of variance was computed using the MSTATC software. Measurements included: grain yield and biomass, water use efficiency, and harvest index. Duncan test was applied to determine any significant differences between the
means of these traits.
RESULTS AND DISCUSSION
Grain Yield
The results showed that soybean grain yield was significantly affected by irrigation interval and salinity treatments (P ≤ 0.05) (Table 5). Increased water amounts due to low irrigation interval resulted in a relatively higher yield, since water deficit was main yield- limiting factor. Also, grain yield was higher under irrigation at 7 day interval than at 10 and 13 day intervals, and decreased significantly as the irrigation interval increased. The maximum and minimum yield was obtained at 7 day interval irrigation (I1) in interaction with
non-saline water (S1) and 13 day irrigation interval in
interaction with high salinity level (S3) at the rate
of 3760 and 2030 kg ha-1 respectively (Table 4). It
is found that irrigation with non saline water (S1) in
interaction with 7 day irrigation interval (I1)
increased the grain yield by 8.8% and 15.5 % over 10 (I2) and 13 day irrigation interval (I3),
respectively. Moreover, irrigation with 4 dS/m salinity level (S2) in interaction with 10 day (I2) and
13 day (I3) interval irrigation treatments reduced
Soybean grain yield by 11% and 20.3% in compare to 7 days interval irrigation treatment (I1),
respectively. Also, the grain yield was decreased by 10.3 and 25% for I2 and I3 treatments in compare to
the I1 treatment in interaction with high salinity
level tratment (S3). High concentration of salts in
the root zone reduces soil water potential. Consequently, plant cannot uptake water freely from the soil, and the deficiency of water causes reduction in the growth and yield (Lesley et al. 2003). These results substantiate findings of Kabir Table 2. Physical properties of the soil in the experiment field
Depth (cm) Soil particles (%) Texture Bulk density (g m-3) FC (%) PWP (%)
Clay Silt Sand
0-20 31 36 33 Clay loam 15 28 15
20-40 36 44 20 Silty clay loam 13 30 13
40-60 38 48 14 Silty clay loam 13 31 13
60-75 36 48 16 Silty clay loam 12 31 12
FC- Field capacity; PWP- Permanent wilting point
Table 3. Chemical properties of the soil in the experiment field
Depth
(cm) (dS mEC-1) pH SAR
Cations (meq L-1) ESP Na+ Ca2++M
g2+
0-20 1.21 7.35 4.81 9.2 7.32 3.78
20-40 1.36 7.35 4.97 10.3 8.60 3.9
40-60 1.42 7.35 5.18 10.9 8.86 4.06
60-90 1.43 7.35 5.23 10.8 8.84 4.1
SAR- Sodium absorption ratio, ESP- Exchangeable sodium percent
Table 4. Amount of grain yield, biomass, water use efficiency (WUE) and harvest index under different treatment S1; Non saline irrigation water (control)
Irrigation
Interval Irrigation water applied (mm) Grain yield (kg ha-1) Biomass (kg ha-1) Relative yield (kg haWUE -1mm-1) HI
I1: 7 day 490 3760 8355 1 7.67 0.44
I2: 10 day 415 3430 8075 0.91 8.26 0.42
I3: 13 day 350 3180 7540 0.85 9.08 0.42
S2; ECw= 4 dS m-1
I1: 7 day 490 3470 7950 0.92 7.08 0.43
I2: 10 day 415 3090 7465 0.82 7.44 0.41
I3: 13 day 350 2765 6650 0.73 7.9 0.41
S3; ECw= 7 dS m-1
I1: 7day 490 2680 6175 0.71 5.47 0.43
I2: 10 day 415 2390 5760 0.64 5.76 0.41
53
et al. (2009) and Ali et al. (2007) who also noted similar effects of irrigation on grain yield while working on wheat crop.
Plant biomass
The plant biomass was significantly affected (P ≤ 0.05) by different irrigation interval and salinity irrigation water (Table 5). At each irrigation intervals, higher reduction in biomass was resulted due to increase in water salinity. The highest level of biomass of soybean, obtained from 7day irrigation interval treatment (I1) under non-saline
irrigation water (S1) (8350 kg ha-1) and the lowest,
obtained from 13day irrigation interval + 7 dS m-1
saline water (4960 kg ha-1) (Table 4). Moreover,
10 days (I2) and 13 days (I3) interval irrigation
treatments reduced Soybean biomass by 5.2% and 14.8% in compare to 7 days interval irrigation treatment (I1), respectively. This indicated that the
threshold treatment for soybean biomass is below 4 dS m-1 for the water salinity and 7 day irrigation
interval. When soil moisture is highly reduced (high irrigation intervals), the salt concentration between soil and plant root severely increased and when these two stresses are interacted simultaneously, they intensify each other (Brown et al. 2006). Pessarakli and Tucker (1985) showed that the enforcement of salt stress decreased the
root-water uptake, plant's growth and the dry matter production. Similarly, Brown et al. (2006) indicated that enforcement of soil salinity and water stress would definitely decrease both biomass and root dry matter. Also, the parallel conclusion was observed in the research, conducted on by Ghotbizadeh et al. (2015).
Water use efficiency
Water use efficiency (WUE) ranged from a minimum of 5.47 kg ha-1mm-1 to a maximum of
9.08 kg ha-1mm-1. Water use efficiency for 13 day
irrigation interval (I3) under non-saline irrigation
water (S1) treatment was the highest, whereas that
for 7 day irrigation interval (I1) treatment under
high salinity water (S3) was the lowest (Table 4).
Among the interaction effect of irrigation intervals and irrigation with saline water, 7 days (I1) and 10
days (I2) interval irrigation treatments under non
saline irrigation water (S1) reduced water use
efficiency by 9% and 15% in compare to 13 days interval irrigation treatment (I3), respectively.
Similarly, 7 days (I1) and 10 days (I2) interval
irrigation treatments under moderate saline irrigation water (S2) reduced water use efficiency
by 6% and 10.4% in compare to 13 days interval irrigation treatment (I3), respectively. Moreover,
WUE was reduced in I1S3 and I2S3 treatment at the
rate of 5.7 and 0.7% in compare to I3S3 treatment
(Table 6).
Seasonal evapotranspiration
According to Table 4, water salinity and different irrigation intervals has influenced the seasonal evapotranspiration. However, no significant interaction between intervals of irrigation and water salinity levels was observed. The relationship between grain yield, biomass and seasonal evapotranspiration (ET) is presented in Fig. 1. A positive linear relationship between crop water used and grain yield and biomass exist during the crop growth stages. However, the slope of fitted trend line representing the yield and biomass were (7.3<slope<18.3). Moreover, the variation in use of water during crop growth period ranged from a Table 5. Analysis of variance (ANOVA) for yield,
biomass, and water use efficiency (WUE) and harvest index (HI)
Source df Grain yield Biomass HI
Replication 2 0.6 ns 0.04 ns 1.06ns
Salinity (S) 2 3.7* 6.4** 215.45*
Irrigation
Interval (I) 2 1.004* 1.106** 26.7*
S×I 4 0.01 0.03ns 24.5**
Error 18 0.05 0.87
CV 2.7 2.83 3.1 7.86
*, ** - Significant in 0.05 and 0.01 probability levels and NS, not significant, respectively ; I×S- Interaction effect of water and Salinity
Table 6. Mean values of yield, biomass, WUE and HI in each salinity water and irrigation intervals
Source Grain yield(t ha-1) Biomass(t ha-1) WUE HI
Irrigation water salinity, ds m-1
S1; ECW: 1.1 dS m-1 3.46a 7.99a 8.34a 0.43a
S2; ECW: 4 dS m-1 3.11b 7.35b 7.47b 0.42a
S3; ECW: 7 dS m-1 2.37c 5.63c 5.68c 0.42a
Irrigation interval, day
I1; Irrig. Inter.: 7 day 3.31a 7.49a 6.74c 0.43a
I1; Irrig. Int.: 10 day 2.97b 7.10b 7.16b 0.41b
I1; Irrig. Int.: 13 day 2.66c 6.38c 7.6a 0.41b
54
minimum of 350 mm to a maximum of 495 mm for 13 and 7 day irrigation intervals, respectively. It was also shown that crop yield and biomass were positively related to WUE (Fig. 1) as reported by others (e.g. Ashraf and Bashir, 2003 and Qiu et al. 2008).
Soil Moisture Content
The soil moisture content status depended on the irrigation intervals and salinity levels of irrigation water. The gravimetric soil moisture content (θm)
of the treatments irrigated with fresh water (control) was lower than different levels of saline water irrigation treatments (Fig. 2). This explains the potential of plant to uptake much water under fresh water irrigation without water stress. Effect of grain yield reduction due to excess salinity in the root zone is that it renders less water available to plants although some is still available in the root zone (Fig. 2). Also, this is because the osmotic pressure of the soil solution increases as the salt concentration increases. Apart from the osmotic effect of salts in the soil solution, excessive concentration and absorption of individual ions may prove toxic to the plants and/or may retard the absorption of other essential plant nutrients. Hoorn et al. (2001) reported that, the soybean and chickpea water uptake decreases with increasing salinity in spite of adequate soil moisture in the
root zone. Ould Ahmed (2010) indicated that, irrespective of irrigation interval, the volumetric soil moisture under saline water treatment was higher than that under good quality water treatments. As for the effect of soil moisture, data reveal that the maximum grain yield and biomass were obtained when the soil moisture content was close to the field capacity (I1).
Soil Electrical Conductivity and PH
56
The ECe for the treatments I1S2 and I1S3 was
increased from 1.4 dS/m at planting time to approximately 4.3 and 5.2 dS/m at harvest, respectively. Also, the ECe for the treatments I2S2
and I2S3 before planting showed that the initial
electrical conductivity of the soil was 1.4 dS m-1,
while the electrical conductivity reached to 4.6 and 5.5 dS m-1 at harvest, respectively. Furthermore,
this value for I3S2 and I3S3 treatments was
increased from 1.4 dS m-1 to 4.8 and 5.7 dS m-1,
respectively. The high irrigation intervals imposed a more rapid salt accumulation in the root zone, which was ascribed to restriction of the volume of drainage solution. This may be attributed to the higher direct evaporation rates leading to an increase in salt accumulation in the soil. Geerts et al. (2008) reported that reducing soil moisture content by deficit irrigation can increased soil salinity due to lack of leaching. The soil pH was in the normal range and was not affected by the saline irrigation water during the growing period (Fig. 4).
CONCLUSION
It was concluded that, there were significant differences on the soybean grain yield and biomass under different irrigation intervals and salinity. Grain yield and biomass ranged from 2030 and 4960 kg-1 ha in I
3S3 treatment to 3760 and 8355 kg -1 ha in I
1SI treatment. Also, Water use efficiency
(WUE) ranged from a minimum of 5.8 kg ha-1 mm
-1 to a maximum of 9.08 kg ha-1 mm-1. Water use
efficiency for I3S1 treatment was the highest,
whereas that for I3S3 treatment was the lowest. A
positive linear relationship between crop water use and yield exists during the experimental year. Accordingly, when highly saline water is used for irrigation, it is recommended to use short irrigation interval (7 days interval) instead of applying irrigation every 10 or 13day as it is practiced by the farmers. However, the short irrigation interval practice normally reduces the plant stress under saline irrigation. Regarding the salt accumulation in the root zone, the results of this study showed an increase in soil salinity that reached up to 5.7 dS m -1 at the end of the growing period, particularly
under highly saline irrigation. This emphasizes the need for conservation of soil properties besides the yield production of soybean under long-term saline irrigation.
REFERENCES
Anonymous. (2009) Sustainable management of unconventional water resources and saline soils. National Research Centre for salinity, Yazd, Iran.
Ashraf M. (2004) Some important physiological selection criteria for salt tolerance in plants. Flora, 199: 361-376.
Ashraf M. Bashir A. (2003) Relationship of photosynthetic capacity at the vegetative stage
and during grain development with grain yield of two hexaploid wheat (Triticum aestivum L.) cultivars differing in yield. European Journal Agronomy, 19: 277-287.
Borg H. Grimes D.W. (1986) Depth development of roots with time: An empirical description. Trans: ASAE 29, (1): 194-197.
Brown C.E. Pezeshki S.R. DeLaune R.D. (2006) The effects of salinity and soil drying on nutrient uptake and growth of Spartina alterniflora in a simulated tidal system. Environmental and Experimental Botany, 58: 140-148.
El-Sabagh1 A. Sorour S. Ueda A. Saneoka H. Barutçular C. (2015) Evaluation of salinity stress effects on seed yield and quality of three soybean cultivars. Azarian Journal of Agriculture, 2, (5):138-141.
Essa T.A. (2002) Effect of salinity stress on growth and nutrient composition of three soybean (Glycine max L. Merrill) Cultivars. Journal of Agronomy and Crop Science, 188: 86-93.
Farahani H.J. Izzi G. Oweis T.Y. (2009) Parameterization and evaluation of the AquaCrop model for full and deficit irrigated
cotton. Agronomy Journal, 101:469-476.
Farhoudi R. Sharifzadeh F. Poustini K. Makkizadeh M.T. Kochakpour M. (2007) The effects of NaCl priming on salt tolerance in canola (Brassica napus) seedlings grown under saline conditions. Seed Science and Technology, 35: 754-759.
Ferrer F.A. Stockle C.O. (1999) A model for assessing crop response to salinity. Irrigation Science, 19:15–23.
four grain legumes and on biological nitrogen contribution from the soil. Agricultural Water Management, 51:87–98.
Geerts S. Raes D. Garcia M. Condori O. Mamani R. Miranda J. Cusicanqui J. Taboada C. Vacher J. (2008) Could Deficit Irrigation Be a Sustainable Practice for Quinoa (Chenopodium quinoa Willd.) In the Southern Bolivian Altiplano. Agriculture Water Management, 95(8): 909-917.
Ghotbizadeh M. Sepaskhah A.R. (2015) Effect of irrigation interval and water salinity on growth of vetiver (Vetiveria zizanioides). International Journal of Plant Production, 9 (1): 1-22. Han H.S. Lee K.D. (2005) Physiological responses
of soybean inoculation of Bradyrhizobium japonicum PGPR in saline soil conditions. Research Journal Agriculture Biology Science, 1(3): 216-221.
57
Howell T.A. Steiner J.L. Schneider A.D. Evett S.R. (1995) Evapotranspiration of irrigated winter wheat in the Southern High Plains. Transactions of the American Society of Agriculture Engineering, 38: 745–759.
Israelsen O.W. Hansen V.E. (1962) Irrigation Principles and Practices. John Wiley and Sons, Inc. New York, USA.
Jensen M.E. (1973) Consumptive use of water and irrigation water requirements. ASCE, New York, NY, USA.
Katerji N. van Hoorn J.W. Hamdy A. Mastrorilli M. (2003) Salinity effect on crop development and yield, analysis of salt tolerance according to several classification methods. Agriculture Water Management, 62: 37-66.
Lesley R. Murphy L.R. Kinsey S.T. Durako M.J. (2003) Physiological effects of short term salinity changes on Ruppia maritima. Aquatic Botany, 75: 293-309.
Maas E. Hoffman G. (1999) Crop Salt Tolerance: Current Assessment. Journal of Irrigation, 103(2): 115-134.
Meloni D.A. Gulotta M.R. Martinez C.A. Oliva M.A. (2004) The effects of salts on growth nitrate reduction and proline and glycine-betaine accumulation in Prosopisalba. Brazilian Journal Plant Physiology, 16: 39-46.
Munns R. and Tester M. (2008) Mechanisms of salinity tolerance. Annual Review of Plant Biology, 59: 651-681.
Ould Ahmed B. Inoue M. Moritani S. (2010) Effect of Saline Water Irrigation and Manure Application. Agriculture Water Management, 97(1): 165-170.
Pessarakli M. Tucker T.C. (1985) Uptake of nitrogen-15 by cotton under salt stress. Soil Science Society American J. 49: 149-152. Qadir M. Ghafoor A. Murtaza G. (2000)
Amelioration strategies for saline soils: a review of Land Degradation Development, 11:501–521.
Qiu G.Y. Wang L. He X. Zhang X. Chen S. Chen J. Yang Y. (2008) Water use efficiency and evapotranspiration of winter wheat and its response to irrigation regime in the north China plain. Agriculture and Forest Meteorology,148: 1848 – 1859.
Wallace J.S. (2000) Increasing agricultural water use efficiency to meet future food production. Agriculture Water Management, 82: 105-119. Zhang J.L. Flowers T.J. Wang S.M. (2010)
Mechanisms of sodium uptake by roots of higher plants. Plant Soil, 326: 45-60.
Journal sponsorship