Leaf-associated bacterial microbiota of coffee and its correlation with
manganese and calcium levels on leaves
Leandro Pio de Sousa
1,2,3, Marcio José da Silva
4and Jorge Maurício Costa Mondego
11
Instituto Agronômico, Campinas, SP, Brazil.
2
Departamento de Genética, Evolução e Bioagentes, Instituto de Biologia Universidade de Campinas
(UNICAMP), Campinas, SP, Brazil.
3
Programa de Pós Graduação em Genética e Biologia Molecular, Instituto de Biologia, Universidade de
Campinas (UNICAMP), Campinas, SP, Brazil.
4
Centro de Biologia Molecular e Engenharia Genética (CBMEG), Universidade de Campinas (UNICAMP),
Campinas, SP, Brazil.
Abstract
Coffee is one of the most valuable agricultural commodities and the plants’ leaves are the primary site of infection for most coffee diseases, such as the devastating coffee leaf rust. Therefore, the use of bacterial microbiota that inhabits coffee leaves to fight infections could be an alternative agricultural method to protect against coffee diseases. Here, we report the leaf-associated bacteria in three coffee genotypes over the course of a year, with the aim to determine the diversity of bacterial microbiota. The results indicate a prevalence of Enterobacteriales inCoffea canephora, Pseudomonadales inC. arabica ‘Obatã’, and an intriguing lack of bacterial dominance in C. arabica ‘Catuaí’. Using PERMANOVA analyses, we assessed the association between bacterial abundance in the coffee genotypes and en-vironmental parameters such as temperature, precipitation, and mineral nutrients in the leaves. We detected a close relationship between the amount of Mn and the abundance of Pseudomonadales in ‘Obatã’ and the amount of Ca and the abundance of Enterobacteriales inC. canephora. We suggest that mineral nutrients can be key drivers that shape leaf microbial communities.
Keywords: Coffee, bacteria,16S, leaf, manganese, calcium. Received: August 16, 2017; Accepted: October 14, 2017.
Introduction
Coffee (Coffeaspp.) seeds are the main agricultural commodity in the world, mainly produced in tropical coun-tries such as Brazil, Vietnam, Indonesia, and Colombia (In-ternational Coffee Organization, 2013). Out of approxi-mately 120 species belonging to the genusCoffea, only two are economically relevant:C. canephora, an allogamous diploid species, andC. arabica,the only allotetraploid spe-cies in the genus, resulting from a fusion of the diploidsC. canephoraandC. eugenioides(Mondegoet al., 2011). Due to its autogamy,C. arabicahas a very narrow genetic basis, which leads to a high susceptibility to diseases, including the devastating fungal disease known as coffee leaf rust (McCook and Vandermeer, 2015).
Coffee consumption has been augmenting world-wide, leading to an increase in coffee production and, as a
consequence, the use of agricultural pesticides and fertiliz-ers. Extensive evidence for the resulting negative impact on ecosystems has stimulated the use of sustainable practices (dos Santoset al., 2010; Caldwellet al., 2015). The appli-cation of plant growth-promoting bacteria (PGPB), which are natural inhabitants of plants, is an interesting alternative to conventional agricultural methods, since these microor-ganisms are known to increase crop production by supply-ing plants with nutrients and enhancsupply-ing their defense against pathogens (Bulgarelliet al., 2013; Hernandez-Leon et al., 2015; Ritpitakphonget al., 2016).
An increased number of coffee-associated microbes that have potential agricultural and/or industrial application have been identified (Vaughanet al., 2015). These studies have focused on the microbiome of the rhizosphere of cof-fee (Caldwellet al., 2015), coffee beans (Oliveiraet al., 2013), and even the coffee leach waste in coffee machines (Vilanovaet al., 2015). Even though the phyllosphere is one the largest microbial habitats (Lindow and Leveau, 2002; Vorholt, 2012) and most important fungal and bacte-rial coffee diseases are foliar, (i.e., coffee leaf rust, brown-DOI: http://dx.doi.org/10.1590/1678-4685-GMB-2017-0255
Send correspondence to Jorge Maurício Costa Mondego, Instituto Agronômico, Avenida Theodureto de Almeida Camargo 1500, Fa-zenda Santa Elisa, CEP 13075-630, Campinas, SP, Brazil. E-mail: [email protected].
eye spot, and halo blight) leaf-associated microbiota in cof-fee plants have not been explored yet.
The composition, diversity, and abundance of the bacterial community on leaves depend on several factors, such as the host plant genotype, the age of the leaf, the envi-ronmental conditions (i.e., humidity, UV radiation, and temperature), and nutrient availability (Lindow and Leveau, 2002; Vorholt, 2012; Bulgarelli et al., 2013; Bringel and Couée, 2015). Leaves are sources of mineral nutrients throughout plant development, especially during vegetative growth (Maillardet al., 2015). Bacterial com-munities and mineral nutrients were correlated on rhizosphere (Lepleuxet al., 2013; Sunet al., 2013). How-ever, correlation between mineral nutrients and phyllosphere microbiome deserves further studies. Another aspect that must be considered when studying the phyllosphere community is the seasonal fluctuation in leaf microbiota (Rastogi et al., 2012). For instance, coffee plants are perennial evergreen plants that form and shed leaves throughout their annual growth cycle, which might contribute to the fluctuation of bacterial flora diversity over time.
The main goal of this study was to investigate the bac-terial community associated with coffee leaves. We se-lected three different genotypes ofCoffea based on their economic relevance and phenotypic traits: C. canephora ‘Guarini’,C. arabica ‘Catuaí Amarelo’, and C. arabica ‘Obatã’. ‘Obatã’ has resistance toHemileia vastatrix, in-herited from ‘Hibrido de timor’ plants through natural hy-bridizations between coffee leaf rust-susceptible C. arabicaand coffee leaf rust-resistantC. canephora(Seraet al., 2010). The samples were collected at Fazenda Santa Elisa, the experimental farm of the Agronomic Institute of Campinas (IAC), one of the well-known areas for coffee germplasm preservation in the world (Silvestrini et al., 2008). We used a strategy based on amplification and Sang-er-sequencing of a fraction of 16S rDNA that could distin-guish plant DNA (mitochondrial and plastidial) from bacterial DNA (Chelius and Triplett, 2001). Based on the abundance of bacterial orders in the analyzed leaves and their correlation with abiotic factors such as coffee phenology and mineral nutrients, we evaluated which fac-tors could modulate the microbial composition on coffee leaves of those three genotypes.
Materials and Methods
Experimental design
Three different Coffea genotypes were analyzed:
Coffea canephora ‘Guarini’ IAC 447-1, Coffea arabica
‘Catuaí Amarelo’ IAC 62, and C. arabica ‘Obatã’ IAC 1669-20. Leaf samples were collected at Fazenda Santa Elisa, the experimental farm of the Agronomic Institute of Campinas (IAC, Campinas, Brazil; 22o5’47’’ S / 47o5’ 6’’
W, 664 m). The samples were collected at four different
times during 2013 and 2014, following the phenology of coffee plants: in mid-June 2013 (coffee plants after fruit harvest in the ‘rest’ period), late September 2013 (‘blos-som’ period), mid-January 2014 (‘early fruit’ period), and mid-April 2014 (‘mature fruit’ period). The harvesting was performed between 9:30 and 10:00 A.M. (GMT-3), with the exception of January, when the samples were collected between 10:30 and 11:00 because of the Brazilian summer time (GMT-2). From a total of nine plants, 54 healthy young leaf samples of each genotype were collected at each sampling point. The leaves were indiscriminately collected from orthotropic and plagiotropic stems in both shaded and non-shaded parts of the plants. Twenty-seven leaves (3 from each plant) were pooled and immediately frozen in liquid nitrogen and stored at -80ºC for DNA analysis. The remaining 27 (3 from each plant) were separated into three triplicates of 9 leaves and stored at 4°C for not more than two days, after which the mineral concentrations were ana-lyzed. The data on the precipitation and temperature during each week of leaf collection were obtained from the Inte-grated Center for Meteorological Information (CIIAGRO, http://www.ciiagro.sp.gov.br). The soil at the collection sites was clayey oxisol (typical dystrophic red latosol). Fer-tilizers were not applied to coffee plants.
Mineral nutrients analysis
The leaves were carefully cleaned to remove any ad-hering soil particles, washed, placed in a paper bag, and dried in a forced air oven at 70 °C. The samples were then weighed and ground in a Wiley-type grinder. The samples were incinerated in an oven according to Batagliaet al. (1983), and the extracts in the leftover ash were then ana-lyzed by induced coupled plasma emission spectrometry (ICP-OES) (Vista MPX; Varian, Belrose, Australia) for the presence of the following elements: P, K, Ca, Mg, S, Cu, Fe, Mn, Zn, and B.
DNA extraction, PCR, 16S library, and sequencing
The DNA from the leaves previously collected and stored at -80 °C was extracted using the Concert kit (Invi-trogen, Carlsbad, CA, USA). PCR amplification of the bac-terial 16S rDNA in total leaf DNA was accomplished using the primer pair 799f/1492r, according to Chelius and Tri-plett (2001). After electrophoresis, two DNA bands were visualized: one band of 1090 bp represented the coffee mi-tochondrial and plastidial 16S rDNA fragments, and the other band of 735 bp was a part of the bacterial 16S rDNA. The latter band was purified from the agarose gel and used to construct 16S libraries, according to the method de-scribed by Chelius and Triplett (2001). The pGEM-T clon-ing system (Promega, Madison, WI, USA) was used withan average utilization rate of 85% per library. Clone sequenc-ing wasgradually performed ussequenc-ing the traditional Sanger method, as the rarefaction curve was stabilizing. All se-quences were clustered into operational taxonomic units
(OTUs) with a 97% identity threshold using the modules of the software package Mothur (version v.1.29.2), according to Telias et al.(2011). The Ribosomal Database Project (RDP II, http://rdp.cme.msu.edu/) was used in the taxo-nomic classification of OTUs. Rarefaction analysis (OTUs per number of sequences) was performed to check near-saturation behavior in all libraries calculated with the FastGroupII tool (Yuet al., 2006).
Statistical analyses
The microbial community and environmental data were compared with respect to coffee genotypes (cultivar) and season of collection (phenology ofCoffeaplants) using the Primer v7 software (version 7.0.13; PRIMER-E Ltd., Lutton, UK). The fixed factors included coffee cultivar (CUL) and season (SE), with three (‘Catuaí’, ‘Obatã’, and C. canephora) and four levels (‘rest’, ‘blossom’, ‘early fruit’, and ‘late fruit’), respectively. Environmental data (nutrients) were log (x+1) transformed and normalized for the construction of a resemblance matrix based on Euclid-ean distance. Canonical analysis of principal coordinates (CAP) was used as a constrained ordination method for en-vironmental samples. Biological data (microbial commu-nity abundance) was square-root transformed, and Bray-Curtis similarity was applied in the resemblance matrix. Non-metric multidimensional scaling (NMDS) ordinations were performed to visualize multivariate patterns in micro-bial assemblages. Permutational multivariate analysis of variance (PERMANOVA) was applied to test the differ-ences between the samples. Marginal test p-values were calculated using 999 permutations. To identify and quan-tify the environmental variables that potentially influenced the bacterial community variability, BVSTEP and the dis-tance-based linear model (DistLM) were applied. The Spearman rank correlation coefficient (r) was used in BVSTEP. The fitted DistLM was visualized using the dis-tance-based redundancy analysis constrained ordination (dbRDA). The most parsimonious model was obtained us-ing the AICc selection criteria and the stepwise selection procedure. Phylogenetic distances between observed or-ganisms were integrated in the calculation of biological communities comparison using UNIFRAC (Lozupone and Knight, 2005) implemented in QIIME pipeline (http://qiime.org/index.html).
Results
DNA extraction, PCR, assembly libraries, and sequencing
In PCR performed with the primers 799f/1492r, two bands were expected in the gel: a 1090 bp band, corre-sponding to the 16S mitochondrial and plastidial plant rDNA, and a 735 bp band, corresponding to the bacterial 16S rDNA (Chelius and Triplett, 2001). However, ‘Catuaí’ and ‘Obatã’ had only the bacterial 16S band amplified
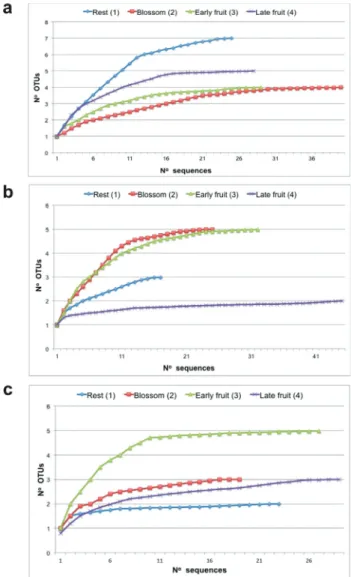
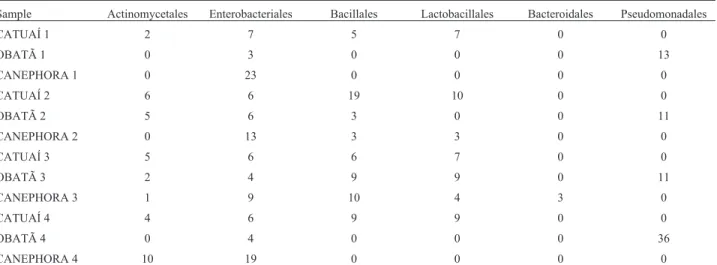
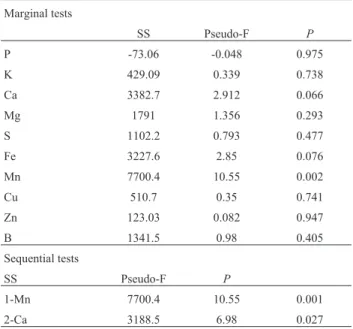
(Fig-ure S1). Using the Primer-BLAST tool, we confirmed that the primers used aligned inC. canephora16S rDNA, but not in ‘Catuaí’ and ‘Obatã’ 16S rDNA (data not shown), which confirmed the PCR amplification. The sequencing of pGEM-T easy mini-libraries was performed gradually until achieve a stabilized rarefaction curve. The minimum num-ber of clones ranged between 20 and 40, depending on the amount of new OTUs (Figure 1).
Library analyses and diversity index
The RDP was used to taxonomically classify the bac-terial OTUs. Because of the small size of the amplified 16S PCR products, not all OTUs were identified to basal levels, such as species, genus, or family using RDP. The OTUs were therefore grouped by orders (Figure 2, Table 1). Pseudomonadales and Enterobacteriales dominated in ‘Obatã’ andC. canephora, respectively, with a prevalence
of 35 to 100%. In ‘Obatã’, we also found Actinomycetales and Enterobacteriales, but in a smaller number. In C.
canephora, we found Actinomycetales and Bacillales,
es-pecially in the last two samplings (January and April 2014). On the other hand, Bacillales were more abundant in ‘Ca-tuaí’ than in the other two genotypes, with prevalence
be-tween 20 and 45%. Actinomycetales, Enterobacteriales, and Lactobacillales were also found in ‘Catuaí’, sometimes competing with Bacillales for primacy in the bacterial com-munity (Figure 2).
Evaluation of micro- and macronutrients in leaves and their relationship with bacterial communities
We tested whether mineral nutrients (P, K, Mg, Ca, Mn, S, B, Fe, Zn, and Cu) present in leaves could modulate the leaf-associated microbiota found inCoffeaplants. The minerals were measured by ICP-OES (Table 2) and used as environmental parameters together with maximum, me-dium, and minimum temperature and weekly rainfall (mm) at each time of sample collection (Table 3). CAP ordina-tion, together with PERMANOVA tests (Table 4), indi-cated that the concentration of minerals was significantly different between cultivars (p = 0.004) and seasons (p = 0.003). The overlaying of minerals as vectors in the CAP graphic indicates that these elements tend to accumulate in leaves during the resting season, but not during other sea-sons (Figure 3).
NMDS analyses were performed to evaluate multi-variate patterns in microbial assembly. Plots based on culti-var factor were evaluated (2D stress = 0.07), indicating clear separation among the three coffee genotypes, but no difference between seasons (Figure 4). Similar profiles of clustering were observable for the data set using UniFrac distances (Figure 5). UniFrac is a distance metric method used for comparing biological communities. It incorporates information on the relative relatedness of community mem-bers by including phylogenetic distances between observed organisms in the computation (Lozupone and Knight, 2015). In our analyses, weighted variant, which accounts for the relative abundance of each of the taxa within the communities, resulted in a better clustering data than the unweighted variant, which uses only qualitative data (ab-sence/presence; Figure 5).
The environmental and microbiota variables were plotted as overlaid vectors, suggesting a correlation be-tween the amount of Mn and the abundance of Pseudo-monadales in ‘Obatã’ leaves (Figure 4). The samples ofC.
canephorafrom the resting (canephora 1) and the blossom
periods (canephora 2) had the highest amounts of Ca in their leaves. Interestingly, Enterobacteriales were prevalent in the leaf samples of canephora 1 and 2 (Figure 4b). PERMANOVA (Table 5) corroborated the NMDS plots, indicating no correlation between microbial community and season (p= 0.11) and a positive correlation between microbial community and cultivar (p= 0.001).
Two methods were used to explore the relationships among environmental and biological data. BVSTEP indi-cated that Ca and Mn were the environmental variables that could explain microbial community composition (r> 0.95; Dr< 0.001; data not shown). In addition, DistLM was used to quantify the influence of environmental variables on
458 de Sousaet al.
Figure 2- Distribution of sequences (y-axis) corresponding to the prevail-ing orders in the three coffee genotypes at four different collection times (x-axis). Taxonomic classification of leaf-associated bacterial sequences in coffee samples according to the RDP classifier (http://rdp.cme.msu.edu). a)C. arabica‘Catuaí’, b)C. arabica‘Obatã’,
bacterial diversity. The most parsimonious model indicated that Mn (p= 0.001) and Ca (p = 0.02) explained almost 70% of the total variation (48.99% for Mn and 20.34% for Ca; Figure 6, Tables 6 and 7).
Discussion
Enterobacteriales and Pseudomonadales dominate the leaves ofC. canephoraandC. arabica‘Obatã’
Independent from seasonal factors, Enterobacteriales were dominant in C. canephora, Pseudomonadales in ‘Obatã’, and, surprisingly, there was no prevalence of bac-terial orders in ‘Catuaí’, whose bacbac-terial community was composed of Bacillales, Actinomycetales, Lactobacillales, and Enterobacteriales. This result is intriguing and suggests a positive, or at least non-competitive, and long-lasting in-teraction between those bacterial orders in ‘Catuaí’. How-ever, it is possible that there is fluctuation in the abundance of bacterial families, genera, or even species within each order, and that bacterial diversity in ‘Catuaí’ is higher than that reported herein.
Interestingly, we did not find a conserved micro-biome among the leaves of the three coffee genotypes, which in turn exhibited specific microbial lineages (Coleman-Derret al., 2016). The fact that the coffee plants used in this study were grown in sympatry discards the lo-cation as a source of variation. Therefore, genotypes and environmental factors such as temperature and rainfall, which are implicit to the season factor in sympatric sam-ples, could explain bacterial community variation. How-ever, minerals, which were chosen as environmental factors in our analyses because of their role in modulating bacterial colonization (Lepleuxet al., 2013), were the modulators of leaf microbiota.
The environmental data analyzed by CAP and PERMANOVA indicated that the leaves of the threeCoffea genotypes tend to accumulate lower amounts of minerals
during the reproductive stages (flowering and fructification) than in the resting period. This is in line with the findings thatC. arabicaleaves serve as source of nutri-ents to flowers and fruits (Vaastet al., 2005). By inspecting bacterial order prevalence (Figure 2), we can suggest that the highest diversity in the bacterial community was found in ‘Obatã’ andC. canephorain the blossom and early fruit periods (spring and summer). This kind of analysis (season vs. diversity) was applied in several studies (Delmotteet al., 2009; Jackson and Denney, 2011; Rastogiet al., 2012; Bodenhausenet al., 2013; Coleman-Derret al., 2016). For instance, the bacterial community ofMagnolia grandiflora in the summer season was more diverse and complex than that in other seasons (Jackson and Denney, 2011), which is similar to our results in ‘Obatã’ andC. canephora. We sug-gest that the increase of diversity in these samples can be re-lated to a possible higher content and availability of water during rainy seasons. Water availability is one of the most highly fluctuating factors on leaf surfaces and can be the modulator of microbial populations on leaves, especially epiphytic, by spreading the bacteria across the leaf surface and enabling access to nutrients (Lindow and Brandl, 2003).
Manganese- and calcium-driven microbial communities
The presence of minerals in leaves was dependent on the plant genotype and the season, indicating that the ge-netic and physiological features of the plants are able to modulate the content of minerals in leaves (Bulgarelliet al., 2013). However, when applying NMDS ordination to bio-logical data (bacterial abundance and phylogenetical ap-proach), there was a clear assembly of genotypes, but not of seasonal factors. These data show a close relationship be-tween the phyllosphere community and coffee genotypes.
When exploring the relationships among environ-mental and biological data, calcium (Ca) was one of the
Table 1- Abundance of OTUs associated with bacterial orders identified in the leaves of three coffee genotypes. Sample 1 – ‘rest’, sample 2 – ‘blossom’, sample 3 – ‘early fruit’, sample 4 – ‘late fruit’.
Sample Actinomycetales Enterobacteriales Bacillales Lactobacillales Bacteroidales Pseudomonadales
CATUAÍ 1 2 7 5 7 0 0
OBATÃ 1 0 3 0 0 0 13
CANEPHORA 1 0 23 0 0 0 0
CATUAÍ 2 6 6 19 10 0 0
OBATÃ 2 5 6 3 0 0 11
CANEPHORA 2 0 13 3 3 0 0
CATUAÍ 3 5 6 6 7 0 0
OBATÃ 3 2 4 9 9 0 11
CANEPHORA 3 1 9 10 4 3 0
CATUAÍ 4 4 6 9 9 0 0
OBATÃ 4 0 4 0 0 0 36
minerals that could statistically explain the total variation in the composition of the microbial community (around 20%). Calcium ions (Ca 2+ ) are important for plants, acting as stabilizing elements in membranes, strengthening agents in cell walls, and ubiquitous secondary messengers (Dodd et al. ,2010; Gilliham et al. ,2011). Ca 2+ plays an important role in signal transduction during rhizobacteria nodulation (Murray, 2011). In addition, it was shown to increase sur -face attachment and biofilm formation of bacteria in plants (Parker et al. ,2016). One form of Ca biomineralization is the microbial-induced calcium carbonate precipitation (MICCP) that can occur as a by-product of bacterial meta -bolic activities, such as photosynthesis, denitrification, etc. (Zhu and Dittrich, 2016). In addition, carbonate precipita -tion has been reported in bacterial cell walls and extracellular polymeric substances (EPS; Obst et al. ,2009). Calcium can also be biomineralized on calcium oxalate crystals (CaOX), which are present in leaves of tropical plants (He et al. ,2014) including coffee (Sandra Guerreiro, unpublished results). Interestingly, the enterobacteria E. coli was isolated from CaOX crystals present into human kidneys (Barr-Beare et al. ,2015). In addition, species from genus Enterobacteria are amongst the microbes that are able to biomineralize calcium (López-Moreno et al. ,2014). Therefore, we can speculate that the Bacillales at C. canephora leaves could be the cause of the presence of cal-cium. We also detected that the higher amount of Mn in ‘Obatã’ leaves in all four-season samples was positively correlated with the prevalence of Pseudomonadales. In ad-dition, Mn explained almost 49% of the total variation in the microbial community composition. Mn is essential for plants, since several photosynthetic proteins and enzymes 460 de Sousa et al. Figure 3 -Canonical analysis of principal coordinates (CAP) ordination between the environmental data and sample collection times. The environ -mental data were overlaid as vectors to improve the visualization of corre -lations. Periods: ‘rest ’1 -June 2013, ‘blossom ’2 -September 2013, ‘early fruit’ 3 – January 2014, and ‘late fruit ’ 4 – April 2014.
Table 2- Micronutrients in leaves detected by ICP-OES. Values depicted are the mean of triplicates, and minimum and maximum values (min-max)
Date Cultivar P (g/kg) K (g/kg) Ca (g/kg) Mg (g/kg) S (g/kg) Fe (mg/kg) Mn (mg/kg) Cu (mg/kg) Zn (mg/kg) B (mg/kg)
Mean (min-max) Mean (min-max) Mean (min-max) Mean (min-max) Mean (min-max) Mean (min-max) Mean (min-max) Mean (min-Max) Mean (min-max) Mean (min- max)
06/11/2013 Catuaí1 2.53 (2.5-2.7) 26.6 (27.6-25.6) 14 (16-10.4) 3.13 (3.3-2.8) 2.86 (2.9-2.8) 102.9 (125.8-85.1) 163.5 (250.2-98.5) 16.4 (18.4-13.9) 18.7 (35.9-10.0) 52.7 (59.1-46.5)
Obatã1 1.8 (1.9-1.7) 22.2 (23.8-19.9) 11.4 (13.6-10.3) 2.1 (2.3-1.9) 2.43 (2.5-2.4) 102.4 (130.4-79) 426.6 (502.1-289.6) 10.1 (10.5 - 10.0) 9.93 (11.3-9.6) 42.0 (44.2-38.5)
Canephora1 1.7 (1.9-1.5) 23 (24.3-20.9) 26 (30.2-20.3) 2.56 (3-2.2) 3.0 (3.1-2.8) 266.8 (356.3-210.5) 169.2 (179.6-159.5) 11.1 (12.5 – 8.7) 9.36 (9.7-8.9) 72.6 (87.9-64.1)
09/26/2013 Catuaí2 1.66 (1.9-1.5) 22.4 (23.9-21.6) 11.5 (12.2-11) 3.43 (3.8-3.1) 2.13 (2.4–2.0) 171.7 (187.5-162.8) 149.3 (166.4-128.2) 10.2 (12.7-8.8) 7.6 (8.8-6.5) 32.3 (35.9-30.4)
Obatã2 1.23 (1.3-1.1) 24.1 (24.9-23.7) 9.36 (10.7-8.1) 1.8 (1.9-1.6) 1.86 (2.0-1.8) 135.7 (144.7-129.5) 431.5 (442.3-419.6) 7.5 (7.7-7.2) 5.5 (5.7-5.4) 27.9 (33.4-25.2)
Canephora2 0.93 (1 -0.9) 22.9 (27.1-17.1) 23.2 (29.6-18.6) 2.5 (3.2-1.9) 2.26 (2.3-2.2) 275.6 (312.4-210.8) 182.7 (280.8-102.1) 7.0 (8.1-6.1) 7.0 (7.5-6.3) 58.7 (69.3-49.2)
01/17/2014 Catuaí3 1.36 (1.4-1.3) 22.1 (22.7-21.8) 13.2 (13.5-12.9) 3.46 (3.6-3.3) 2.23 (2.4-2.1) 73.9 (83.6-61.2) 101.1 (102.5-99.6) 11.0 (12.3-9.7) 7.9 (8.5-7.4) 48.9 (56.8-42.7)
Obatã3 1.43 (1.5-1.4) 22.1 (23.4-21.3) 8.4 (9.2-7.2) 2 (2.2-1.8) 2.13 (2.5-1.9) 60.4 (64.6-59.3) 259.8 (272.9-242.3) 12.0 (12.7-11.4) 7.63 (8.3-7.1) 45.0 (46.8-43.1)
Canephora3 1.43 (1.7-1.2) 19.1 (20.6-16.9) 10.6 (11.6-9.5) 1.73 (1.9-1.5) 1.76 (1.9-1.7) 105.9 (142.9-68.7) 106.4 (164-57.3) 10.0 (10.6-9.7) 7.4 (7.7-7.1) 28.1 (31.5-25.8)
04/13/2014 Catuaí4 1.5 (1.6-1.4) 22.0 (23.2-21.5) 15.5 (16.3-14.3) 4.26 (4.6-3.9) 1.96 (2.2-1.7) 123.9 (130.8-111.2) 120.9 (141.3-99.4) 9.93 (10.6-8.6) 8.0 (8.5-7.5) 24.7 (27.9-21.8)
Obatã4 1.43 (1.5-1.3) 24.1 (24.8-23.1) 12.6 (13.2-12.4) 2.56 (2.9-2.4) 2.0 (2.1-1.9) 134.8 (135.9-132.7) 443.5 (492.6-391.0) 9.4 (10.8-8.1) 8.0 (8.3- 7.8) 27.1 (32.4-21.5)
Figure 4- Two-dimensional non-metric multidimensional scaling (NMDS) plot of bacterial abundance in coffee genotypes, using the Bray-Curtis dis-tance measure. Biological data corresponding to bacterial abundance data (a) and environmental data (b) were overlaid as vectors to improve the visual-ization of correlations. Note the similarity of the direction of vectors ‘Pseudomonadales’ (a) and ‘Mn’ (b).
Table 3- Temperature at the time of sample collection and precipitation during the week of sample collection.
Date Min T (°C) Med T (°C) Max T (°C) Precipitation during the week (mm)
06/11/2013 – ‘rest’ 12.97 19.1 25.24 0.00
09/26/2013 – blossom’ 16.89 22.73 28.57 3.3
01/17/2014 – ‘early fruit’ 19.33 26.18 33.02 88.14
04/13/2014 – ‘late fruit’ 18.25 25.16 32.07 0.00
Table 4- PERMANOVA analyses of the environmental data associated with coffee genotypes.
df SS MS pseudo F P
Cultivar 2 35.87 17.93 4.12 0.004
Season (date of collect) 3 92.05 30.68 7.06 0.003
Residual 6 26.06 4.34
Total 11 154
df = degrees of difference, SS = sum of squares, MS = mean square
contain Mn in their structures (Anjumet al., 2015). Mn2+ uptake occurs in root cells and it is accumulated in aerial tissues (Rengel, 2000; Page and Feller, 2005), especially in leaves (Lidon, 2001). Strikingly, Pseudomonadales from the fluorescent group, such asPseudomonas putidastrains GB-1 and MnB1, oxidize soluble Mn2+ to insoluble Mn(IV) oxide that coats the cells with dark brown precipi-tates of nanoparticulate MnO2(Parkeret al., 2014). This
oxide adsorbs toxic metals and organic elements, influenc-ing the environmental cyclinfluenc-ing of these compounds (Villaloboset al., 2006). The ability of Pseudomonadales to oxidize Mn could be a competitive advantage over other bacteria in the colonization of ‘Obatã’, which in turn avoids the toxic effects of excess Mn in the leaves, such as the de-creased rate of photosynthesis (Liet al., 2010). The cause of higher Mn accumulation in ‘Obatã’ leaves in comparison to the other analyzed genotypes is unknown and deserves more investigation. The correlation between bacterial abundance and minerals suggests that high Mn can be an in-dicator of the presence of Pseudomonadales. It is also pos-sible that Mn accumulation could be a consequence of bacterial colonization by the fact that these bacteria are
known producers of biogenic Mn in biofilms (Parkeret al., 2014) and inside bacteria (Banhet al., 2013). Studying the submerged plantEgeria densa, Tsujiet al.(2017) found that Mn concentrations were much lower in plants incu-bated in hydroponic medium at various pH levels with and without Mn supplementation than in field-collected plants, suggesting that Mn bioaccumulation can be influenced by the bacterial community. It must be mentioned that P. syringaepv.garcaecauses bacterial blight of coffee (Ama-ralet al., 1956). Therefore, we suggest that the manage-ment of Mn in coffee could be used in order to modulate the positive and the negative plant-bacteria interactions.
Many Pseudomonadales are well-known PGPB, most specially those of the fluorescent group. These bacteria pro-duce IAA, an auxin that has positive effects in plant yield (Mohite, 2013). In addition, Pseudomonadales are experts in producing siderophores that sequester iron (Fe), which in turn is better assimilated by plants during stress (Cornelis, 2010). Regarding Enterobacteriales, these bacteria are of-ten described as PGPB and inhibitors of plant pathogens (Quecineet al., 2012; Walterson and Stavrinides, 2015). Hence, bacteria found as prevalent in ‘Obatã’ and C.
Canephoracan be used as plant growth promoters or
bio-logical control agents.
We cannot discard that the abiotic or biotic factors that affect plants during leaf harvest could be influencing manganese and calcium content. Manganese plays a very important role in improving stress tolerance due to their connection with reactive oxygen species (ROS) detoxifica-tion. For example, increases in activity of Mn-superoxide dismutase contributed greatly to plant tolerance to drought stress (Wanget al., 2005). Additionally, calcium increase
462 de Sousaet al.
Figure 6- Distance-based linear model (DistLM) analysis with fitted model, visualized using the distance-based redundancy analysis’ con-strained ordination (dbRDA) biplot of samples and environmental param-eter data. Samples were plotted as dbRDA coordinate scores and environ-mental data were overlaid as vectors to improve the visualization of correlations. 1 – Rest, 2 – Blossom, 3 – Early Fruit, 4 – Late Fruit.
Table 5- PERMANOVA analyses of the microbial communities associ-ated with coffee genotypes.
df SS MS pseudo F P
Cultivar 2 9628.8 4814.4 12.06 0.001 Season (date of collect) 3 2975.3 991.7 2.48 0.112 Residual 6 2395.3 339.2
Total 11 14999
df = degrees of difference, SS = sum of squares, MS = mean square
Table 6- Marginal and sequential tests (distance-based linear model, DistLM) of environmental variables and the abundance of bacterial or-ders.
Marginal tests
SS Pseudo-F P
P -73.06 -0.048 0.975
K 429.09 0.339 0.738
Ca 3382.7 2.912 0.066
Mg 1791 1.356 0.293
S 1102.2 0.793 0.477
Fe 3227.6 2.85 0.076
Mn 7700.4 10.55 0.002
Cu 510.7 0.35 0.741
Zn 123.03 0.082 0.947
B 1341.5 0.98 0.405
Sequential tests
SS Pseudo-F P
1-Mn 7700.4 10.55 0.001
2-Ca 3188.5 6.98 0.027
in cytosol is triggered by a series of environmental pro-cesses such as abiotic stress responses and plant-microbe interaction (Doddet al., 2010). However, the association of a specific bacterial order with plant genotype and mineral amount in leaves (Pseudomonadales-Obatã-Mn and Enterobacteriales-Canephora-Ca) is quite permanent along the four seasons studied (almost one year), most especially in the first case (Figure 6), suggesting that the correlation between minerals and bacteria population does not seems to be highly influenced by environmental modulations.
It is noteworthy that bacterial culture-independent methods cannot be applied for the isolation of specific bac-teria, which still depend on culture-based methods. Never-theless, we believe that our approach in investigating the diversity of leaf-associated microbiota through 16S se-quencing can give insights to field management by provid-ing an overview of bacterial communities in coffee leaves. The follow up of our work will be the evaluation of bacte-rial communities in the same coffee genotypes, but in other field locations, to confirm our sympatric analyses and ex-pand the panel of coffee leaf-associated bacteria.
Acknowledgments
We thank Dr. Monica Abreu and the team from Soil Fertility Laboratory (IAC) for ICP-OES measurements, Giullia Forti (IAC) and CEBTEC team (Esalq, USP) for se-quencing libraries, Osvaldo Reis (LaCTAD, UNICAMP) for helping in UNIFRAC analyses, Dr. Carlos Colombo (IAC) for logistic support, and the São Paulo Research Foundation (FAPESP, grant 2014/11544-4) for financial support. LPS received a fellowship from the Coordination for the Improvement of Higher Education Personnel (CAPES).
References
Amaral FJ, Teixeira C and Pinheiro ED (1956) A bacterium caus-ing halo blight of coffee. Arq Inst Biol 23:151-156. Anjum NA, Singh HP, Khan MI, Masood A, Per TS, Negi A,
Batish DR, Khan NA, Duarte AC, Pereira Eet al.(2015) Too much is bad - an appraisal of phytotoxicity of elevated plant-beneficial heavy metal ions. Environ Sci Pollut Res Int 22:3361-3382.
Banh A, Chavez V, Doi J, Nguyen A, Hernandez S, Ha V, Jimenez P, Espinoza F and Johnson HA (2013) Manganese (Mn) oxi-dation increases intracellular Mn in Pseudomonas putida GB-1. PLoS One 8:e77835.
Barr-Beare E, Saxena V, Hilt EE, Thomas-White K, Schober M, Li B, Becknell B, Hains DS, Wolfe AJ and Schwaderer AL (2015) The interaction between Enterobacteriaceae and cal-cium oxalate deposits. PLoS One 10:e0139575.
Bataglia OC, Furlani AM, Teixeira JP and Gallo JR (1983) Métodos de Análise Química de Plantas. Boletim Tecnico 78. Instituto Agronômico, Campinas, 48p.
Bodenhausen N, Horton MW and Bergelson J (2013) Bacterial communities associated with the leaves and the roots of Arabidopsis thaliana. PLoS One 8:e56329.
Bringel F and Couée I (2015) Pivotal roles of phyllosphere micro-organisms at the interface between plant functioning and at-mospheric trace gas dynamics. Front Microbiol 6:486. Bulgarelli D, Schlaeppi K, Spaepen S, Ver Loren van Themaat E
and Schulze-Lefert P (2013) Structure and functions of the bacterial microbiota of plants. Annu Rev Plant Biol 64:807-838.
Caldwell AC, Silva LC, da Silva CC and Ouverney CC (2015) Prokaryotic diversity in the rhizosphere of organic, inten-sive, and transitional coffee farms in Brazil. PLoS One 10:e0106355.
Chelius MK and Triplett EW (2001) The diversity of archaea and bacteria in association with the roots ofZea maysL. Microb Ecol 41:252-263.
Coleman-Derr D, Desgarennes D, Fonseca-Garcia C, Gross S, Clingenpeel S, Woyke T, North G, Visel A, Partida-Mar-tinez LP and Tringe SG (2016) Plant compartment and biogeography affect microbiome composition in cultivated and native Agave species. New Phytol 209:798-811. Cornelis P (2010) Iron uptake and metabolism in pseudomonads.
Appl Microbiol Biotechnol 86:1637-1645.
Delmotte N, Knief C, Chaffron S, Innerebner G, Roschitzki B, Schlapbach R, von Mering C and Vorholt JA (2009) Com-munity proteogenomics reveals insights into the physiology of phyllosphere bacteria. Proc Natl Acad Sci U S A 106:16428-16433.
Dodd AN, Kudla J and Sanders D (2010) The language of calcium signaling. Annu Rev Plant Biol 61:593-620.
dos Santos JS, dos Santos MLP and Conti MM (2010) Compara-tive study of metal contents in Brazilian coffees cultivated by conventional and organic agriculture applying principal component analysis. J Brazil Chem Soc 21:1468-1476. Gilliham M, Dayod M, Hocking BJ, Xu B, Conn SJ, Kaiser BN,
Leigh RA and Tyerman SD (2011) Calcium delivery and storage in plant leaves: exploring the link with water flow. J Exp Bot 62:2233-2250.
He H, Veneklaas EJ, Kuo J and Lambers H (2014) Physiological and ecological significance of biomineralization in plants. Trends Plant Sci 19:166-174.
Hernandez-Leon R, Rojas-Solis D, Contreras-Perez M, Orozco-Mosqueda MD, Macias-Rodriguez LI, Reyes-de la Cruz H, Valencia-Cantero E and Santoyo G (2015) Characterization
Table 7- Distance-based linear model (DistLM) analysis of variables included in the most parsimonious model for the relationship between bacterial abundance and environmental parameters.
Axis % Explained variation out of fitted model % Explained variation out of total variation
Individual Cumulative Individual Cumulative
1 - Mn 70.67 70.67 48.99 48.99
of the antifungal and plant growth-promoting effects of diffusible and volatile organic compounds produced by Pseudomonas fluorescensstrains. Biol Control 81:83-92. International Coffee Organization (2013) ICO Annual Review
2012/13. International Coffee Organization, London, 36 p. Jackson CR and Denney WC (2011) Annual and seasonal
varia-tion in the phyllosphere bacterial community associated with leaves of the southern magnolia (Magnolia grandiflora). Microbial Ecol 61:113-122.
Lepleux C, Uroz S, Collignon C, Churin JL, Turpault MP and Frey-Klett P (2013) A short-term mineral amendment im-pacts the mineral weathering bacterial communities in an acidic forest soil. Res Microbiol 164:729-739.
Li Q, Chen LS, Jiang HX, Tang N and Yang LT (2010) Effects of manganese-excess on CO2 assimilation, ribulose-1,5-bis-phosphate carboxylase/oxygenase, carbohydrates and photosynthetic electron transport of leaves, and antioxidant systems of leaves and roots in Citrus grandis seedlings. BMC Plant Biol 10:42.
Lidon F (2001) Tolerance of rice to excess manganese in the early stages of vegetative growth: Characterization of manganese accumulation. J Plant Physiol 158:1341-1348.
Lindow SE and Brandl MT (2003) Microbiology of the phyl-losphere. Appl Environ Microbiol 69:1875-1883.
Lindow SE and Leveau JH (2002) Phyllosphere microbiology. Curr Opin Biotechnol 13:238-243.
López-Moreno A, Sepúlveda-Sánchez JD, Mercedes Alonso Guzmán EM and Le Borgne S (2014) Calcium carbonate precipitation by heterotrophic bacteria isolated from bio-films formed on deteriorated ignimbrite stones: Influence of calcium on EPS production and biofilm formation by these isolates. Biofouling 30:547-560.
Lozupone C and Knight R (2005) UniFrac: A new phylogenetic method for comparing microbial communities. Appl Envi-ron Microbiol 71:8228-8235.
Maillard A, Diquélou S, Billard V, Laîné P, Garnica M, Prudent M, Garcia-Mina JM, Yvin JC and Ourry A (2015) Leaf min-eral nutrient remobilization during leaf senescence and mod-ulation by nutrient deficiency. Front Plant Sci 6:317. McCook S and Vandermeer J (2015) The Big Rust and the Red
Queen: Long-term perspectives on coffee rust research. Phytopathology 105:1164-1173.
Mohite B (2013) Isolation and characterization of indole acetic acid (IAA) producing bacteria from rhizospheric soil and its effect on plant growth. J Soil Sci Plant Nutr 13:638-649. Mondego JM, Vidal RO, Carazzolle MF, Tokuda EK, Parizzi LP,
Costa GG, Pereira LF, Andrade AC, Colombo CA, Vieira LG et al. (2011) An EST-based analysis identifies new genes and reveals distinctive gene expression features of Coffea arabica and Coffea canephora. BMC Plant Biol 11:30.
Murray JD (2011) Invasion by invitation: Rhizobial infection in legumes. Mol Plant Microbe Interact 24:631-639.
Obst M, Dynes J, Lawrence J, Swerhone G, Benzerara K, Karuna-karan C, Kaznatcheev K, Tyliszczake T and Hitchcock P (2009) Precipitation of amorphous CaCO3 (aragonite-like) by cyanobacteria: a STXM study of the influence of EPS on the nucleation process. Geochim Cosmochim Acta 73:4180-4198.
Oliveira MN, Santos TM, Vale HM, Delvaux JC, Cordero AP, Ferreira AB, Miguel PS, Tótola MR, Costa MD, Moraes CA
et al.(2013) Endophytic microbial diversity in coffee cher-ries of Coffea arabica from southeastern Brazil. Can J Microbiol 59:221-230.
Page V and Feller U (2005) Selective transport of zinc, manga-nese, nickel, cobalt and cadmium in the root system and transfer to the leaves in young wheat plants. Ann Bot 96:425-434.
Parker JK, Chen H, McCarty SE, Liu LY and De La Fuente L (2016) Calcium transcriptionally regulates the biofilm ma-chinery ofXylella fastidiosato promote continued biofilm development in batch cultures. Environ Microbiol 18:1620-1634.
Parker DL, Lee SW, Geszvain K, Davis RE, Gruffaz C, Meyer JM, Torpey JW and Tebo BM (2014) Pyoverdine synthesis by the Mn(II)-oxidizing bacterium Pseudomonas putida GB-1. Front Microbiol 5:202.
Quecine MC, Araújo WL, Rossetto PB, Ferreira A, Tsui S, Laca-va PT, Mondin M, Azevedo JL and Pizzirani-Kleiner AA (2012) Sugarcane growth promotion by the endophytic bac-teriumPantoea agglomerans33.1. Appl Environ Microbiol 78:7511-7518.
Rastogi G, Sbodio A, Tech JJ, Suslow TV, Coaker GL and Leveau JH (2012) Leaf microbiota in an agroecosystem: Spatio-temporal variation in bacterial community composition on field-grown lettuce. ISME J 6:1812-1822.
Rengel Z (2000) Manganese uptake and transport in plants. Met Ions Biol Syst 37:57-87.
Ritpitakphong U, Falquet L, Vimoltust A, Berger A, Métraux JP and L’Haridon F (2016) The microbiome of the leaf surface of Arabidopsis protects against a fungal pathogen. New Phytol 210:1033-1043.
Sera GH, Sera T, Fonseca IC and Ito DS (2010) Resistência à ferrugem alaranjada em cultivares de café. Coffee Sci 5:59-66.
Silvestrini M, Maluf MP, Silvarolla MB, Guerreiro-Filho O, Me-dina-Filho HP, Vanini MM, Oliveira AS, Gaspari-Pezzo-pane C and Fazuoli LC (2008) Genetic diversity of aCoffea Germplasm Collection assessed by RAPD markers. Genet Resour Crop Evol 55:901-910.
Sun JB, Gao YG, Zang P, Yang H and Zhang LX (2013) Mineral elements in root of wildSaposhnikovia divaricataand its rhizosphere soil. Biol Trace Elem Res 153:363-370. Telias, JR, Pahl DM, Ottesen AR and Walsh CS (2011) Bacterial
community diversity and variation in spray water sources and the tomato fruit surface. BMC Microbiol 11:81. Tsuji K, Asayama T, Shiraki N, Inoue S, Okuda E, Hayashi C,
Nishida K, Hasegawa H and Harada E (2017) Mn accumula-tion in a submerged plantEgeria densa(Hydrocharitaceae) is mediated by epiphytic bacteria. Plant Cell Environ 40:1163-1173.
Vaast P, Angrand J, Franck N, Dauzat J and Génard M (2005) Fruit load and branch ring-barking affect carbon allocation and photosynthesis of leaf and fruit ofCoffea arabicain the field. Tree Physiol 25:753-760.
Vaughan MJ, Mitchell T and McSpadden-Gardener BB (2015) What’s inside that seed we brew? A new approach to mining the coffee microbiome. Appl Environ Microbiol 81:6518-6527.
Villalobos M, Lanson B, Manceau A, Toner B and Sposito G (2006) Structural model for the biogenic Mn oxide produced byPseudomonas putida. Am Min 91:489-502.
Vilanova C, Iglesias A and Porcar M (2015) The coffee-machine bacteriome: Biodiversity and colonisation of the wasted cof-fee tray leach. Sci Rep 5:17163.
Vorholt JA (2012) Metaproteogenomic analysis of microbial communities in the phyllosphere and rhizosphere of rice. ISME J 6:1378-1390.
Walterson AM and Stavrinides J (2015)Pantoea: Insights into a highly versatile and diverse genus within the Entero-bacteriaceae. FEMS Microbiol Rev 39:968-984.
Wang FZ, Wang QB, Kwon SY, Kwak SS and Su WA (2005) En-hanced drought tolerance of transgenic rice plants express-ing a pea manganese superoxide dismutase. J Plant Physiol 162:465-472.
Yu Y, Breitbart M, McNairnie P and Rohwer F (2006) FastGroupII: A web-based bioinformatics platform for
anal-yses of large 16S rDNA libraries. BMC Bioinformatics 7:57.
Zhu T and Dittrich M (2016) Carbonate precipitation through mi-crobial activities in natural environment, and their potential in biotechnology: Review. Front Bioeng Biotechnol 4:4.
Supplementary material
The following online material is available for this article: Figure S1: Amplicons of fragments of both plant and bacte-rial 16S rDNA.
Associate Editor: Célia Maria de Almeida Soares