(Annals of the Brazilian Academy of Sciences) ISSN 0001-3765
www.scielo.br/aabc
Seasonal variation in the copepod community structure
from a tropical Amazon estuary, Northern Brazil
ANDRÉ MAGALHÃES1, NATÁLIA DA R. LEITE1, JOÃO G.S. SILVA1, LUCI C.C. PEREIRA2 and RAUQUÍRIO M. DA COSTA1
1Laboratório de Plâncton e Cultivo de Microalgas, Universidade Federal do Pará, Instituto de Estudos Costeiros,
Alameda Leandro Ribeiro s/n, Aldeia, 68600-000 Bragança, PA, Brasil
2Laboratório de Oceanografia Costeira e Estuarina, Universidade Federal do Pará, Instituto de Estudos Costeiros,
Alameda Leandro Ribeiro s/n, Aldeia, 68600-000 Bragança, PA, Brasil
Manuscript received on August 1, 2008; accepted for publication on October 7, 2008; presented byALEXANDERW.A. KELLNER
ABSTRACT
The main purpose of this study was to investigate the seasonal variation of copepod community structure during the months of July, September and November 2003 (dry season) and January, March and May 2004 (rainy season) in the Curuçá estuary, northern Brazil. Samples were collected during neap tides via gentle 200µm mesh net tows from a small powerboat. Measurements of surface water conductivity were accomplishedin situusing an electronic conductivimeter and salinity was later obtained through the transformation of the conductivity values. Salinity varied seasonally from 7.2±0.1 to 39.2±1.8 (mean±standard deviation) and was influenced mainly by differences in the amount of rainfall between the studied sampling seasons. In total, 30 Copepoda taxa were identified andAcartia tonsacomprised the most
representative species throughout the entire studied period followed byAcartia lilljeborgii,Subeucalanus pileatusand Paracalanus quasimodo. In the present study, the density values, ecological indexes and copepod species dominance
presented a clear seasonal pattern, showing that the studied area may be considered seasonally heterogeneous in relation to the investigated parameters.
Key words:copepod, salinity, ecological indexes, seasonal changes, Brazil.
INTRODUCTION
Mangrove estuaries are located in tropical and subtrop-ical regions and in these ecosystems phytoplankton and zooplankton productivity are sustained by the input of organic and inorganic nutrients originated from adjacent mangrove forests (Yáñez Arancibia et al. 1993, Schwam-born et al. 1999). In these environments copepods are usually the dominant zooplanktonic component compris-ing 60 to 80% of the total biomass (López-Ibarra and Palomares-García 2006) and playing an important role as prey for many juvenile and adult zooplanktophage fish (Schipp et al. 1999, Sommer et al. 2002) becoming a
Correspondence to: André Magalhães E-mail: [email protected]
key factor in the control of fish stock sizes (Payne and Rippingale 2001, Evjemo et al. 2003). As part of the pelagic food webs, copepods also contribute transferring energy and organic matter from the primary producers to the higher trophic levels of the aquatic system (Parsons et al. 1984). More recently, studies have also highlighted the role of copepods in the consumption of carbon pro-duced by the microbial loop (Champalbert and Pagano 2002, Sommer and Stibor 2002).
(Escribano and Hidalgo 2000, Beyst et al. 2001). The relationship between distribution of copepods and en-vironmental variables have been studied in several es-tuaries (e.g. Hassel 1986, Soetaert and Rijswijk van 1993, Sarkar and Choudhury 1998, Lawrence et al. 2004, David et al. 2007) and salinity has been shown to be (Ara 2004, Froneman 2004, Uriarte and Villate 2005, Li et al. 2006) one of the main factors controlling species devel-opment and seasonal distribution of copepods in estu-arine and mestu-arine environments because the organism’s capacity to osmoregulate affects ecological tolerances (Rippingale and Hodgkin 1977, Cervetto et al. 1999).
According to Islam et al. (2006), estuaries are of great interest for studying copepod population dynam-ics, because they are extremely dynamic and heteroge-neous ecosystems, subject to strong fluctuations in en-vironmental parameters. In the Amazon estuaries of Brazil, knowledge about copepod communities is rela-tively scarce. There is little information published on the community structure of these organisms (Krumme and Liang 2004, Magalhães et al. 2006). Therefore, the purpose of the present study was to assess the cope-pod composition and characterize seasonal density and dominance patterns as well as ecological indexes of their populations related to salinity variations in the Curuçá estuary, northern Brazil.
STUDY AREA
The Curuçá estuary is located on the Amazon littoral, north-eastern Pará State, near the city of Curuçá (00◦43′48′′S and 47◦51′06′′W) and is part of the second largest contiguous mangrove unit of the world (Kjerfve and Lacerda 1993). The predominant coastal vegetation along the margins of the Curuçá estuary is represented by three genders of mangroves: Avicennia,Rhizophora
andLaguncularia. The main hydrodynamic feature is
a maximum tidal height of 5 m in a semi-diurnal cycle, although this range can reach 6 m during the equinoc-tial spring tides (DHN 2008). The region is character-ized by a tropical hot and humid climate, which presents a pronounced seasonality with the dry season, lasting from June to December (ANA 2006). Mean air tem-perature is 27◦C, with annual rainfall values exceeding 2.000 mm (CCS 2006).
MATERIALS AND METHODS
SAMPLINGSTRATEGY ANDLABORATORYMETHODS
To assess spatial and temporal patterns of the copepods, samples were collected at four stations in the inner part of the Curuçá estuary (Fig. 1) in the neap tides of July, November and December 2003 (dry season) and Jan-uary, March and May 2004 (rainy season). The plankton tows were accomplished at sub-surface water level, us-ing a conical-cylindrical net (200µm mesh size, 50 cm diameter and 1.8 m in length) fitted with a flowmeter to estimate the volume of water filtered through the net. All samples collected were immediately conditioned in plas-tic bottles and preserved in 5% formalin, buffered with sodium tetra-borate. Only one tow was made at each sta-tion, performed with a boat for approximately 3 min at a speed of 1.5 knots, producing a total of 24 plankton sam-ples. Measurements of sub-surface water conductivity were accomplishedin situ using an electronic
conduc-tivimeter (Orion, Model 105). Salinity was later obtained through the transformation of conductivity values.
Due to the great amount of organisms present in the samples, aliquots were taken using a Folsom Plank-ton Sample Splitter according to the degree of organ-ism concentration. Under a stereoscopic microscope the copepod individuals were identified to the lowest possi-ble taxonomic level and counted, using appropriate iden-tification keys (Trégouboff and Rose 1957, Boltovskoy 1981, Bradford-Grieve et al. 1999).
ECOLOGICALINDEXES ANDSTATISTICALANALYSES
The quantitative data obtained for each sample was used to calculate absolute and relative density, as well as eco-logical indexes (diversity and evenness). The copepod diversity was calculated using the Shannon-Wiener’s index (H′, as log to the base 2) and evenness was
calcu-lated through Pielou’s index (J, as log to the base 2).
Additionally, to visualize and compare diversity profiles in different seasonal periods and between sam-pling months, K-dominance curves (Lambshead et al. 1983) were plotted. For this, species were ranked from 1 to x, with species 1 representing the largest percentage of total individuals, species 2 the second largest, etc., plotted against cumulative dominance.
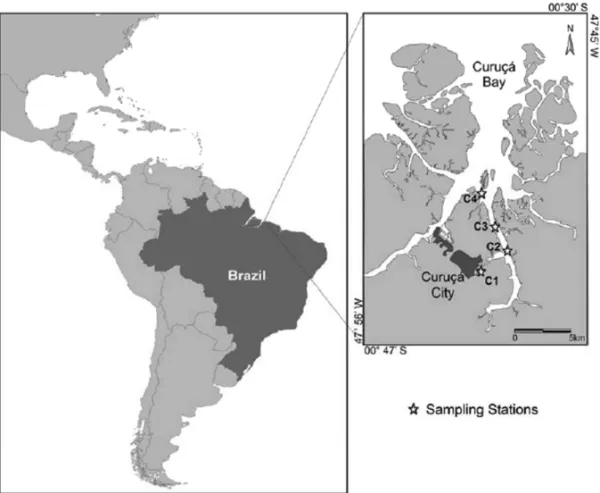
ecolog-Fig. 1 – Geographical localization showing the study area with the four sampling stations (C1, C2, C3 and C4) in the Curuçá estuary (Pará, Brazil). (Modified from Hercos and Giarrizzo 2007).
ical indexes, were log(x+1)-transformed so that their distributions approached normality. The assumption of homogeneity of variance was tested using Bartlett’s Chi-square test. Where the variances were homogeneous, one-way ANOVA with a 5% significance level was used to determine possible seasonal and spatial differences in density, diversity and evenness of copepods. However, when variances were heterogeneous, the non-parametric Mann-WhitneyU-test was applied (Zar 1999).
Spearman’s correlation coefficient was calculated to characterize the relationships between salinity, cope-pod density and ecological indexes. All these statistical analyses were conducted employing the program STA-TISTICA, version 5, computer software package.
To investigate similarities among sampling months, hierarchical agglomerative cluster analysis and non-metric multidimensional scaling (MDS) ordination were computed using the Bray-Curtis similarity index and log(x+1)-transformed density data, performed through the PRIMER (Plymouth Routines Multivariate Ecolog-ical Research) software package, version 6, following Clarke and Warwick (1994).
RESULTS
SALINITY ANDRAINFALL
In the present study, salinity, as well as density and eco-logical indexes, did not show spatially significant dif-ferences(p > 0.05)among the four sampled stations. Thus, reported values for each sampling month were pooled and have been evaluated on seasonal scales (dry/ rainy seasons).
Results showed a significant seasonal variation in sub-surface water salinity (Mann-WhitneyU-test=0.0,
Fig. 2 – Seasonal variation of salinity (means±SD) in relation to total monthly rainfall (ANA 2006) in the Curuçá estuary.
COPEPODCOMPOSITION ANDDENSITY
A total of 30 Copepoda taxa were identified (Table I). Among them, eighteen could be assigned to species level and the others were either not identified to the species level or unidentified. Monthly and seasonal distributions of copepod densities were presented (Figs. 3b, 5c and Table I).Acartia tonsa(Dana, 1849) was the taxa most represented throughout the entire study period, reaching up to 91.5% of the total copepod density registered in May, followed byAcartia lilljeborgii(Giesbrecht, 1889)
with 23.4% in September,Subeucalanus pileatus
(Gies-brecht, 1888) with 17.4% in November andParacalanus quasimodo(Bowman, 1971) with 14.9% in July.
Among the main taxa, A. tonsa (ANOVA, F = 22.1, p <0.001) and S. pileatus(ANOVA, F =17.6,
p < 0.001) showed significant seasonal differences in density patterns. Seasonal differences were also ob-served for total copepod density (ANOVA, F = 17.6,
p < 0.05). Monthly results of the copepod density, diversity and evenness were plotted against salinity (Fig. 3). The Spearman coefficient showed a significant relationship between salinity and densities of A. tonsa
(r s = −0.59, p < 0.05) andS. pileatus(r s = 0.54,
p < 0.05). On the other hand, there was no signifi-cant correlation in the case ofA. lilljeborgii(r s =0.40,
p>0.05),P. quasimodo(r s =0.30, p>0.05) and to-tal copepod densities (r s=0.37,p>0.05). In addition to the correlations between salinity and copepods diver-sity (r s=0.73, p<0.0001) and evenness (r s =0.65,
p<0.001) were all significant and positive.
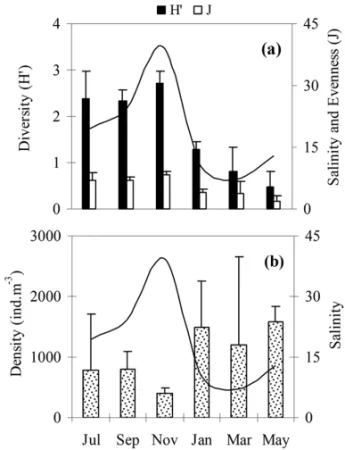
Fig. 3 – Monthly means (±SD) in copepod ecological indexes (a) and total copepod density (b) registered in the Curuçá estuary. These data were plotted against salinity (line).
COMMUNITYSTRUCTURE
Consistent seasonal patterns of diversity and evenness were evident throughout the sampling periods (Fig. 3a), and the lowest values for all of these indexes were re-corded in May.
Highly significant statistical differences were found in diversity (ANOVA, F = 79.4, p < 0.00001) be-tween the two seasons. The values increased during the dry season and decreased in the rainy season, with av-erage values oscillating between 0.47±0.33 (May) and 2.72± 0.25 (November) bits.ind–1. The accentuated decrease in diversity during rainy months was accom-panied by high total copepod densities. An opposite situation was detected for dry months. Similarly, even-ness (ANOVA,F = 37.2, p < 0.00001) showed sig-nificant seasonal difference, with average values ranged from 0.17±0.11 (May) to 0.75±0.05 (November).
TABLE I
Taxonomic composition, absolute (means±SD) and relative densities of copepods collected
during dry (July, September and November) and rainy seasons (January, March and May) in the Curuçá estuary.
Taxa Dry % Rainy %
Acartia(juveniles) 1.5±2.5 0.06 0±0 0
Acartia tonsaDana, 1849 1097.1±729.0 41.74 4853.8±814.9 85.44
Acartia lilljeborgiiGiesbrecht, 1889 435.1±275.6 16.55 208.7±99.9 3.67
Acartiasp. 0.5±0.8 0.02 0±0 0
Paracalanus quasimodoBowman, 1971 306.0±132.4 11.64 217.9±231.4 3.84
Parvocalanus crassirostris(F. Dahl, 1894) 10.5±4.4 0.40 4.1±7.0 0.07
Pseudodiaptomus marshiWright, 1936 3.6±5.7 0.14 21.7±12.0 0.38
Pseudodiaptomus richardi(F. Dahl, 1894) 0.5±0.8 0.02 9.0±8.0 0.16
Pseudodiaptomus acutus(F. Dahl, 1894) 58.4±31.5 2.22 50.3±62.9 0.89
Pseudodiaptomussp. 34.5±25.4 1.31 26.2±14.7 0.46
Labidocera(juveniles) 104.4±121.5 3.97 0±0 0
Labidocera fluviatilisF. Dahl, 1894 25.8±26.9 0.98 81.8±132.7 1.44
Calanopia americanaF. Dahl, 1894 5.0±5.7 0.20 2.7±4.0 0.05
Subeucalanus pileatus(Giesbrecht, 1888) 159.1±104.9 6.05 28.5±23.6 0.50
Centropages furcatus(Dana, 1849) 17.3±3.0 0.66 17.6±18.1 0.31
Temora longicornis(Müller, 1792) 10.0±4.3 0.38 0±0 0
Candaciasp. 0.9±1.5 0.03 0±0 0
Corycaeus speciosusDana, 1849 2.3±3.9 0.09 5.2±9.0 0.09
Corycaeus latusDana, 1849 0±0 0 0.7±1.2 0.01
Corycaeus lautusBrady, 1883 7.8±8.7 0.30 21.2±36.8 0.37
Corycaeussp. 0±0 0 1.6±2.9 0.03
Oithonaspp. 23.5±12.8 0.90 101.2±93.1 1.78
Oncaeasp. 4.8±7.8 0.18 0±0 0
Cymbasomasp. 13.9±23.6 0.53 0.7±1.2 0.01
Tisbesp. 124.0±67.3 4.72 8.7±10.1 0.15
Euterpina acutifrons(Dana, 1847) 82.2±31.6 3.13 12.7±12.2 0.22
Clytemnestra scutellataDana, 1847 0.1±0.1 b 0±0 0
Harpacticoidaa 0±0 0 6.5±9.8 0.11
Parasitic Copepodaa 0.3±0.5 0.01 0±0 0 Copepodaa(adults and juveniles) 99.0±47.4 3.77 0±0 0
aOrganisms identified to group level;bLess than 0.01%.
density distributions among both dry and rainy seasons (Fig. 4c).
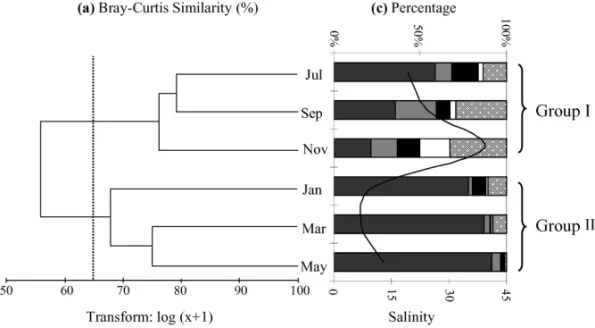
The cluster and MDS analyses performed on monthly density of taxa registered during the present study clearly showed the temporal differences in the copepod community at the Curuçá estuary. The results indicated the presence of two distinct groups at 65% sim-ilarity (Fig. 5a, b). The first group comprised the months of July, September and November (dry season). During
these three sampling months, a gradual reduction in the
A. tonsadensities was verified following an increase in
salinity. On the other hand, the second group, which corresponded to January, March and May (rainy season) showed a considerable increase inA. tonsacontributions on total copepod density, while salinity values decreased (Fig. 5c). When comparing density distribution pattern ofA. tonsawith that observed for the others main taxa
oppo-Fig. 4 – Cumulative dominance curves of copepods for dry (a) and rainy (b) sampling months and for the two seasons (c) in the Curuçá estuary.
site situation was verified. For the former, the highest density was reported during the rainy season (group II), while for the last three species these values were greater in the dry season (group I).
DISCUSSION
Sub-surface water salinity was characterized by pro-nounced seasonality, with the largest values found in the dry season. Tropical estuarine ecosystems in Brazil (Porto and Fonteles-Filho 1986, Thüllen and Berger 2000) and worldwide (Blaber 2002, Capo et al. 2006,
Lam-Hoai et al. 2006) seasonal changes in salinity are mainly influenced by rainfall distribution between the seasons. In general, decreases in pluviometric precipi-tation during the dry season caused gradual decreases in river discharges and land run-off. Consequently, it was possible to verify increases in salinity in the inner parts of these estuaries due to the input of a larger volume of coastal and marine waters in those environments.
The distributional pattern observed for total cope-pod density, with the highest values registered in the rainy season, was in part related to the behavior of A. tonsa which was the species most represented as was
also reported in many other estuarine systems (Palo-mares-García and Gómez-Gutiérrez 1996, Hoffmeyer and Torres 2001, Vieira et al. 2003). This calanoid planktonic copepod is a cosmopolitan species, common in estuaries of the Atlantic coast of South and North America (Bradford-Grieve et al. 1999), and is consid-ered an important zooplankton component in most of these estuaries showing a high degree of tolerance for environmental change.
The significant and negative correlation between salinity and density ofA. tonsa, evidenced the species preference for estuarine waters that show mesohaline characteristics (18.0 >surface salinity>5.0), accord-ing to the Venice system of classification of saline wa-ters (Anonymous 1958). Intraspecific tolerance to low and moderate salinities could explain the higher numeri-cal representativeness ofA. tonsaduring the entire rainy
season, when salinities were not accentuated.
Numerous completed studies on estuaries describe the reduction in copepod species density during the rainy season (Lansac-Tôha 1985, Mwaluma et al. 2003, Osore et al. 2004, among others). An opposite trend was verified forA. tonsain the Curuçá estuary. This
observa-tion is consistent with the one described by Ara (1998), who studied the temporal variability and production of copepods in the Cananéia Lagoon estuarine system (São Paulo, Brazil) and pointed out that the highestA. tonsa
densities were registered in February, which represents the rainy season.
Fig. 5 – Cluster (a) and MDS (b) analyses based on copepod taxa densities during dry (group I) and rainy (group II) sampling months in the Curuçá estuary. Percentage of the main taxa density (c). These data were plotted against salinity (line).
The highest densities recorded in the dry season suggest that the presence of this species in the studied area de-pends on the recruitment from the adjacent coastal zone.
A. lilljeborgii is the predominant species in
vari-ous Brazilian estuaries (Nascimento-Vieira and Eskinazi Sant’Anna 1989, Dias 1999, Silva et al. 2003). How-ever, in the present study it’s contribution to monthly and seasonal copepod density was not expressive if com-pared withA. tonsa. As observed by Sterza and Fernan-des (2006), evaluating the zooplankton community of the Vitória Bay estuarine system (southeastern Brazil), no significant correlation betweenA. lilljeborgiidensity
and salinity was found.
Dominant in most tropical and subtropical coastal
areas (Lopes et al. 1999, Eskinazi-Sant’Anna and Björn-berg 2006), P. quasimodo together with A. lilljeborgii
were the only main taxa that did not show a consis-tent seasonal pattern in terms of density. Moreover, the oceanic copepods Corycaeus speciosus (Dana, 1849), Corycaeus latus(Dana, 1849),Corycaeus lautus(Brady,
1883) andCymbasomasp. were also recorded, although
they were not numerically representative in the present study.
cope-pod diversity in rainy months was related to an increase of A. tonsa contribution for the total copepod density. A. tonsadensity was increased with the decrease in
salin-ity. This may have occurred due to the reduced contribu-tion of coastal and marine waters during rainy months. The opposite was detected for dry months. Copepod di-versity values obtained in the Curuçá estuary tended to be greater than those observed in other estuaries world-wide (Hsieh and Chiu 1997, Islam et al. 2006).
Evenness presented a similar trend to diversity, with both parameters increasing with salinity values. The de-cline of these parameters in the rainy season indicated the presence of lower “stability” condition for the es-tuary, when compared with the dry season. Thus, the situation in the latter is completely different. The cope-pod community structure is relatively more diverse and the salinity influence on this community is greatest.
Monthly and seasonal changes in the balance of rel-ative density of four main copepod species as visualized in the K-dominance curves, directly affect the behavior of ecological indexes. In particular, changes inA. tonsa
contribution in the studied period were strongly respon-sible for alterations in these indexes. The present study has shown a clear seasonal pattern in density, diversity and evenness of copepod community and salinity values, which had been confirmed by plots of cluster and multi-dimensional scaling (MDS). Therefore, the studied area may be considered spatially uniform and seasonally het-erogeneous in relation to these parameters. Nevertheless, further investigations on biomass and copepod commu-nity production in the Curuçá estuary should be assessed for providing a better understanding of the trophic struc-ture of this ecosystem.
ACKNOWLEDGMENTS
We are grateful to Hector Hernán Martinez Baeza for English improvements to the manuscript. This work was supported by Conselho Nacional de Desen-volvimento Científico e Tecnológico (CNPq) (Processes #23116.000272/2002-88, #552126/05-5 and #563967/ 2005-6). The authors Luci Cajueiro Carneiro Pereira and Rauquírio Marinho da Costa would like to thank CNPq (Brazil) for their research grants (#304392/2005-7 and #308953/2006-1, respectively).
RESUMO
O presente estudo teve como objetivo principal avaliar a va-riação sazonal na estrutura da comunidade dos copépodos du-rante os meses de julho, setembro e novembro de 2003 (período seco) e janeiro, março e maio de 2004 (período chuvoso) no estuário do Curuçá, Norte do Brasil. As amostras foram co-letadas nas marés de quadratura com auxílio de uma rede de plâncton com 200µm de abertura de malha, rebocada por meio de uma pequena embarcação a motor. As medidas de con-dutividade da água foram realizadasin situutilizando-se um condutivímetro eletrônico e a salinidade foi posteriormente obtida através da transformação dos valores de condutividade. Os valores de salinidade variaram sazonalmente de 7,2±0,1 a 39,2±1,8 (média±desvio padrão), tendo sido principal-mente influenciados pelas diferenças nas taxas de precipitação entre os períodos de amostragem estudados. Foram identifi-cados no total 30 táxons, comAcartia tonsa constituindo a
espécie mais representativa durante todo o período de estudo, seguida porAcartia lilljeborgii,Subeucalanus pileatuse Para-calanus quasimodo. Durante este trabalho, os valores de densi-dade, índices ecológicos e dominância das espécies de copépo-dos apresentaram um padrão sazonal claro, mostrando que a área estudada pode ser considerada sazonalmente heterogênea em relação a estes parâmetros investigados.
Palavras-chave: copépodos, salinidade, índices ecológicos, mudanças sazonais, Brasil.
REFERENCES
AGÊNCIANACIONAL DEÁGUAS(ANA). 2006. Climato-logical data (1990-2004). Agência Nacional de Águas, Brasília, DF, Brasil.
ANONYMOUS. 1958. Venice system. Supplement to the Symposium on the classification of brackish waters. Arch Oceanogr Limnol 11 (Suppl): 1–248.
ARAK. 1998. Variabilidade temporal e produção dos copé-podos no complexo estuarino-lagunar de Cananéia, São Paulo, Brasil. Ph.D. Thesis, Universidade de São Paulo, Brasil. 308 pp.
ARA K. 2004. Temporal variability and production of the planktonic copepod community in the Cananéia Lagoon estuarine system, São Paulo, Brazil. Zool Stud 43: 179– 186.
BJÖRNBERGTKS. 1981. Copepoda. In: BOLTOVSKOYD (Eds), Atlas del Zooplancton del Atlantico Sudoccidental y Métodos de Trabajo con el Zooplancton Marino, Mar del Plata: Instituto Nacional de Investigación y Desarrollo Pesquero, p. 587–679.
BLABERSJM. 2002. Fish in hot water: the challenges facing fish and fisheries research in tropical estuaries. J Fish Biol 61: 1–20.
BOLTOVSKOYD. 1981. Atlas del zooplancton del Atlántico Sudoocidental y métodos de trabajos con el zooplancton marino, Mar del Plata: Instituto Nacional de Investigación y Desarrollo Pesquero, 936 p.
BRADFORD-GRIEVEJM, MARKHASEVAEL, ROCHACEF ANDABIAHYB. 1999. Copepoda. In: BOLTOVSKOYD (Eds), South Atlantic Zooplankton, Netherlands: Back-huys, p. 869–1098.
CAPOS, SOTTOLICHIO A, BRENONI, CASTAING PAND FERRYL. 2006. Morphology, hydrography and sediment dynamics in a mangrove estuary: the Konkoure Estuary, Guinea. Mar Geol 230: 199–215.
CERVETTOG, GAUDYRANDPAGANOM. 1999. Influence of salinity on the distribution ofAcartia tonsa(Copepoda, Calanoida). J Exp Mar Biol Ecol 239: 33–45.
CHAMPALBERTGANDPAGANOM. 2002. Copepod feeding in a tuna fishery area of the tropical Atlantic Ocean. CR Biol 325: 171–177.
CLARKE KR ANDWARWICKRM. 1994. Changes in ma-rine communities: an approach to statistical analysis and interpretation, United Kingdom: Plymouth Marine Labo-ratory, 144 p.
COORDENADORIA DECOMUNICAÇÃOSOCIAL DOGOVER -NO DO ESTADO DOPARÁ(CCS). 2006. Município de Curuçá. Produced by Start Comunicação e Informática. Available at http://www.governodopara.pa.gov.br/conhe-caopara/curucal.asp.
DAVID V, SAUTOURBANDCHARDYP. 2007. Successful colonization of the calanoid copepodAcartia tonsain the
oligo-mesohaline area of the Gironde estuary (SW France) – Natural or anthropogenic forcing? Est Coast Shelf Sci 71: 429–442.
DIAS CO. 1999. Morphological abnormalities ofAcartia lilljeborgi (Copepoda, Crustacea) in the Espírito Santo
Bay (ES, Brazil). Hydrobiologia 394: 249–251. DIRETORIA DE HIDROGRAFIA E NAVEGAÇÃO (DHN).
2008. Tábua das marés para 2008. Fundeadouro de Sali-nópolis (Estado do Pará). Available at
http://www.mar.mil.br/∼dhn/tabuas.
ESCRIBANORANDHIDALGOP. 2000. Spatial distribution of copepods in the North of the Humboldt Current region off Chile during coastal upwelling. J Mar Biol Assoc UK 80: 283–290.
ESKINAZI-SANT’ANNAEMANDBJÖRNBERGTKS. 2006. Seasonal dynamics of mesozooplankton in Brazilian coastal waters. Hydrobiologia 563: 253–268.
EVJEMOJO, KJELLIRANDOLSENY. 2003. Copepods as live food organisms in the larval rearing of halibut larvae (Hippoglossus hippoglossusL.) with special emphasis on the nutritional value. Aquaculture 227: 191–210. FRONEMAN PW. 2004. Zooplankton community structure
and biomass in a southern African temporarily open/closed estuary. Est Coast Shelf Sci 60: 125–132.
HASSELA. 1986. Seasonal changes in zooplankton composi-tion in the Barents Sea, with special attencomposi-tion toCalanus
spp. (Copepoda). J Plankton Res 8: 329–339.
HERCOSAPANDGIARRIZZOT. 2007. Pisces, Syngnathi-dae,Hippocampus reidi: filling distribution gaps. Check List 3: 287–290.
HOFFMEYER MS ANDTORRESER. 2001. Morphometric variables and individual volume of Eurytemora
ameri-cana andAcartia tonsafemales (Copepoda, Calanoida)
from the Bahía Blanca estuary, Argentina. Hydrobiologia 459: 73–82.
HSIEHC-HANDCHIUT-S. 1997. Copepod abundance and species composition of Tanshui River Estuary and adjacent waters. Acat Zool Taiwan 8: 75–83.
ISLAM MDS, UEDA H AND TANAKA M. 2006. Spatial and seasonal variations in copepod communities related to turbidity maximum along the Chikugo estuarine gradi-ent in the upper Ariake Bay, Japan. Est Coast Shelf Sci 68: 113–126.
KJERFVEBANDLACERDALD. 1993. Mangroves of Brazil. In: LACERDA LD (Eds), Conservation and Sustainable Utilization of Mangrove Forest in Latin America and Africa Regions. Part I – Latin America. Mangrove Eco-system Technical Report No. 2, Okinawa: International Tropical Timber Organization/International Society for Mangrove Ecosystems, p. 245–272.
KRUMMEUANDLIANGT-H. 2004. Tidal-induced changes in a copepod-dominated zooplankton community in a macrotidal mangrove channel in Northern Brazil. Zool Stud 43: 404–414.
LAM-HOAIT, GUIRALDANDROUGIERC. 2006. Seasonal change of community structure and size spectra of zoo-plankton in the Kaw River estuary (French Guiana). Est Coast Shelf Sci 68: 47–61.
LANSAC-TÔHAFA. 1985. Ecologia do zooplâncton do es-tuário do Rio Una do Prelado (São Paulo, Brasil). Ph.D. Thesis, Universidade de São Paulo, Brazil. 195 p. LAWRENCED, VALIELAIANDTOMASKYG. 2004.
Estu-arine calanoid copepod abundance in relation to season, salinity, and land-derived nitrogen loading, Waquoit Bay, MA. Est Coast Shelf Sci 61: 547–557.
LIKZ, YINJQ, HUANGLMANDTANYH. 2006. Spatial and temporal variations of mesozooplankton in the Pearl River estuary, China. Est Coast Shelf Sci 67: 543–552. LOPESRM, BRANDINIFPANDGAETASA. 1999.
Distri-bution patterns of epipelagic copepods off Rio de Janeiro (SE, Brazil) in summer 1991/1992 and winter 1992. Hy-drobiologia 411: 161–174.
LÓPEZ-IBARRA GA ANDPALOMARES-GARCÍA R. 2006. Estructura de la comunidad de copépodos en Bahía Mag-dalena, México, durante El Niño 1997-1998. Rev Biol Mar Oceanogr 411: 63–76.
MAGALHÃESA, COSTARM, LIANGT-H, PEREIRALCC ANDRIBEIROMJS. 2006. Spatial and temporal distri-bution in density and biomass of twoPseudodiaptomus
species (Copepoda: Calanoida) in the Caeté River Estu-ary (Amazon region – North of Brazil). Braz J Biol 66: 421–430.
MWALUMAJ, OSOREM, KAMAUJANDWAWIYEP. 2003. Composition, abundance and seasonality of zooplankton in Mida Creek, Kenya. Western Indian Ocean J Mar Sci 2: 147–155.
NASCIMENTO-VIEIRA DA AND ESKINAZI SANT’ANNA EM. 1989. Composição do zooplâncton no estuário do Rio Timbó (Pernambuco – Brasil). Trabhs Oceanogr Univ Fed Pernambuco 20: 77–98.
OSORE MKW, MWALUMAJM, FIERSF ANDDAROMH. 2004. Zooplankton composition and abundance in Mida Creek, Kenya. Zool Stud 43: 415–424.
PALOMARES-GARCÍARANDGÓMEZ-GUTIÉRREZJ. 1996. Copepod community structure at Bahia Magdalena, Mexico during El Niño 1983-84. Est Coast Shelf Sci 43: 583–595.
PARSONSTR, TAKAHASHIM AND HARGRAVE B. 1984. Biological Oceanographic Processes, Oxford: Pergamon Press, 332 p.
PAYNEMF ANDRIPPINGALERJ. 2001. Effects of salin-ity, cold storage and enrichment on the calanoid copepod
Gladioferens imparipes. Aquaculture 201: 251–262.
PORTOHLRANDFONTELES-FILHOAA. 1986. Estudo de densidade e biomassa de camarões do gêneroPenaeus, na ilha de São Luiz, Estado do Maranhão. Bol Lab Hidrobiol São Luís 7: 42–70.
RIPPINGALERJANDHODGKINEP. 1977. Food availability and salinity tolerance in a brackish water copepod. Aust J Mar Freshw Res 28: 1–7.
SARKAR SKAND CHOUDHURY A. 1998. Distribution of inshore copepod of the Bay of Bengal off Sagar Island: A multivariate analysis. Trop Ecol 29: 146–158.
SCHIPPGR, BOSMANSJMPANDMARSHALLAJ. 1999. A method for hatchery culture of tropical calanoid copepods,
Acartiaspp. Aquaculture 174: 81–88.
SCHWAMBORNR, VOSSM, EKAUWANDSAINT-PAULU. 1999. Stable isotope composition of particulate organic matter and zooplankton in North-East Brazilian shelf wa-ter. Arch Fish Mar Res 47: 201–210.
SILVATA, NEUMANN-LEITÃOS, SCHWAMBORNR, GUS -MÃOLMOANDNASCIMENTO-VIEIRADA. 2003. Diel and seasonal changes in the macrozooplankton commu-nity of a tropical estuary in Northeastern Brazil. Rev Bras Zool 20: 439–446.
SOETAERTKANDRIJSWIJK VANP. 1993. Spatial and tem-poral patterns of the zooplankton in the Westerschelde estuary. Mar Ecol Prog Ser 97: 47–59.
SOMMERUANDSTIBORH. 2002. Copepoda – Cladocera – Tunicata: the role of three major mesozooplankton groups in pelagic food webs. Ecol Res 17: 161–174.
SOMMERU, STIBORH, KATECHAKISA, SOMMERFAND HANSEN T. 2002. Pelagic food web configurations at different levels of nutrient richness and their implications for the ratio fish production: primary production. Hydro-biologia 484: 11–20.
STERZAJMANDFERNANDESLL. 2006. Zooplankton com-munity of the Vitória Bay estuarine system (Southeastern Brazil). Characterization during a three-year study. Braz J Oceanogr 54: 95–105.
THÜLLEN N AND BERGER U. 2000. A comparative ex-amination of environmental factors at patchy mangrove seedling stands on the peninsula of Bragança, Northern Brazil. Ecotropica 6: 1–12.
URIARTEIANDVILLATEF. 2005. Differences in the abun-dance and distribution of copepods in two estuaries of the Basque coast (Bay of Biscay) in relation to pollution. J Plankton Res 27: 863–874.
VIEIRAL, AZEITEIROU, RÉP, PASTORINHOR, MARQUES JC ANDMORGADO F. 2003. Zooplankton distribution in a temperate estuary (Mondego estuary southern arm: Western Portugal). Acta Oecol 24: 163–173.
YÁÑEZARANCIBIAA, LARA-DOMINGUEZALANDDAY JW. 1993. Interactions between mangrove and seagrass habitats mediated by estuarine nekton assemblages: cou-pling of primary and secondary production. Hydrobiolo-gia 264: 1–13.