ISSN: 0010-3624 print / 1532-2416 online DOI: 10.1080/00103624.2011.607731
Changes of Nutritional Status during
a Phenological Cycle of Coffee under High
Nitrogen Supply by Fertigation
ANA PAULA NETO,
1JOSÉ LAÉRCIO FAVARIN,
1RODRIGO ESTEVAM MUNHOZ DE ALMEIDA,
1CARLOS TADEU DOS SANTOS DIAS,
1TIAGO TEZOTTO,
1ANDRÉ LUÍS GARCIA ALVES,
1AND
MILTON FERREIRA MORAES
21Luiz de Queiroz College of Agriculture, University of Sao Paulo, Piracicaba, Brazil
2Federal University of Parana, Campus Palotina, Palotina, Brazil
High-technology coffee cultivation systems involving fertigation commonly apply high rates of nitrogen (N). However, there is little information on the plants’ uptake of N under these conditions. The objective of this study was to evaluate the changes in the nutritional status of coffee plants during a phenological cycle in response to N applied by fertigation. The study was conducted with 7-year-old trees of Coffea arabicaL., under pivot irrigation and fertigation, with five N rates (0, 200, 400, 600, and 800 kg ha−1) applied on the plants. The changes in nutritional status were monitored
dur-ing the phenological cycle, and the yield was measured at the end of the cycle. The N concentration increased with the N rates and varied with the phenological period, with the greatest concentration occurring during anthesis, the same as for the sulfur level. However, N rate did not affect the concentrations of other nutrients. The great-est concentrations of phosphorus, calcium, and magnesium were obtained in the final fructification phases and for potassium in the initial phases. Micronutrient concentra-tions were greater in the vegetative phases and anthesis but were reduced in the fruit-formation phase and increased again when the berries started to mature. The maximum yield, considering a relative production of 90%, was obtained with application of 415 kg ha−1of N. Leaf concentrations of N were directly related to the N rates, showing that
the nutritional status of coffee plants can be evaluated in the ripening phase to adjust the fertilization parameters for the next year.
Keywords Coffea arabica, macronutrients, micronutrients, ripening phase
Introduction
Coffee growing in tropical regions of Brazil is very technology intensive, with the appli-cation of high rates of nitrogen (N) by fertigation. The plants show high vegetative growth rates and average yields of 40 60-kg bags ha−1 year−1 (CONAB 2010). The growing
Received 27 September 2010; accepted 15 May 2011.
Address correspondence to M. F. Moraes, Federal University of Parana, Campus Palotina, Rua Pioneiro, 2153, Jardim Dallas, CEP 85950-000, Palotina, PR, Brazil. E-mail: moraesmf@ yahoo.com.br
2414
Nutritional Status of Coffee 2415
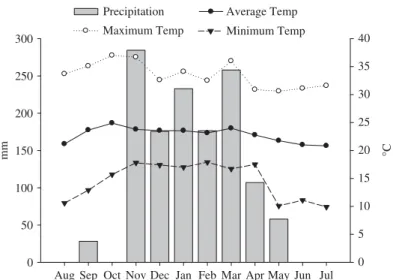
conditions are propitious in these regions because of the high number of light-hours, little cloud cover, and average temperature of 20◦C in the autumn and winter (AIBA 2008).
The N is the nutrient required in greatest quantity by coffee plants. It participates in the synthesis of both structural and enzymatic proteins, which are in turn responsible for the synthesis of other proteins as well as metabolic intermediaries and components of the cell structure, such as carbohydrates, lipids, and pigments (Barker and Bryson 2006). These compounds make up the plant’s structure and are required for cell growth and fruiting (Lemaire et al. 1992; Lawlor 1995).
Coffee plants complete the phenological cycle in 2 years. In the first year, the vegeta-tive branches are formed with axillary buds, which become reproducvegeta-tive buds in the second year, when the plants flower. The same plant generally has branches in the vegetative and reproductive phase, the latter composed of anthesis, formation of pinhead drop, expansion, grain filling, and maturation (Camargo and Camargo 2001). Because the demands for nutri-ents vary with the reproductive phase and these occur at different periods of the year, they are influenced by climate factors such as temperature (Larcher 2004), water availability, and altitude (Laviola et al. 2008) as well as by the nutritional needs of the plants.
During the reproductive phase, the berries act as preferential sink of carbohydrates and mineral nutrients, possibly causing a lack of these nutrients in other plant organs. Micronutrients, although only required in small quantities, play a fundamental role in plant metabolism as constituents of enzymes or their activators (Carvalho et al. 1993).
The supply of nutrients must meet the needs of the berries and vegetative organs, and that fertilization should come before the periods of peak nutrient demand. Measuring the concentration of nutrients in the leaves of coffee plants during the phenological phases is an important tool to diagnose the nutritional status and to identify the best periods for fertilization.
Coffee growers in the western part of Bahia State, Brazil, generally apply high N rates, between 600 and 800 kg ha−1, but without knowing the possible interference in
the uptake and accumulation of other nutrients. Besides this, the application of high N rates can increase losses by lixiviation, volatilization, and denitrification or erosion (Peoples et al. 1995). These losses can be minimized by synchronizing the fertilizer application with the plant’s demand (Matson, Naylor, and Ortiz-Monasterio 1998; Panek et al. 2000).
The aim of this work was to evaluate the changes in the nutritional status of coffee plants grown in a technology-intensive system during a single phenological cycle, from end of the vegetative phase to final maturation, in response to N supplied by fertigation.
Material and Methods
A field experiment was conducted between August 2008 and July 2009 on the Morena Farm, owned by the Arakatu Ltda. agribusiness group, located in the municipality of Luiz Eduardo Magalhães, Bahia State, Brazil. The plants were of the speciesCoffea arabicaL.,
variety Catuaí Vermelho H-2077-144, 7 years of age, growing with spacing of 3.8×0.5 m (5,263 plants per hectare). Coffee trees were arranged circularly, with a central pivot for directed irrigation and fertigation. The region’s climate is classified as Aw or savanna on the Köppen scale, with hot and wet summers and cool and generally dry winters. The experimental area is located at the coordinates 11◦ 46$ 32$ $ S and 45◦ 43$ 32$ $ W, at an
altitude of 740 m, and has average annual temperature of 23◦C and rainfall of 1,500 mm
(Figure 1). The soil is classified as Oxisol (Red-Yellow Latosol), with medium texture. The results of the chemical analysis of the soil are shown in Table 1.
Aug Sep Oct Nov Dec Jan Feb Mar Apr May Jun Jul
mm
0 50 100 150 200 250 300
°
C
0 5 10 15 20 25 30 35 40 Precipitation Average Temp
Maximum Temp Minimum Temp
Figure 1. Time course of monthly mean precipitation and air temperature from August 2008 through
July 2009.
Fertigation was by low-energy precision application (LEPA), in which water is sprin-kled locally on the rows of plants. Coffee trees were irrigated throughout the year, except during harvest, with application of an average of 3 to 4 mm day−1 on alternate days.
Fertigation with N was applied every 15 days, starting on 1 August 2008 and ending on 17 July 2009.
Plots were composed of three central plants with four bordering plants on each side. The experimental setup was completely randomized with the plots subdivided in time, with five treatments and four replicates. The treatments corresponded to the following rates of N: T0, no N application; T1, 200 kg ha−1, equivalent to 38 g of N per plant; T2, 400 kg ha−1; T3, 600 kg ha−1; and T4, 800 kg ha−1. All plants also received 380 kg ha−1of potassium (K), 2.4 kg ha−1of zinc (Zn), 6.7 kg ha−1of boron (B), 9.8 kg ha−1 of manganese (Mn),
and 0.6 kg ha−1of copper (Cu), supplied from September 2008 to June 2009 by fertigation.
Samples to evaluate the nutritional status were obtained during the phenological phases, for a total of six collections: vegetative phase (VG), 56 days before anthesis (−56); anthesis (A) (0); pinhead drop (PD) (42 days after anthesis, DAA); rapid expansion (RE) and grain filling (GF) (126 to 168 DAA); and maturation (M) (266 DAA). Leaves of the third pair at midplant height were collected, stored in liquid N, lyophilized, and ground to determine the nutrient concentration.
Total N was determined by the semi-micro-Kjeldahl analytic method after sulfuric acid digestion (Jackson 1958; Bremner and Edwards 1965). Leaf concentrations of phosphorus (P), K, calcium (Ca), magnesium (Mg), sulfur (S), iron (Fe), Mn, Zn, and Cu were deter-mined after nitroperchloric digestion (Johnson and Ulrich 1959). Phosphorus concentration was determined by metavanadate colorimetry; K concentration by flame emission photom-etry; Ca, Mg, Fe, Zn, and Cu by atomic absorption spectrophotometry (AOAC 1975); and sulfur (S) by barium sulfate turbidimetry (Jackson 1958). Finally, the B concentration was analyzed after dry ashing digestion (calcination in a muffle oven at 550 ◦C) and
deter-mined by the azomethine-H colorimetry method (Bingham 1982). Grains from each plot were harvested and weighed to calculate the yield in 60-kg bags per hectare.
Statistical analyses were performed using the Statistical Analysis System (SAS) soft-ware for Windows 6.11 (SAS 1996). Variance analysis (F-test) was employed to evaluate
Table 1
Soil chemical characterization of the experimental site in different depthsa
OM P S K Ca Mg Al H+Al SB CEC N total B Cu Fe Mn Zn
Depth pH (g (mg (mg (mmolc (mmolc (mmolc (mmolc (mmolc (mmolc (mmolc V M (mg (mg (mg (mg (mg (mg
(cm) (CaCl2) dm−3) dm−3) dm−3) dm−3) dm−3) dm−3) dm−3) dm−3) dm−3) dm−3) (%) (%) dm−3) dm−3) dm−3) dm−3) dm−3) dm−3)
0–20 4.7 25 114 10 2.0 23 9 3 31 34.0 65.0 52 8 1080 0.74 9.6 82 3.1 3.6
20–40 3.6 20 40 21 1.0 5 3 9 34 9.0 43.0 21 50 620 0.61 2.2 57 2.3 2.7
40–60 3.8 16 5 60 0.8 4 2 9 31 6.8 37.8 18 57 532 0.56 0.4 24 0.5 0.8
60–80 3.6 14 1 72 0.8 3 1 9 31 4.8 35.8 13 65 520 0.45 0.1 15 0.3 0.4
80–100 3.8 14 1 96 0.8 2 1 10 31 3.8 34.8 11 72 505 0.39 0.1 11 0.2 0.6
aAnalyzed according to Raij et al. (2001); OM, organic matter; H+Al, potential acidity; SB, sum of bases; CEC, cation exchange capacity; V, base saturation; and m, aluminum saturation.
2417
the significance of the treatments, and Tukey’s test was used for means separation. Data of the processed grain yield were analyzed by regression.
Results and Discussion
There was a significant interaction between N rates and phenological cycle of coffee plants for leaf concentration of N. Leaf concentrations of the other nutrients did not vary with the N dose, although they did vary during the cycle (Table 2).
At the start of the N applications (August 2008), coffee plants were in the vegetative stage and showed a smaller concentration of the nutrient (Figure 2). This can be attributed to remobilization of nitrogenated compounds to the berries that had been collected in the previous harvest. The increase in the N concentration during anthesis was partly due to the effect of N fertilization, started 70 days before the evaluation. Besides this, the greatest temperatures and water availability occurred in this phase (Figure 1). Part of the N also may have come from the mineralization of the N present in the soil (Pilbeam and Warren 1995), suggested by the increased N concentration even before this nutrient was applied. Another explanation for the increased N concentration during anthesis can be redistribu-tion of nitrogenated compounds from other organs, such as the roots, stem, and branches, which store compounds in the winter that are redistributed at the start of the rainy season (DaMatta, Amaral, and Rena 1999). The maximum leaf N concentration occurred in the pinhead drop phase, irrespective of the N dose applied (Figure 2).
On the other hand, Laviola et al. (2009), in an experiment started slightly later (November 2008), observed an increase in the leaf N concentration only starting in the pinhead drop phase, with the greatest concentration 173 days after anthesis (maturation). These findings indicate the importance of starting N fertilization before anthesis, as in the
Table 2
Summary of the statistical analyses for dose, phenology, and interaction between N rate and phenology
Interaction dose vs.
Variable N rate Phenology phenology
N 0.0250∗
<0.0001∗ 0.0446∗
P 0.4365 <0.0001∗ 0.5703
K 0.1807 <0.0001∗ 0.6388
Ca 0.1431 <0.0001∗ 0.8736
Mg 0.7259 <0.0001∗ 0.1669
S 0.9608 <0.0001∗ 0.3502
B 0.2309 <0.0001∗ 0.7866
Cu 0.5892 <0.0001∗ 0.4126
Fe 0.2211 <0.0001∗ 0.2320
Mn 0.5951 <0.0001∗ 0.3269
Zn 0.4517 <0.0001∗ 0.6343
Yield 0.0656! — —
∗Significant at the 5% level by the F-test.
!Significant at the 10% probability level by the Tukey test.
Nutritional Status of Coffee 2419
Days before and after anthesis
–56 0 42 126 168 266
N (g kg
–1)
22 24 26 28 30 32 34 36
0 200 400 600 800 VG Anthesis
d a
b
cd bc
bc MA GF
PD RE
Figure 2. Changes in foliar N concentration during a phenological cycle of coffee as related to N
supply (kg ha−1).
present study, to prevent deficiency or excessive remobilization of the nutrient from the leaves to the fruits in the initial fruit-formation phases.
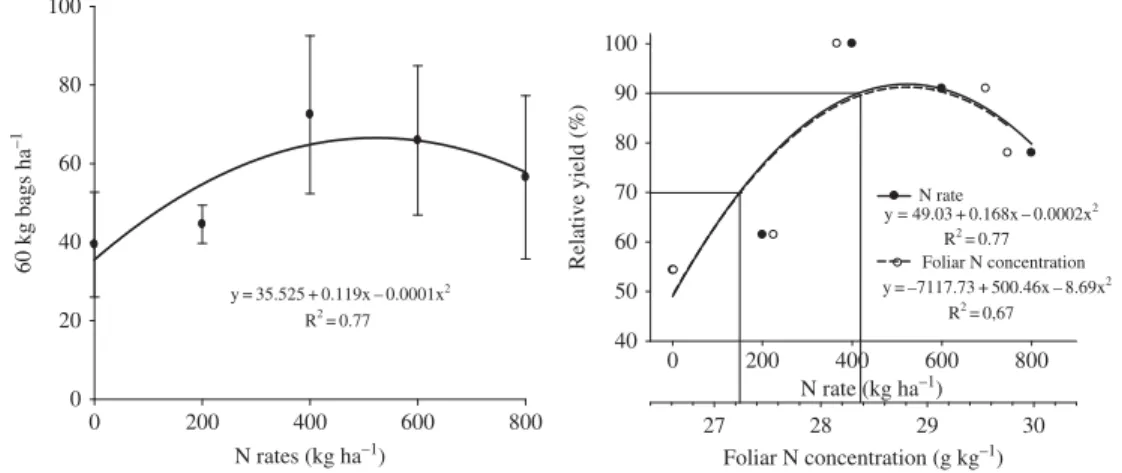
Starting with the formation of pinhead drop, the N concentration in the leaves declined (Figure 2) because its redistribution to the fruits in the following stages until grain filling, due to the demand for nutrients for fruit formation. Similar results were observed by Rena, Barros, and Maestri (2001). Higher N requirement during fruit formation is due to its func-tion as a constituent of amino acids and proteins. A reducfunc-tion in the N concentrafunc-tion also occurred because of the high productivity, which ranged from 39 to 72 bags (60-kg) ha−1
(Figure 3).
Leaves had N concentrations ranging from 24 to 34 g kg−1and showed no visual signs
of N deficiency. The adequate N concentration to evaluate the nutritional status of coffee plants, according to Malavolta, Vitti, and Oliveira (1997), varies from 29 to 32 g kg−1,
sampled in the pinhead drop stage. The yield corresponding to 90% of the relative produc-tion (Fageria 2009) in funcproduc-tion of the N rates was obtained with supply of 415 kg ha−1
N rates (kg ha–1)
0 200 400 600 800
60 kg bags ha
–1
0 20 40 60 80 100
y=35.525+0.119x–0.0001x2
R2
=0.77
N rate (kg ha–1)
0 200 400 600 800
Relative yield (%)
40 50 60 70 80 90 100
Foliar N concentration (g kg–1)
27 28 29 30
N rate
y = 49.03+0.168x–0.0002x2
R2=0.77
Foliar N concentration y=–7117.73+500.46x–8.69x2
R2
=0,67
Figure 3. Coffee yield in relation to N supply and foliar N concentration.
of N (Figure 3). Based on the results of this work, for coffee-growing operations using fertigation, we suggest an adequate N range of 27.2 to 28.4 g kg−1, with sampling during
the fruit-ripening phase (maturation). This latter analysis will serve to plan the fertilization for the next production season. In this case, the branch sampled will be the same that will produce the next harvest.
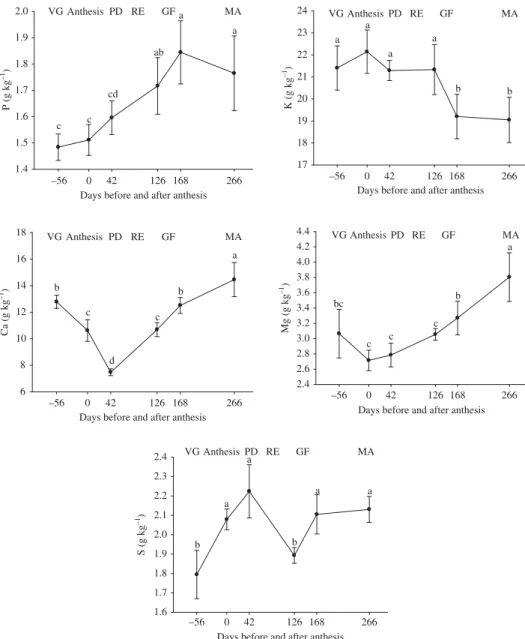
Phosphorus concentration was greatest in the final fruit development phases (grain filling and maturation) (Figure 4). This indicates that the supply of P by the soil and its uptake by roots met the demand of leaves and developing fruits, since starting from the pinhead drop stage, when the fruits require the most nutrients. Phosphorus concentration increased to levels considered adequate (Malavolta, Vitti, and Oliveira 1997). Phosphorus
Days before and after anthesis
–56 0 42 126 168 266
Days before and after anthesis
–56 0 42 126 168 266
Days before and after anthesis
–56 0 42 126 168 266
Days before and after anthesis
–56 0 42 126 168 266
Days before and after anthesis
–56 0 42 126 168 266
P (g kg
–1) 1.4 1.5 1.6 1.7 1.8 1.9
2.0 VGAnthesis PD RE GF MA
c c
cd ab
a
a
K (g kg
–1) 17 18 19 20 21 22 23
24 VGAnthesis PD RE GF MA a
a a
b b
Ca (g kg
–1) 6 8 10 12 14 16
18 VGAnthesis PD RE GF MA
b c d c b a
Mg (g kg
–1) 2.4 2.6 2.8 3.0 3.2 3.4 3.6 3.8 4.0 4.2
4.4 VGAnthesis PD RE GF MA
bc
c c c
b
a
S (g kg
–1) 1.6 1.7 1.8 1.9 2.0 2.1 2.2 2.3
2.4 VGAnthesis PD RE GF MA
a a a a b b a
Figure 4. Foliar concentrations of P, K, Ca, Mg, and S during a phenological cycle of coffee.
Nutritional Status of Coffee 2421
concentration increased along with that of Mg (Figure 4), which corroborates the func-tion of Mg as a carrier of P, because of its participafunc-tion in the activafunc-tion of membrane ATPase, necessary for active P uptake (Marschner 1995; Malavolta 2006). Therefore, P should be applied in a single dose before anthesis, considering its importance for the reproductive phase.
The greatest K concentrations occurred during the initial fruit development, with levels considered adequate for nutrition of coffee plants (Malavolta, Vitti, and Oliveira 1997). During the grain filling stage, the leaf K concentration declined (Figure 4) because of the high demand of the fruits, associated with its mobility, favoring its remobilization from leaves to fruits. High demand during grain filling suggests the need to apply this nutrient in the period before the berries start to expand, because K is required to synthesize organic compounds such as sugars, whose production increases with fruit ripening (Marschner 1995; Marenco and Lopes 2005).
The greatest Ca concentration occurred during the vegetation phase and at the end of fruit formation (Figure 4), while the lowest concentrations occurred in the pinhead drop phase because of the high accumulation in the fruits. This agrees with the findings of Laviola et al. (2007a). The reason is the structural function of this nutrient, which par-ticipates in the constitution of the cell wall (apoplast) and plasma membrane. This result corroborates that found by Chaves (1982), according to whom the lowest Ca concentrations occurred in the initial fruit development phases. Considering that the Ca level in the soil was adequate (Table 1), the low Ca concentration in the anthesis and pinhead drop stage might have been due to the low rainfall in September and October, indicating that irrigation alone was not sufficient to guarantee Ca movement by the sap flow, which was also reduced by the high temperature (Figure 1). According to Malavolta, Vitti, and Oliveira (1997), the adequate concentrations of Ca vary from 13 to 15 g kg−1.
Lowest Mg concentrations were observed in the initial fruit formation phases (Figure 4), during which they were below the range considered adequate (4.0 to 4.5 g kg−1)
for diagnosis of the nutritional status in the pinhead drop phase (Malavolta, Vitti, and Oliveira 1997). Concentration of Mg is abundant in new tissues (flowers, fruits, leaves, and roots), explaining its low concentration in the third pair of leaves (Figure 4). Data from the present study corroborate the findings of Silva e Souza et al. (1975), who found that the Mg concentration increased during the phenological cycle in the leaves growing from branches with fruits. Pinhead drop may have a high respiratory rate (Rena, Barros, and Maestri 2001), depending on the membrane adenosine triphosphatase (ATPase) activ-ity (Marschner 1995), which in turn requires a sufficient concentration of Mg to maintain enzyme activation.
Leaf concentration of S varied similarly to that of N, because of its relationship with N metabolism (Vitti 1988). The lowest concentrations were observed in the vegetation phase and at the start of grain filling (Figure 4). The reduced S concentration during this latter phase was due to the redistribution of amino acids to the grains in formation, because a large part of the sulfur is assimilated and exported by the phloem to protein synthesis sites (fruits and shoot and root tips) (Vitti, Lima, and Cicarone 2006). Leaf concentration of S was within or above the adequate range for the formation of pinhead drop (Malavolta, Vitti, and Oliveira 1997), because the level of available S in the soil was high (Table 1).
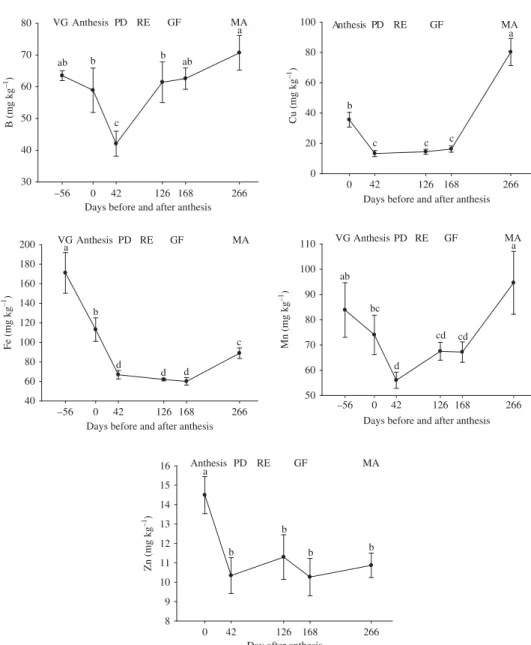
Leaf concentrations of B were greatest in the vegetation and final fruit formation stages (Figure 5), in the latter case due to the greater accumulation of this nutrient in the fruit dur-ing this stage (Laviola et al. 2007b). This nutrient should be applied before the formation of pinhead drops, to avoid competition between the leaves and fruits during anthesis, because of its importance for blossoming, pollen tube growth, and new cell formation. Coffee plants presented adequate leaf concentrations of B (Malavolta, Vitti, and Oliveira 1997).
Days before and after anthesis
B (mg kg
–1) 30 40 50 60 70
80 VGAnthesis PD RE GF MA
ab b
c b
ab a
Cu (mg kg
–1) 0 20 40 60 80
100 Anthesis PD RE GF MA
b
c c c
a
Fe (mg kg
–1) 40 60 80 100 120 140 160 180
200 VGa Anthesis PD RE GF MA
b
d d
c Mn (mg kg –1) 50 60 70 80 90 100
110 VGAnthesis PD RE GF MAa
ab
bc
d
cd cd
Zn (mg kg
–1) 8 9 10 11 12 13 14 15
16 Anthesis PD RE GF MA
b
b
b b
a
–56 0 42 126 168 266
Days before and after anthesis
–56 0 42 126 168 266
Days before and after anthesis –56 0 42 126 168 266
Days before and after anthesis
0 42 126 168 266
Day after anthesis
0 42 126 168 266
d
Figure 5. Foliar concentrations of B, Cu, Fe, Mn, and Zn during a phenological cycle of coffee.
The greatest leaf concentrations of Cu occurred in the initial phase (anthesis) and dur-ing fruit ripendur-ing, while the lowest concentrations occurred from the pinhead drop to grain filling stages (Figure 5). These findings corroborate those of Chaves (1982) and Gonçalves (2007), both of whom also observed a greater concentration in the initial phases of the reproductive cycle. Additionally, Laviola et al. (2007b) found a lower concentration of Cu in the endosperm growth phase.
The greatest concentrations of Fe were observed in the vegetative phase, after which the level declined (Figure 5). According to Dechen and Nachtigall (2006), high P con-centrations can affect the mobility of Fe in the plant tissues, explaining why the Fe concentration was inversely proportional to that of P (Figures 4 and 5). Likewise, defi-ciency of K affects the mobility of Fe, as verified during grain filling and ripening.
Nutritional Status of Coffee 2423
This probably contributed to the lower Fe concentrations in these phases. According to Malavolta, Vitti, and Oliveira (1997), adequate concentrations of Fe in the pinhead drop stage vary from 100 to 130 mg kg−1.
The greatest concentrations of Mn occurred in the vegetation and ripening phases (Figure 5). According to Laviola et al. (2007b), about 55% of Mn accumulation in fruits occurs during their initial development stages. This agrees with our findings, but there-fore the leaf application of Mn should occur when the fruits are just starting to form (pinhead drop). Chaves (1982) also found an increase in Mn concentration at the end of the fructification phase. According to Malavolta, Vitti, and Oliveira (1997), the adequate concentration of Mn during the pinhead drop stage ranges from 80 to 100 mg kg−1.
Finally, the greatest leaf Zn concentration occurred during anthesis (Figure 5). This finding corroborates that of Chaves (1982), who observed a decrease in the Zn concen-tration after appearance of the pinhead drop and a subsequent increase up to 172 days of the cycle. Then leaf application of Zn should be done before the formation of the pinhead drop. According to Malavolta, Vitti, and Oliveira (1997), the adequate range of Zn in the pinhead drop phase is 15 to 20 mg kg−1.
Conclusions
Leaf concentrations of the nutrients varied with the phenological development of coffee plant and the nutirent functions in the metabolism of the coffee plants. The N concentra-tion was lowest in the grain filling and ripening phases, and the N rates did not affect the concentrations of P, K, Mg, Ca, S, B, Cu, Fe, Mn, and Zn. The lowest concentrations of P, Ca, Mg, B, Cu, Fe, Mn, and Zn occurred in the initial fructification phases, while the concentration of K was lowest in the final fruit-formation phases. The supply of N, P, S, Mg, and Ca should be started before anthesis, while K and micronutrients should only be applied thereafter. Leaf N concentrations were directly related to the N rates, and the eval-uation of the nutritional status of coffee plants grown with fertigation can be done during the ripening phase to adjust the fertilization for the following year.
Acknowledgments
We acknowledge the National Council for Scientific and Technological Research (CNPq) for the research grant and the Arakatu Ltda. Group for allowing us to use the experimental area and other support for the study. The authors thank N. K. Fageria (EMBRAPA Rice and Beans) for his review and comments on the manuscript.
References
AIBA. 2008.Seventh yearbook of Cerrado coffee of the Bahia state. Luiz Eduardo Magalhães, Brazil: Fundação Bahia.
AOAC. 1975.Official methods of analysis of the Association of Official Analytical Chemists, 12th ed. Washington: Association of Official Analytical Chemists.
Barker, A. V., and G. M. Bryson. 2006. Nitrogen. InHandbook of plant nutrition, ed. A. V. Barker and D. J. Pilbeam, 21–50. Boca Raton, Fl.: CRC Press.
Bingham, F. T. 1982. Boron. InMethods of soil analysis: Chemical and microbiological properties, ed. A. L. Page, 431–447. Madison, Wisc.: American Society of Agronomy.
Bremner, J. M., and H. L. Edwards. 1965. Determination and isotope ratio analysis of different forms of nitrogen in soils, I: Apparatus and procedures for distillation and determination for ammonium.Soil Science Society of America Proceedings29:504–507.
Camargo, A. P., and M. B. P. Camargo. 2001. Definition and outline for the phenological phases of arabica coffee under Brazilian tropical conditions.Bragantia60:65–68.
Carvalho, C. H. S., A. B. Rena, A. A. Pereira, and A. T. Cordeiro. 1993. Relationship between crop load, N, P, K, Ca, Mg, and starch content and the dieback of Catimor (Coffea arabica L.). Pesquisa Agropecuária Brasileira28:665–673.
Chaves, J. C. D. 1982. Concentration of nutrients in fruits, leaves, and nutrient export by the har-vesting during a production cycle of coffee (Coffea arabicaL. cv. Catuai). MS thesis, Luiz de Queiroz College of Agriculture, Piracicaba, SP, Brazil.
CONAB. 2010.Monitoring of the Brazilian coffee production of 2009. Brasília, Brazil: Companhia Nacional de Abastecimento.
DaMatta, F. M., J. A. T Amaral, and A. B. Rena. 1999. Growth periodicity in trees of Coffea arabicaL. in relation to nitrogen supply and nitrate reductase activity.Field Crops Research 60:223–229.
Dechen, A. R., and G. R. Nachtigall. 2006. Micronutrientes. InMineral nutrition of plants, ed. M. S. Fernandes, 327–374. Viçosa, Brazil: Sociedade Brasileira de Ciência do Solo.
Fageria, N. K. 2009.The use of nutrients in crop plants. Boca Raton, Fl: CRC Press.
Gonçalves, G. C. 2007. Field growth ofCoffea arabicaL. cv. Obatã under full and partial shade: biochemical, physiological and nutritional evaluations.Ph.D. thesis, Luiz de Queiroz College of Agriculture, Piracicaba, SP, Brazil.
Jackson, M. L. 1958.Soil chemical analysis. Englewood Cliffs, N.J.: Prentice Hall.
Johnson, C. M., and A. Ulrich. 1959. Analytical methods for use in plants analyses. California Agricultural Experimental Station Bulletin, 766:57–58.
Larcher, W. 2004.Plant ecophysiology. São Carlos, Brazil: Rima Editora.
Laviola, B. G., H. E. P. Martinez, L. C. C. Salomão, C. D. Cruz, S. M. Mendonça, and L. D. S. Rosado. 2007b. Nutrient accumulation in coffee fruits at two plantation altitudes: Micronutrients.Revista Brasileira de Ciência do Solo31:1439–1449.
Laviola, B. G., H. E. P. Martinez, L. C. C. Salomão, C. D. Cruz, S. M. Mendonça, and L. D. S. Rosado. 2008. Accumulation in fruits and variation in the contents in leave of NPK in coffee plant cultivated in four altitudes.Bioscience Journal24:19–31.
Laviola, B. G., H. E. P. Martinez, R. B. Souza, and V. H. Alvarez V. 2007a. Dynamics of calcium and magnesium in leaves and fruits of arabic coffee.Revista Brasileira de Ciência do Solo 31:319–329.
Laviola, B. G., H. E. P. Martinez, R. B. Souza, L. C. C. Salomão, and C. D. Cruz. 2009. Macronutrient accumulation in coffee fruits at Brazilian Zona da Mata conditions.Journal of Plant Nutrition 32:980–995.
Lawlor, D. W. 1995. Photosynthesis, productivity, and environment.Journal of Experimental Botany 46:1449–1461.
Lemaire, G., M. Khaity, B. Onillon, J. M.Allirand, M. Chartier, and G. Gosse. 1992. Dynamics of accumulation and partitioning of N in leaves, stems, and roots of Lucerne (Medicago sativa) in a dense canopy.Annals of Botany70:429–435.
Malavolta, E. 2006.Manual of mineral nutrition of plants. Sao Paulo, Brazil: Editora Agronômica Ceres.
Malavolta, E., G. C.Vitti, and S. A. Oliveira. 1997.Evaluation of plant nutritional status: Principles and applications, 2nd ed. Piracicaba, Brazil: Potafos.
Marenco, R. A., and N. F. Lopes. 2005. Plant physiology: Photosynthesis, respiration, water relations, and mineral nutrition. Viçosa, Brazil: UFV.
Marschner, H. 1995.Mineral nutrition of higher plants, 2nd ed. London: Academic Press.
Matson, P. A., R. Naylor, and I. Ortiz-Monasterio. 1998. Integration of environmental, agronomic, and economic aspects of fertilizer management.Science280:1–8.
Nutritional Status of Coffee 2425
Panek, J. A., P. A. Matson, I. Ortiz-Monasterio, and P. Books. 2000. Distinguishing nitrification and denitrification sources of N2O in a Mexican wheat system using15N.Ecological Application
10:506–514.
Peoples, M. B., D. F. Herridgee, and J. K. Ladha. 1995. Biological nitrogen fixation: An efficient source of nitrogen for sustainable agricultural production?Plant and Soil174:3–28.
Pilbeam, C. J., and C. P. Warren. 1995. Use of15N for fertilizer N recovery and mineralization studies
in semi-arid Kenya.Fertilizer Research42:123–128.
Raij, B. van, J.C. Andrade, H.Cantarella, and J. A. Quaggio. 2001.Chemical analysis to evaluate fertility of tropical soils. Campinas: Instituto Agronômico.
Rena, A. B., R. S. Barros, and M. Maestri. 2001. Reproductive development of coffee. In Technologies for producing quality coffee, ed. L. Zambolim, 101–128. Viçosa, Brazil: UFV/Departamento de Fitopatologia.
SAS. 1996. SAS/STAT user’s guide, ver. 6.11, 4th ed. Cary, N.C.: Statistical Analysis System Institute.
Silva e Souza, V. H., M. Maestri, J. Braga, and J. R. P. Chaves. 1975. Variations in the content of some mineral elements in leaves and fruits of coffee (Coffea arabicaL. var. “Mundo Novo”). Revista Ceres22:310–331.
Vitti, G. C. 1988. Evaluation and interpretation of sulfur in soil and plant. Jaboticabal, Brazil: FUNEP.
Vitti, G. C., E. Lima, and F. Cicarone. 2006. Calcium, magnesium and sulfur. InMineral nutrition of plants, ed. M. S. Fernandes, 299–325. Viçosa, Brazil: Sociedade Brasileira de Ciência do Solo.