ISSN 0104-530X (Print) ISSN 1806-9649 (Online)
Resumo: O baixo índice de sucesso e as mudanças estruturais e organizacionais necessárias para a Implantação da Produção Enxuta (IPE) indicam a necessidade do uso da abordagem de Gestão de Riscos (GR) para gerenciar esta transformação. Este artigo tem como objetivo apresentar um modelo gráfico para explicitar as relações entre os riscos na IPE por meio da utilização da Interpretative Structural Modelling em uma empresa e entender os motivos destas relações. O estudo está baseado em um caso conduzido na unidade de uma empresa global fabricante de componentes hidráulicos. A coleta de dados foi realizada por meio de múltiplas fontes de evidência, como entrevistas, observações, visitas à fábrica e análise de documentos. O modelo desenvolvido propiciou o esclarecimento e entendimento dos efeitos diretos e indiretos da presença dos riscos na IPE na empresa. As principais relações identificadas no modelo foram confirmadas por meio das explicações dos motivos pelos quais tais relações ocorriam no caso.
Palavras-chave: Produção enxuta; Interpretative Structural Modelling; Gestão de riscos.
Abstract: The low success rate and the complex structural and organizational changes required for lean production implementation (LPI) require the use of the risk management approach to manage this transformation. This paper aims to present a graphical model to explain the relationships between the risks in LPI through interpretive structural modeling (ISM) and to understand the reasons behind such relationships. The case study was conducted in a factory of a global company that manufactures hydraulic components. Data were collected from multiple sources, including interviews, observations, visits to the plant, and document analysis. The research contributed to clarifying and understanding the direct and indirect influences of risks that hinder the LPI at the plant. The main relationships identified in the model were confirmed by explanations of reasons for such relationships occurred in the case. Keywords: Lean production; Interpretive Structural Modeling; Risk management.
Model of risk interactions hindering lean production
implementation
Modelo de relações entre os riscos que afetam a implantação de produção enxuta
Giuliano Almeida Marodin1 Tarcisio Abreu Saurin2 Guilherme Luz Tortorella3 Diego de Castro Fettermann3
1 Moore School of Business, University of South Carolina, 1014 Greene Street, 405L, 29208, Columbia, South Carolina, United States,
e-mail: gmarodin@moore.sc.edu
2 Programa de Pós-graduação em Engenharia de Produção e Transportes – PPGEP, Universidade Federal do Rio Grande do Sul –
UFRGS, Av. Osvaldo Aranha, 99, 5° andar, CEP 90035-190, Porto Alegre, RS, Brasil, e-mail: saurin@ufrgs.br
3 Programa de Pós-graduação em Engenharia de Produção – PPGEP, Universidade Federal de Santa Catarina – UFSC, R. Eng.
Agronômico Andrei Cristian Ferreira, s/n, Trindade, CEP 88040-900, Florianópolis, SC, Brasil, e-mail: gtortorella@bol.com.br; dcfettermann@gmail.com
Received July 24, 2017 – Accepted Dec 7, 2017 Financial support: None.
1 Introduction
Lean production (LP) has been used by companies around the world to improve operational performance (Herron & Hicks, 2008; Saurin et al., 2010; Tortorella et al., 2015a). Its implementation, however, is often dictated by a set of operational practices rather than supported by a business management system. This hinders performance
improvement efforts (Hines et al., 2004) and
results in a low number of companies successfully implementing the practice (Boyle et al., 2011; Taylor et al., 2013).
Papadopoulou & Ozbayrak, 2005); (b) LP principles and practices are intertwined and mutually dependent (Cua et al., 2001; Shah & Ward, 2007); and (c) factors
affecting LPI interact with each other in a way that is
not fully predictable or controllable (Lewis, 2000). The low success rate and complex structural and organizational changes demanded by LPI indicate the need to use an appropriate approach, such as the risk management (RM) system (Scherer & Ribeiro, 2013). This perspective implies the use of a robust base of concepts and tools that contribute to both
the identification of LPI difficulties and to their
management according to the plan, do, check, action cycle (Marodin et al., 2014). This possibility stems from the maturity of the risk management theme in other types of projects, such as software development (Boehm, 1991; Aloini et al., 2012) and supply chain management (Ritchie & Brindley, 2007). The few studies using the risk management approach to LPI have been conducted by Scherer & Ribeiro (2013), Marodin & Saurin (2014) and Marodin et al. (2014).
It is worth noting that the risks in LPI have been analyzed for some time, and have also been called barriers (Sim & Rogers, 2009), sources of failure (Scherrer-Rathje et al., 2009), or key factors (Achanga et al., 2006; Farris et al., 2009). However, such risks to LPI have only been examined individually, and not in relationship with each other. For example, in a case study in an automotive company, Motwani
(2003) identifies some difficulties with LPI, such as
lack of management support and of long-term vision, but does not clarify the dependency relationships between them. According to Shah & Ward (2007, p. 791), LP is “[…] an integrated socio-technical system whose main objective is to eliminate waste by concurrently reducing supplier, customer, and internal variability.” Hence, LPI impacts all business areas, permeating the technical, social, organizational, and external systems of a company, which points to the possible interconnection between risks and LPI.
The LPI literature still commonly focuses on only one perspective, such as social (Sim, & Rogers, 2009), organizational (Achanga et al., 2006), or external (Shah & Ward, 2003; Boyle et al., 2011), a characteristic that impairs the systemic vision of LPI.
The fragmented analysis of the risks to LPI reflects
the lack of knowledge about the systemic nature of LPI (Saurin et al., 2011).
According to Barki et al. (1993), there are causal relationships between risks in any type of project,
which makes individual risk management ineffective.
Chapman & Ward (2003) posit that risk analysis without
assessing risk interactions results in a superficial and incomplete understanding of risk. The most effective
responses in the treatment of some risks may be to reduce the probability of occurrence of risks that
precede them (Aloini et al., 2012; Echeveste et al., 2017). Thus, there is a need for in-depth research to collect empirical evidence on the relationship between risks in LPI. Modeling of the relationships between risks has been used in software development projects not only to understand such relationships,
but also to demonstrate the effects of the risks and
the factors that originate them (Wallace et al., 2004; Aloini et al., 2007).
Software development projects have a complex, long-term nature, involving several stages and requiring interaction between people and technologies, thereby bearing a close similarity to a LPI. Scherer & Ribeiro (2013) propose some relations between the risks in LPI based on the opinion of experts, but they do little to graphically explain the relations between the risks or to understand the reasons why these relations are present. In addition, the model proposed by Scherer & Ribeiro (2013) aimed to calculate the probability of success in LPI in a company, contributing little to helping companies understand and manage risks during or before LPI.
Therefore, this article aims to present a graphical model to explain the relations between the risks in LPI in a company and to understand the reasons behind such relationships. A case study was conducted in a hydraulic components manufacturing factory of a global company. The risk interrelationship model was constructed using interpretive structural modeling (ISM). ISM makes it possible to identify and explain the interdependencies between elements through a causal relationship model. This model can also help managers to understand the direct and
indirect influences of actions and the treatment of
risks (Aloini et al., 2012). ISM was recently used in studies aimed at understanding the risks in software development projects (Aloini et al., 2012), in supply chain management (Faisal et al., 2006; Pfohl et al., 2011) and also to understand the linkages between lean practices (Kumar et al., 2013).
2 Lean production
The literature does not present a consensus on the
definition of LP, but the central ideas coincide among different studies (Paez et al., 2004; Taylor et al., 2013). Womack et al. (1990) popularized the term, defining
it as a superior way of manufacturing products by using fewer resources to produce greater value to
customers. Most frequently, definitions recognize
LP as a managerial system formed by two levels of abstraction: principles and practices (Hines et al., 2004; Shah & Ward, 2007; Pettersen, 2009).
of results according to Eisenhardt (1989) and Yin (2003), such as:
(a) the definition of a research question, of the
constructs (in this case, the risks that make
LPI difficult), and of the forms prior to field
research through the case study protocol. In this way, it was possible, in the planning phase of
the field work, to identify which data should
be collected to measure the constructs and to identify the relationships between them;
(b) the triangulation of data collection methods (multiple interviews, observations, and documents) and the use of qualitative and quantitative data, which increases the credibility of the results;
(c) the overlapping of data collection and analysis
activities, which allows the identification of the
need for adjusting data collection procedures, if the collected data are irrelevant or imprecise. As an example of the impact of this overlap, researchers realized that observing daily production meetings was necessary for understanding social interactions and technical details that were not being adequately captured by other data sources;
(d) the creation of databases (e.g., transcripts of interviews, reports of observations), which supported tracing the data origin, as well as facilitated their continuous reinterpretation based on the support of the literature;
(e) the selection of the company intentionally, allowing the investigation of a relevant case in which possibly all the constructs would exist, and therefore an empirical investigation would be feasible;
(f) the establishment of a chain of patterns,
explanations, and cause-and-effect relationships to explain the influence of risks on LPI and
among themselves.
The company was selected for the following reasons: (a) LPI has been its corporate strategy for more than a decade, showing potential risk manifestation; (b) the research team had unusually thorough access to the data needed for the study because the company was a member of a group of companies that has maintained a lasting collaboration with one of the authors’ institutions. Access opportunity to atypical research is a criterion suggested by Yin (2003) for choosing a company for a case study. A company plant was chosen in a meeting with the company’s corporate lean manager, in which the research protocol was & Ozbayrak, 2005). The practices operationalize
the principles and are represented by a wide variety of integrated management methods, including just-in-time, quality systems, teamwork, cellular manufacturing, and supplier management (Shah & Ward, 2003). The principles and practices of LP are strongly interlinked (Shah & Ward, 2007). The main objective is to reduce the inputs in the system by eliminating waste (fewer materials and people, less equipment, less space, etc.) and at the same time improve the output of the products generated by the system (Lewis, 2000; Black & Hunter, 2003).
3 Risks in LPI
Risks are defined in different ways in the literature
(Aloini et al., 2007). For example, Scherrer-Rathje et al. (2009), in a longitudinal study at a food company, identify sources of LPI failure such as lack of senior management commitment and lack of communication within the company. Achanga et al. (2006) address LPI’s critical success factors in small and medium-sized enterprises, in relation to the availability of human and
financial resources. Farris et al. (2009) also identify
success factors, such as management support, at kaizen events in six companies. Although the conclusions of these studies have been expressed as success factors rather than as risks, it is possible that the opposite of each factor constitutes a risk to LPI, such as lack
of human and financial resources. In a recent study, Marodin & Saurin (2014) defined fourteen risks in
LPI (Table 1).
4 Method
4.1 OverviewThe research was carried out in five stages: (a) definition of the unit of analysis and characterization
of the company, (b) collection of data about the risks and the LPI journey, (c) relationships among risks through ISM, (d) sources of evidence for model relationships, and (e) feedback and action plan meeting. The case-based research strategy was chosen because of its ability to generate knowledge in complex social processes (Eisenhardt & Graebner, 2007), such as in LPI. This method is widely used
for the construction and refinement of operations
management theory (Voss et al., 2002) and LPI. (Walter & Tubino, 2013). In addition, empirical studies allow a large number of variables to be investigated to identify new relationships among them (Wacker, 1998), as in the objective of this study.
Table 1. LPI risks.
R1 - Demotivation of those involved after the first changes
Evidence: people’s lack of interest in participating in activities related to the process after a few months or years
R2 - Lack of knowledge of the support areas (engineering, maintenance, and areas dedicated to LP) to guide the progress of LPI
Evidence: application of isolated LP practices without integration or vision of the systemic impacts of the implementation of each practice. Insecurity and fear of support areas in guiding and applying LP practices. Difficulty in identifying what practices are needed and how they should be implemented.
R3 - Lack of human or financial resources allocated to the process
Evidence: not enough time for people to do LP training and application activities. No allocation of enough financial resources to train employees in LP.
R4 - Lack of communication clarity for all employees about deployment, start, and progress
Evidence: no official dissemination of results achieved, activities carried out, participants in the process, or objectives
R5 - Difficulty proving the financial return of the actions performed
Evidence: adherence to traditional indicators that do not indicate results, such as customer service, excess
inventory, or liberated area, among others. Prioritization of actions to impact short-term indicators, without valuing qualitative improvements or greater results in the medium and long term.
R6 - Lack of support from middle management
Evidence: Middle management does not control deadlines and results of the process, does not provide the time to clarify doubts and solve deployment problems, or has no commitment to the application of LP practices and their benefits.
R7 - Lack of support from upper management
Evidence: Upper management does not control and assist in the process, does not link actions to goals and objectives of the business, or prioritizes other actions to the detriment of those involving LPI.
R8 - The operational level does not support the implementation
Evidence: no interest from operators or supervisors in applying or using LP practices. Operators’ and supervisors’ fears of losing their jobs due to LPI leading to use of fewer resources (operators, inventory, or machines).
R9 - Operators’ insecurity in carrying out new tasks
Evidence: lack of support from supervisors and support areas in improvements, teamwork, standardization, use of production monitoring frameworks, calls from the aid chain, and production stoppages. Supervisors do not respect ideas and suggestions for improvements from operators and do not empower operators for these new assignments.
R10 - Dismissal of operators due to the excess of manpower generated by the improvements implemented Evidence: After performing improvement activities (or kaizens) in the factory, operators who are no longer needed due to productivity gains achieved are dismissed. Operators are dismissed according to demand fluctuations.
R11 - Operators do not feel responsible for using LP practices and solving problems
Evidence: Operators are not involved in making improvements in the factory and in LPI practices. Lack of participation of operators in the deployment process.
R12 - Managers and directors do not have enough knowledge about LP
Evidence: Upper and middle management difficulty in setting goals for implementation, monitoring, and ensuring the use of LP principles and practices. Upper and middle management do not guide LPI.
R13 – Mid- and long-term improvements are not sustained
Evidence: Improvements made in applying practices or solving problems end up returning to the original state after a few months. There is no follow-up through audits, nor any standardization of improvements.
R14 - Difficulties in managing the deployment process
Evidence: Those responsible for the process do not collect deadlines or follow up on the planned activities. Lack of audits in the progress of the process. Lack of commitment to deadlines and objectives of the process.
the plant manager, which was the position above his own, as upper management. For the operator and the manufacturing engineer, upper management was the production manager himself, since they had no contact with the plant manager.
4.4 Relationship between risks through ISM
The analysis of the relationships among risks was performed using ISM, a method that allows identifying and explaining the interdependencies between elements through a causal relationship model among the selected variables (Sage, 1977). ISM enables companies to identify, understand, and graphically present the interrelationships among the elements that form and interact in a complex system.
The benefits of using LPI can help managers
understand the direct and indirect interactions among risks. This understanding allows placing decisions in a priority order so that future actions minimize the impact of or eliminate risks, taking into account
that the risks that influence the others must be treated first. This occurs because these risks are the root causes of those above them the model. The five steps
for applying ISM in this case were based on those proposed by Attri et al. (2013):
(a) identify the variables that affect the system and
form the relationship model. In this case, the variables correspond to the risks to LPI in the company (Table 1);
(b) develop the reachability matrix (Table 4), in which the 14 risks were listed in the columns and rows. Based on the data collected in the previous steps, the researchers inserted the value 1 in the matrix cells when the risk positioned in
the line influenced the one in the column, and
value 0 for the other spaces. As an assumption
for cell filling, if element “A” influences “B” and “B” influences “C”, “A” necessarily influences
“C”;
(c) classify risks according to their power of
influence (how many elements they influence) and dependency (how many elements influence
them). A graph with these two axes was drawn and each risk was placed in it, enabling their division into four classes: autonomous (low
dependence and low power of influence),
independent (low dependence and high power
of influence), dependent (high dependence and low power of influence), and linkage (high dependence and high power of influence).
The information needed to position each risk presented. The main reason for choosing the plant
was the LP experience of this unit compared to others. The sociotechnical systems (STS) approach was used
to define the unit of analysis and to explore the context
characteristics. According to the literature (Hendrick & Kleiner, 2001; Baxter & Sommerville, 2011), the four subsystems of sociotechnical systems are: social (individuals, organizational culture, norms, and behaviors); technical (equipment, technology, and products); external (the region’s political, cultural, economic, social, and legal environments); and work organization (organizational practices such as procedures, leadership practices, and how to perform tasks).
4.2 Characterization of the company
The company has about 200 plants in 48 countries, with revenues of $13 billion in 2012. It produces motion control technology systems for heavy, industrial, and aerospace vehicles, among others. The valve plant started operations in 1983 and is part of a group of three plants of the hydraulic valve division. The characterization of the four subsystems that make up the context is presented in Table 2.
4.3 Collection of data about the risks and the LPI journey
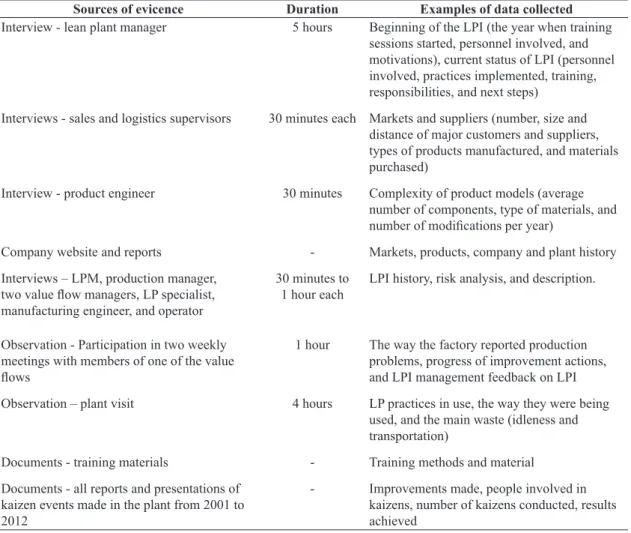
Data was collected using multiple sources of evidence during eight days of plant visit in August 2012. Interviews with the LP manager also contributed to understanding the LPI journey. Table 3 presents the respective sources, interview lengths, and observations, as well as the forms used.
Two forms were used in this phase. The first
consisted of questions about the context characteristics in the four sociotechnical subsystems, with about 60 closed and open questions about the topics of general plant data, customers and suppliers, human resources, equipment maintenance, engineering, and quality. The second form presented one closed question and one open question for each of the risks to LPI (Marodin & Saurin, 2014). In the closed question, respondents indicated the degree
of impact of each risk on a five-point Likert scale
(1 - very low, 2 - low, 3 - medium, 4 - high, and 5 - very high). Interviewees were then asked about the reasons for their answer. All interviews were recorded and transcribed.
Risks R6 and R7 were unified because of the respondents’ difficulty in discerning between upper
were considered Level I. The risks influenced
only by Level I risks were considered Level II. The same procedure continued until a level
for each risk was defined. This step was used
to position the risks at the levels where they were represented in the model;
(e) The relationships among risks were drawn
based on the levels identified in the previous
step. In this drawing, the levels were placed
from top to bottom in the model, from first to
in this chart was obtained from the reachability matrix;
(d) create a table, based on the reachability matrix (Table 4), to position the risks at model levels. The table presented one row for each risk and two
columns. The first column referred to influencing
risks (reachability set) and the second referred
to influenced risks (antecedent set) (Table 5).
Risks not influenced by any other—i.e., those
with no risks indicated in the reachability set,
Table 2. Characterization TPS – Toyota Production System.
External environment subsystem - Located in a highly industrialized region
- Plenty of unskilled labor and a shortage of skilled labor
- Provides for approximately 100 distributors in various regions of the United States - Low sales concentration (sales sum for the 10 largest customers below 7% of the total)
- Maintains few finished items in stock (only 5% of the total volume, with the remaining made on demand) Technical subsystem
- Produces hydraulic valves. Each product has some 20 to 30 components, including metal and plastic parts, seals, and elastomers
- Production operation involves machining, drilling, brazing, grinding, finishing, CNC, assembling, and testing, in addition to some external thermal treatment processes.
- Physical arrangement by process means that there are a large variety of production sequences, which adds complexity to the operations management and generates waste.
- Quality requirements are very strict for the products of this plant, since they are used in high-risk industries (e.g., oil and aerospace), in which small errors and defects can cause catastrophic outcomes.
- Equipment maintenance is not simple, because some machines are old (e.g., automatic drills) and it is not easy to obtain spare parts and the necessary technical knowledge.
- Equipment efficiency is low, around 65%. Shutdowns occur mainly during corrective maintenance and setup (it takes up to four hours in milling machinery).
Social subsystem
- Two hundred employees aged between 45 and 50 years, with a long experience in the company (25 to 30 years), since they started working when the plant started up
- Predominance of men, mainly in the machining processes
- About half of the operators had completed high school, and the other half had only completed primary school. - The plant operators were unionized until the early 1990s, and since then have been nonunionized.
- Due to machine complexity, machining equipment operators require extensive training compared to those on the assembly line.
Work organization subsystem
- Production manager has three value flow managers below him, each responsible for specific product families. Value flow managers are responsible for all the processes through which some product families pass. Operators, manufacturing engineers, and buyers/planners of materials are subordinate to value flow managers. Manufacturing engineers and buyers/planners also play an additional role, called coaching. These employees, in addition to the assignments associated with their core functions (e.g., purchasing materials), have the role of managing the day-to-day problems of a group of operators, such as vacation scheduling, employee absences, and production programming rearrangements.
- The main performance indicators are quality, cost, on-time delivery, security, and stock, all visually displayed in the plant.
- There is a performance annual bonus through individual evaluations and with different criteria for operators versus other employees. Operators can receive a bonus of 9% over annual base salary, and other employees can receive 18% over annual base salary.
- Most of the tasks performed by operators have standardized procedures, but not all of them.
- The plant maintains an ISO 9001-based certification, and no formal employee-driven improvement program. However, some operators participate in weekly meetings with the value flow manager to monitor indicators and improvement actions.
The excerpts that exposed the relationships among
risks were classified and allocated as such. The same
procedure was performed for the other sources of evidence, such as observations, documents, and visits. The use of multiple sources of evidence was done to achieve a greater validity of constructs through the triangulation of the data.
Regarding the documents, the researchers had access to various materials associated with LPI, such as all the reports, presentations, and photos of kaizen events held from 2001 to 2012. Participation in meetings and visits to the factory helped the researchers understand how the LP practices were used in the factory, how the problems were discussed among employees, and how improvements were addressed and monitored.
It is worth noting that some collections of evidence about some risks, as well as some relationships found among them, were more tangible than others. For example, the lack of human resources, initially
identified in interviews, could be verified with data on
last. A consistency evaluation was performed to identify if all relations were represented.
For example, the influence of an A (level III) risk on a C (level I) risk, identified in the
reachability matrix, must be represented by the
influence of the A risk on a B risk (level II),
and, therefore, of this B risk on the C risk. If this has not been done, the model must incorporate an arrow from A to C, even with
two levels of difference.
4.5 Sources of evidence for model relationships
The data collected in the previous steps served to identify the sources of evidence about the relationships found in the models. First, a database was assembled with the relationships found in the ISM. Then interview transcripts and researchers’ annotations were used to identify the sources of evidence in the interviews.
Table 3. Data collection procedures and sources of evidence.
Sources of evicence Duration Examples of data collected
Interview - lean plant manager 5 hours Beginning of the LPI (the year when training sessions started, personnel involved, and motivations), current status of LPI (personnel involved, practices implemented, training, responsibilities, and next steps)
Interviews - sales and logistics supervisors 30 minutes each Markets and suppliers (number, size and distance of major customers and suppliers, types of products manufactured, and materials purchased)
Interview - product engineer 30 minutes Complexity of product models (average number of components, type of materials, and number of modifications per year)
Company website and reports - Markets, products, company and plant history
Interviews – LPM, production manager, two value flow managers, LP specialist, manufacturing engineer, and operator
30 minutes to 1 hour each
LPI history, risk analysis, and description.
Observation - Participation in two weekly meetings with members of one of the value flows
1 hour The way the factory reported production problems, progress of improvement actions, and LPI management feedback on LPI
Observation – plant visit 4 hours LP practices in use, the way they were being used, and the main waste (idleness and transportation)
Documents - training materials - Training methods and material
Documents - all reports and presentations of kaizen events made in the plant from 2001 to 2012
- Improvements made, people involved in kaizens, number of kaizens conducted, results achieved
reducing the impact of each risk. After hearing the opinions of the participants, the researcher presented his interpretation of the motives. Some of the motives that the participants suggested were
the same as those identified by the researcher, thus
making consensus relatively simple. Those motives that had not been suggested by participants were explained by the researcher based on the examples that had been used as evidence in the data collected. The third moment of the meeting was the presentation of the improvement opportunities suggested by the researcher. The meeting lasted about four hours and was recorded and transcribed.
One week after the feedback meeting, the plant’s
management team held a meeting to define the actions
that would be taken to address and control the risks. Although none of the researchers were present at the meeting, the results were e-mailed to the researchers by the lean plant manager. Over a period of six months after the feedback meeting, the researchers received three e-mails commenting on the LPI status.
the number of vacancies not filled in the organization
chart and the increase in volume produced by operators from 2009 to 2012. However, the resistance of the operators was evidenced mainly by the reports obtained in the multiple interviews. Interviews are commonly used as the main sources of evidence in case studies (Voss et al., 2002).
4.6 Feedback meeting and action plan
A meeting was held with the plant management team and the company’s LP corporate director to discuss and improve the survey results. The meeting
had three different phases and was coordinated by
one of the researchers.
The meeting began with a brief presentation of
the LP plant’s journey. This first moment allowed
us to verify the understanding of the researchers about the most important facts that occurred in LPI. The second moment was the presentation of the risk analysis, in which participants were asked to suggest the probable reasons that would be increasing and
Table 4. Reachability matrix: row risks affecting column risks.
R1 R2 R3 R4 R5 R6/7 R8 R9 R10 R11 R12 R13 R14
R1 - Demotivation of those involved after the first changes
1 0 0 0 0 0 0 0 0 0 0 1 1
R2 - Lack of knowledge of the support areas
(engineering, maintenance, and areas dedicated to LP) to guide the progress of LPI
0 1 1 0 0 0 0 0 0 0 0 0 1
R3 - Lack of human or financial resources allocated to the process
0 0 1 0 0 0 0 0 0 0 0 1 1
R4 - Lack of communication clarity for all employees about deployment start and progress
0 0 0 1 0 0 1 0 0 0 0 0 0
R5 - Difficulty proving the financial return of the actions performed
1 0 0 0 1 0 0 0 0 0 0 0 0
R6/7 - Lack of support from upper and middle management
0 0 1 0 0 1 0 1 0 0 0 1 1
R8 - The operational level does not support deployment
0 0 0 0 0 0 1 0 0 0 0 1 1
R9 - Insecurity of operators in carrying out new tasks 0 0 0 0 0 0 1 1 0 0 0 0 0
R10 - The dismissal of operators due to the manpower excess generated by the improvements made
0 0 0 0 0 0 1 0 1 1 0 0 0
R11 - Operators do not feel responsible for using LP practices and solving problems
0 0 1 0 0 0 1 0 0 1 0 1 0
R12 - Managers and directors do not have enough knowledge about LP
0 1 0 0 0 0 1 1 0 0 1 0 1
R13 - Medium- and long-term improvements are not sustained
0 0 0 0 0 0 0 0 0 0 0 1 0
R14 - Difficulties in managing the deployment process 0 0 0 0 0 0 0 0 0 0 0 0 1
use of material suppliers, hourly production tracking charts, single minute exchange of die (SMED), and assembly cells.
In 2011, the production manager changed again. Consultant B was then hired to make monthly plant visits. A typical visit of consultant B was as follows: (a) he indicated some improvement needs for the lean plant manager; (b) the three work teams presented
what had been accomplished and the difficulties they
had experienced, and they proposed actions for the
next month; (c) consultant B offered his opinion
about the next steps; and (d) the lean plant manager consolidated the actions suggested into a task plan to be carried out the following day by Consultant B.
A corporate guideline standardized the visual presentation of the data of each value stream. These charts showed current and future SVM, planned improvement activities, and key performance indicators (safety, quality, customer service, productivity, and inventory). SFMs were responsible for carrying out improvement activities. Among the LP practices implemented during this period, we highlight the material supply routings at points of use, the overall
5 Results and discussion
5.1 LPI journey
LPI formally began at this plant in 2001, encouraged by a corporate vice president. An employee of the plant was assigned as lean plant manager. This person remained in the position during the period in which the research was carried out and was the main company
contact for the researchers. The first activities were
the implementation of several kaizen practices in the factory. From 2005 to 2008, Consultant A provided support to the plant and started using the value stream map to analyze the current state of LPI and to plan improvements. During this period, kaizen events were held in themes such as 5S, visual management by value stream, decreased product range, and pulled production.
In 2008, a new production manager took over the plant, playing a more participatory role in guiding LPI, assisted by the LP manager of the hydraulic valves division, an employee who supported several company plants. Other LP practices were implemented, such as a supermarket for all intermediate products, increased
Table 5. Model levels.
Risks to LPI Reachability set Antecedent set Levels
R1- Demotivation of those involved after the first changes R5 R13, R14 Level II R2 - Lack of knowledge of the support areas (engineering,
maintenance, and areas dedicated to LP) to guide the progress of LPI
R12 R3, R14 Level III
R3 - Lack of human or financial resources allocated to the process
R2, R6/7, R11 R13, R14 Level II
R4 - Lack of communication clarity for all employees about deployment start and progress
R8 Level III
R5 - Difficulty proving the financial return of the actions performed
R1 Level III
R6 /7 - Lack of support from upper and middle management R3, R9, R13, R14
Level IV
R8 - The operational level does not support deployment R4, R9, R10, R11, R12
R13, R14 Level II
R9 - Insecurity of operators in carrying out new tasks R6/7, R12 R8 Level III
R10 - The dismissal of operators due to the manpower excess generated by the improvements made
R8, R11 Level IV
R11 - Operators do not feel responsible for using LP practices and solving problems
R10 R3, R8, R13 Level III
R12 - Managers and directors do not have enough knowledge about LP
R2, R8, R9, R14
Level IV
R13 – Medium- and long-term improvements are not sustained
R1, R3, R6/7, R8, R11
Level I
R14 - Difficulties in managing the deployment process R1, R2, R3, R6/7, R8, R12
Level I
influence others and thus a potential to impact more
strongly on the system as a whole, therefore being considered priorities (Faisal et al., 2006). In addition, these risks have little or no risk as antecedents—that is, they can be directly managed (Ravi & Shankar, 2005). Due to the high degree of relations in the system, risk management actions will be more
effective when carried out jointly.
R1, R2, R4, R5, R9, and R10 were considered
autonomous because they have a low power of influence
and a low dependence on other risks. This group is considered to have a low connection to the system (Mandal & Deshmukh, 1994), and these risks can therefore be managed directly and individually.
R3, R8, R13, and R14 were classified as dependent
because of their high degree of dependence and low
power of influence on the system. Therefore, the risks directly and indirectly affecting this group must be managed first. In particular, R13 and R14 were
considered the most important because they form the highest level of the system (Mandal & Deshmukh, 1994). Because they are positioned at the highest level, it can be stated that a lower presence of risks at this level results in a greater chance of achieving expected results in the system (Faisal et al., 2006).
Figure 2 presents a simplification of the diagram of the relationship among risks, since it transforms some of the direct relations among elements into indirect relations, characterized by the moderating
effect of the impact along two or more levels of difference. For example, the reachability matrix points to the influence of R11 on R3, R8, and R13.
However, the arrows in the ISM of R11 (Level III)
equipment effectiveness indicator, the supermarket for
intermediate products drawn by kanban, the leveling of machining production, the audits (kamishibai), and the continuous assembly cell.
5.2 Relationship between risks through ISM
Figure 1 shows the classification of risks according to the four groupings proposed by the ISM, which enables their hierarchical organization (Faisal et al., 2006). R6/7, R11 and R12 were classified as independent and prioritized for management actions. The independent elements have a high power to
Figure 1. Diagram of influence power and dependence
among risks.
Figure 2. Interpretive Structural Modeling – ISM model of causal relationships among risks. LPI – Lean production
supporting this practice was in R9, according to part of the interview with the manufacturing engineer:
The [production monitoring] framework is not being used [by the management team]. It’s more than a visual thing—it serves for managers to keep an eye on the factory, look at the board, and if they understood the frames and the way they should be filled out, they could stop there and ask the operators [things like], “Why couldn’t you reach the production goal? What is happening now?” or [praise them, saying], “Congratulations, you did a good job.” Unfortunately no one uses it this way, except the former production manager, and since he left, the priority left with him.
It is worth noting that Liker (2004) identifies other
objectives for the production monitoring framework, such as collecting information that enables identifying and prioritizing the main problems and then acting
to solve the problems that most affect that process.
This was also not being done by the management team. Hence, it can be assumed that the lack of support from the management was making also the operational level not adhere to this practice.
R11 (operators do not feel responsible for using LP practices and solving problems) was considered one of the most important risks in ISM. One reason why operators did not feel responsible for the implementation and use of LP practices was the way they were involved in LPI. Consultant B and the management team would develop solutions and present them to machinists and coaches to get their opinions on the proposal. The managerial team, possibly
because of R12 (little knowledge and insufficient LP
practical experience on the part of the management), believed that this constituted involving the operators properly. However, the operators and coaches were not participating in the construction of the solutions—that is, analyzing the problems and giving suggestions in order to reach consensus. At kaizen events held in previous years, operators and coaches had jointly decided how the improvements would be made, but recently the plant was no longer doing this type of event. The company has not held any kaizen events at the factory since 2009.
The LP corporate director took some of the blame for this fact during the feedback meeting, insofar as
the corporate office began, at that time, to encourage
the production manager to participate more actively in LPI and to use the value stream map. Although this guideline did not clearly state that kaizen events were not to be carried out, several plants, including the one in this study, mistakenly believed that kaizen events were no longer necessary because improvements would be made by the management team. In practice, the result was that operators and coaches were not
only indicate their influence on R3 and R8, that is, one level less. In turn, R3 and R8 (Level II) influence R13 (Level I). Thus, the influence of R11 on R13 is
still represented in the model, but indirectly through R3 and R8. The causal structure of the ISM makes it
unnecessary to demonstrate the influence of the risks in two or more levels of difference, except when there
is no consistency, as described above.
In practical terms, the model enables seeing the importance of R6/7, R11, and R12. For example, the model demonstrates that reducing the presence of R11 will also reduce that of R3 and R8 in Level II and, consequently, of R13 and R14 in Level I.
5.3 Sources of evidence for model relationships
5.3.1 Level IV
R12 (scarce knowledge and practical experience
with LP management) was classified as independent, that is, with a high power to influence other risks. The influence of R12 on other risks was evidenced,
for example, in how value stream maps and coaches supported operators, a factor associated with R9 (level III). Lack of full knowledge of LP practices prevented management from explaining it in detail, deciding how it should be implemented, solving the problems that occurred soon after implementation, and understanding the best order to implement LP practices. The manufacturing engineer’s account illustrates this argument:
The training [on overall equipment effectiveness]
was not good. I do not believe that the people who gave the training were trained enough to be able to train others. We have probably sat here several times for about 40 hours [after training] to come to an agreement on how [it] should work and have never come to agreement.
5.3.2 Level III
R9 (lack of support for operators to use lean practices or actively participate in problem solving)
had an influence on the operators’ resistance to LPI
(R8). For example, on plant visits, the researchers realized that some of the production follow-up charts
had been filled with total daily production, even
though the day was still starting. Elsewhere, the charts did not describe the reasons for the shutdowns in production. In fact, the manufacturing engineer said that the operators did not understand the meaning of the production monitoring charts, mainly because
the tables demanded time from the operators to fill
source of hindrances that made the improvements take longer to be put to use appropriately. Despite
this, this difficulty, before the present case study, had never generated a reflection on the motives that
led the operators not to support some LP practices.
5.3.3 Level II
R3 (lack of human or financial resources) was classified as highly dependent by the ISM. The large
number of improvement actions planned but not
implemented may have influenced the managers’
perception about the lack of resources. Improvement
actions were generated in three different ways: (a) at
Consultant B’s visits, (b) by the value stream managers, and (c) when the production manager requested an A3 problem-solving report (Tortorella et al., 2015b), when a performance indicator associated with the visual stream mapping indicator framework was not met. These three forms caused several actions to be
frequently postponed, impacting on R14 (difficulty
in maintaining the pace of implementation of LPI). In fact, the visual control chart of the action plans indicated that several actions of the value stream map were delayed, and there was no control of the execution of the actions in the A3 in progress.
The lack of support from factory-floor operators
(R8) was considered high impact by all respondents
and classified as dependent on the ISM. The fact that
the LPI strategy has changed several times in recent years may have contributed to the high impact of R8.
These shifts in strategy led factory-floor operators to
question the LP knowledge of the management team (R12). An excerpt from the interview with a factory worker illustrates this questioning:
Most of the things [Consultant B] says are against the things we’ve been doing for the past three years […] a lot of things have changed about what they taught us. If you keep changing things like that, it’s harder to keep people on board.
It is worth noting that the previous commentary addresses the changes in the LPI strategy considered as a priority. In fact, this process normally entails various changes, but they must not contradict each other, as reported, but should evolve constantly toward LP principles.
The lack of support from some people on the
factory floor (R8) made it difficult to maintain a steady
pace of improvement (R14), as it generated the need for excessive management time to implement each LP practice. For example, the supply routings were
defined by the management team, with no operator
participation. When equipment was available to begin routings, neither suppliers nor factory operators were in favor of implementing this practice. According to comfortable using some of the LP practices deployed
because of the lack of direct and decisive participation in the solution-development process.
R11 was shown to affect R8 (lack of support from the
operational level), such as on one occasion witnessed by one of the interviewees, the LP specialist. In this instance, the management team called an operator to a meeting in which Consultant B presented his ideas for layout reorganization to create a cell in the assembly industry. The operator did not challenge the proposed solution. However, after this meeting, he met with some operators at the plant to say that the idea of a continuous cell would not work, and that it would be “stupid” to try it. Some of the participating operators disagreed with their colleague, which indicates that some of the operators supported the LPI.
In this example, the operator had been called to a meeting with the management team and Consultant B in which the future state proposal had already been built for his sector. That is, the solution was already ready and the team wanted it to be put into practice. This meant that the operator knew his objections would be challenged by the team, felt disinclined to assist in the solution, and also decided to persuade colleagues to oppose it as well.
The kaizen events worked in a totally different way,
because everyone had the same role: to understand the problem and develop the solution together. In the view of the manufacturing engineer:
The idea [of kaizen] was to discuss and agree before an implementation. It was a small group and that’s why it worked … the people who were directly involved were those who participated in the meeting. I was there [in kaizen] with people from other areas who were related to the subject. Before, everyone knew exactly what they should do and how they should do it. The group listened and decided: Here is the problem, how will we solve it? This is not the way we are doing [it] now.
On another occasion, in the implementation of the pulled systems, the management team also declared
how the system would work. Factory floor operators
did not immediately support the use of the practice, which required many hours of discussion and adjustments before and after the start of the use of the pulled system. However, according to the interviewed operator, most of these adjustments could have been made in planning the implementation of the practice if the operators had been involved more directly. This excessive time spent by the management team on adjustments to put LP practices into operation
has directly impacted R3 (lack of human or financial
resources). Rather than being a further resource to assist in the development of improvement actions,
and support of the newly implanted supermarket of
finished products required the operators to follow the
guidelines of the kanban cards of the supermarket of intermediate products.
5.3.4 Level I
The lack of sustainability of the improvements (R13),
classified as an ISM-dependent risk, was pointed out by all as a great difficulty in LPI. The management
team conducted daily audits of the use of LP practices to sustain the improvements. However, the presence of R3 (lack of human resources) and R8 (lack of support
from the operational level) made audits difficult and
time-consuming. During the three weeks that the data for this survey were collected, audits were always two to three days late.
In the view of factory-floor operators, LPI was
moving steadily, with several new practices put into place in recent months. However, the managerial
team’s perception was that R14 (difficulty in keeping
up with LPI) was manifesting strongly. R3 and R8 also made the execution of the action plans even more time-consuming, on top of the large number of actions proposed from the three separate channels mentioned above. However, many improvements had been implemented over a year of Consultant B’s
visits, such as the intermediate- and finished-products supermarket, the continuous flow cell, the factory-wide
supply routings, the kamishibai, and the sequence level standard for the initial processes (e.g., machining).
5.4 Feedback meeting and action plan
The practical implications for the company stemming from the feedback meeting were addressed within four months. Table 6 summarizes the relationship between the actions and the risks treated:
(a) Teamwork: The management team and three senior operators visited another company plant where the machining process operators acted in groups of three and operated a set of 10 machines. The management team saw
this practice as the first step toward achieving
teamwork and, subsequently, the role of the team leader. In the case study, each operator was responsible for three to four machines. the lean plant manager, suppliers refused to operate the
equipment, even after the training. It was necessary for the management team and the lean plant manager to meet with the suppliers to convince them that the equipment was adequate.
The first time the suppliers ran routing, a machine
operator placed a chip carton in the way to disrupt the supplier, who had to stop and wait for the operator to take the box out of the way. The moment was captured on a hidden camera installed by the lean plant manager, since he had expected some negative reaction from the operators.
Because of this situation, coupled with the fact that many complaints were made by operators in the days before the routing implementation, the lean plant manager and a trainee decided to follow all the routings and to note all the obstacles raised by the operators for three weeks. Next, a multifunctional team tried to solve the problems raised. The presence of R8 can be attributed in part to the way in which the practice was introduced to the operators, which made them see it as unnecessary and unsafe. Six months after these events, at the time this survey was conducted, the operators interviewed showed satisfaction with the supply routings and, according to them, it had solved most of the problems of lack of material at the point of use.
The resistance of the factory-floor operators to LPI also influenced some improvements (R13).
For example, some machinists did not support the use of kanban cards for the supermarket of intermediate products that they supplied. The installed pulled system took away the machinists’ autonomy in choosing the production sequence they wanted to follow, since
there was a standard sequence defined by the kanban
cards linked to the supermarket.
The calculation of supermarket stock levels took into account an established standard sequence. Hence, the changes that the operators made in this sequence left the supermarket more prone to a lack of parts, because some products were advancing
over others, differently from the way the inventories were calculated. In a number of situations, the final assembly failed to supply its stock of finished products,
since the failure to comply with kanban rules on the part of the machinist caused a lack of products in the intermediate products inventory that supplied the assemblies. Thus, the guarantee of the operation
Table 6. Relationship among actions and risks to be treated.
Suggested actions / Risks impacted R3 R11 R9 R13 R8 R14 R2 R1 R4 R12
(a) Teamwork X X X X
(b) Training X X X X X
(c) Definition of responsibilities X X X X
The results enabled understanding the risk-interrelationship dynamic and planning treatment actions by taking into account these relationships, and not just the perception of each risk. It is worth noting that, even in the study, the relationships between risks and suggestions for treatment have a punctual and
momentary nature, that is, they reflect the situation
at the time the study was carried out. The method
may generate different results in the future, as the
company proceeds with LPI. This makes the control step necessary to assess whether actions are containing the risks and identify new risks. Performing the risk control step is an opportunity for future research
studies to have evidence of the effectiveness of the
analysis and risk management in LPI.
In practical terms, this study can contribute to: (a) helping companies clearly identify the risks to LPI, and (b) assisting companies in planning risk management actions.
Another important limitation was that the assessment was made with risks that were impacting on LPI at that moment, not on those that would have a probability of occurrence and future impact. In fact, risk assessment should ideally start at the project planning stage and not with the project in progress. However, the company had characteristics that prevented a prior assessment of the risks, since the LPI (a) was started by people with little experience in LP, who probably would not have the necessary knowledge to evaluate in advance the possible risks to the process; (b) there
was not a clear and long-term plan that defined the
steps to be taken over a period of more than one year,
which made it difficult to predict future risks; and
(c) LPI was already in progress when the case study
began, and there were difficulties in maintaining and
moving forward in the process.
According to Bannerman (2008), the benefits of
risk assessment depend on participation, discernment, skills, judgment, and in-depth knowledge of the context by the actors involved. Thus it did not make sense, at least initially, to plan actions to address
future risks without first managing those that were
impacting LPI at that time.
Hence, this study opens the way for other case studies to be conducted to identify new risks, to propose new relationships among them, or to validate the relationships found. The test of the degree of generalization of the proposed ISM model can be done through large-sample surveys. These studies can validate the relationships found, propose new
relationships, and quantify the percentage of influence
that one risk has on another.
Finally, the article showed potential to improve LPI methods in companies. In future studies, LPI could
incorporate this identification of the relationships
between risks as one of its stages. For example, Operators would depend on one another’s pace,
have common goals and indicators, and should communicate more in small groups;
(b) Training: The management team held biweekly meetings to discuss LP technical literature in an attempt to build a shared and uniform view on the subject. These theoretical-practical discussions were later expanded to the teams that worked along the value stream stages, such as manufacturing engineers, senior operators, planners, and buyers. The objective was for the management team to better understood the reasons and implications of the changes introduced by LPI, rather than blindly adopting Consultant B’s recommendations. The lean plant manager also participated in a distance-learning value stream mapping course;
(c) Responsibilities defined: A meeting was held with
operators, coaches, and value stream managers
to define the standardized work processes and
the responsibilities of each role, including in problem solving;
(d) Involvement of factory employees: The lean plant manager requested that Consultant B guide the implementation of value stream mapping of one of the product families. This event was done with the presence of the team involved in the value stream (manufacturing engineers, senior operators, planners, and buyers). The goal was to broaden everyone’s understanding of the LP system and the importance of all practices being
used in an integrated flow of value. It should
be noted that Consultant B had not previously used this mapping to suggest improvements, and the management team was not aware of
how he defined the action plan.
6 Final considerations
The research method was carried out in four
stages: (a) analysis unit definition and company
characterization, (b) data collection about risks and the LPI journey, (c) risk interrelatedness through ISM, (d) evidence sources for the model’s relationships, and e) feedback meeting and action plan.
The study aimed to model the relationships between risks in LPI in a case study. The study aimed to model the relationships between risks in LPI in a case study.
The identification of the relations between the risks
Cua, K. O., McKone, K. E., & Schroeder, R. G. (2001). Relationships between implementation of TQM, JIT, and TPM and manufacturing performance. Journal of Operations Management, 19(6), 675-694. http://dx.doi. org/10.1016/S0272-6963(01)00066-3.
Echeveste, M. E. S., Rozenfeld, H., & Fettermann, D. C. (2017). Customizing practices based on the frequency of problems in new product development process. Concurrent Engineering, Research and Applications, 25(3), 245-261. http://dx.doi.org/10.1177/1063293X16686154.
Eisenhardt, K. M. (1989). Building theories from case study research. Academy of Management Review, 14(4), 532-550. http://dx.doi.org/10.5465/amr.1989.4308385.
Eisenhardt, K. M., & Graebner, M. E. (2007). Theory building from cases: opportunities and challenges. Academy of Management Journal, 50(1), 25-32. http:// dx.doi.org/10.5465/amj.2007.24160888.
Faisal, M. N., Banwet, D. K., & Shankar, R. (2006). Supply chain risk mitigation: modeling the enablers. Business Process Management Journal, 12(4), 535-552. http:// dx.doi.org/10.1108/14637150610678113.
Farris, J., Van Aken, E., Doolen, T., & Worley, J. (2009). Critical success factors for a human resource outcomes in Kaizen events: An empirical study. International Journal of Production Economics, 117(1), 42-65. http:// dx.doi.org/10.1016/j.ijpe.2008.08.051.
Hendrick, H. W., & Kleiner, B. M. (2001). Macroergonomics: an introduction to work system design (175 p.). Santa Monica: Human Factors and Ergonomics Society.
Herron, C., & Hicks, C. (2008). The transfer of selected lean manufacturing techniques from Japanese automotive manufacturing into general manufacturing (UK) through change agents. Robotics and Computer-integrated Manufacturing, 24(4), 524-531. http://dx.doi.org/10.1016/j. rcim.2007.07.014.
Hines, P., Holweg, M., & Rich, N. (2004). Learning to evolve: A review of contemporary lean thinking. International Journal of Operations & Production Management, 24(10), 994-1011. http://dx.doi.org/10.1108/01443570410558049.
Kumar, N., Kumar, S., Haleem, A., & Gahlot, P. (2013). Implementing lean manufacturing system: ISM approach. Journal of Industrial Engineering and Management, 6(4), 996-1012. http://dx.doi.org/10.3926/jiem.508.
Lewis, M. A. (2000). Lean production and sustainable competitive advantage. International Journal of Operations & Production Management, 20(8), 959-978. http://dx.doi.org/10.1108/01443570010332971.
Liker, J. (2004). The Toyota way: 14 management principles from the world’s greatest manufacturer. New York: McGraw-Hill.
Mandal, A., & Deshmukh, S. G. (1994). Vendor selection using interpretive structural modeling (ISM). International
the identification and analysis of the relationships
between the risks to LPI can be a step of value stream mapping, in conjunction with the action plan and to highlight the imminent risks in the implementation of the future state, which would already be incorporated in the plan. Despite the publication of several LPI methods in the literature, these methods restrict themselves to emphasizing the appropriate sequence for implementing LP practices (Marodin & Saurin, 2013), rather than providing tools to manage or anticipate the major risks to LPI.
References
Achanga, P., Shehab, E., Roy, R., & Nelder, G. (2006). Critical success factors for lean implementation within SMEs. Journal of Manufacturing Technology Management, 17(4), 460-471. http://dx.doi.org/10.1108/17410380610662889.
Aloini, D., Dulmin, R., & Mininno, V. (2007). Risk management in ERP project introduction: review of the literature. Information & Management, 44(6), 547-567. http://dx.doi.org/10.1016/j.im.2007.05.004.
Aloini, D., Dulmin, R., & Mininno, V. (2012). Risk assessment in ERP projects. Information Systems, 37(3), 183-199. http://dx.doi.org/10.1016/j.is.2011.10.001.
Attri, R., Dev, N., & Sharma, V. (2013). Interpretive structural modelling (ISM) approach: an overview. Research Journal of Management Sciences, 2(2), 3-8.
Bannerman, P. L. (2008). Risk and risk management in software projects: a reassessment. Journal of Systems and Software, 81(12), 2118-2133. http://dx.doi.org/10.1016/j. jss.2008.03.059.
Barki, H., Rivard, S., & Talbot, J. (1993). Toward an assessment of software development risk. Journal of Management Information Systems, 10(2), 203-225. http://dx.doi.org/10.1080/07421222.1993.11518006.
Baxter, G., & Sommerville, I. (2011). Socio-technical systems: from design methods to systems engineering. Interacting with Computers, 23(1), 4-17. http://dx.doi. org/10.1016/j.intcom.2010.07.003.
Black, J. T., & Hunter, S. L. (2003). Lean manufacturing systems and cell design (336 p.). Dearborn: Society of Manufacturing Engineers.
Boehm, B. W. (1991). Software risk management: principles and practices. Journal IEEE Software, 8(1), 32-41. http://dx.doi.org/10.1109/52.62930.
Boyle, T. A., Scherrer-Rathje, M. S., & Stuart, I. (2011). Learning to be lean: the influence of external information sources in lean improvements. Journal of Manufacturing Technology Management, 22(5), 587-603. http://dx.doi. org/10.1108/17410381111134455.
Production Research, 49(11), 3211-3230. http://dx.doi. org/10.1080/00207543.2010.482567.
Saurin, T. A., Ribeiro, J. L. D., & Marodin, G. A. (2010). Identificação de oportunidades de pesquisa a partir de um levantamento da implantação da produção enxuta em empresas do Brasil e do exterior. Gestão & Produção, 17(4), 829-841. http://dx.doi.org/10.1590/ S0104-530X2010000400015.
Scherer, J. O. S. O., & Ribeiro, J. L. D. (2013). Proposição de um modelo para análise dos fatores de risco em projetos de implantação da metodologia lean. Gestão & Produção, 20(3), 537-553.
Scherrer-Rathje, M., Boyle, T., & Deflorin, P. (2009). Lean, take two! Reflections from the second attempt at lean implementation. Business Horizons, 52(1), 79-88. http:// dx.doi.org/10.1016/j.bushor.2008.08.004.
Shah, R., & Ward, P. T. (2003). Lean manufacturing: context, practice bundles, and performance. Journal of Operations Management, 21(2), 129-149. http://dx.doi. org/10.1016/S0272-6963(02)00108-0.
Shah, R., & Ward, P. T. (2007). Defining and developing measures of lean production. Journal of Operations Management, 25(4), 785-805. http://dx.doi.org/10.1016/j. jom.2007.01.019.
Sim, K., & Rogers, J. (2009). Implementing lean production systems: barriers to change. Management Research News, 32(1), 37-49. http://dx.doi.org/10.1108/01409170910922014.
Taylor, A., Taylor, M., & Mcsweeney, A. (2013). Towards greater understanding of success and survival of lean systems. International Journal of Production Research, 51(22), 6607-6630. http://dx.doi.org/10.1080/002075 43.2013.825382.
Tortorella, G. L., Fettermann, D. C., Marodin, G. A., & Fogliatto, F. S. (2015a). Lean product development (LPD) Enablers for product development process improvement. In J. Davim (Eds.), Research advances in industrial engineering (pp. 31-57). Cham: Springer. http://dx.doi.org/10.1007/978-3-319-17825-7_3.
Tortorella, G. L., Viana, S., & Fettermann, D. (2015b). Learning cycles and focus groups: a complementary approach to the A3 thinking methodology. The Learning Organization, 22(4), 229-240. http://dx.doi.org/10.1108/ TLO-02-2015-0008.
Voss, C., Tsikriktsis, N., & Frohlich, M. (2002). Case research in operations management. International Journal of Operations & Production Management, 22(2), 195-219. http://dx.doi.org/10.1108/01443570210414329.
Wacker, J. G. (1998). A definition of theory: research guidelines for different theory-building research methods in operations management. Journal of Operations Management, 16(4), 361-385. http://dx.doi.org/10.1016/ S0272-6963(98)00019-9.
Journal of Operations & Production Management, 14(6), 52-59. http://dx.doi.org/10.1108/01443579410062086.
Marodin, G. A., & Saurin, T. A. (2013). Implementing lean production systems: research areas and opportunities for future studies. International Journal of Production Research, 51(22), 6663-6680. http://dx.doi.org/10.108 0/00207543.2013.826831.
Marodin G. A., & Saurin, T. A. (2014). Classification and relationships between risks that affect lean production implementation: a study in Southern Brazil. Journal of Manufacturing Technology Management, 26(1), 57-79. https://doi.org/10.1108/JMTM-12-2012-0113.
Marodin, G. A., Saurin, T. A., & Fettermann, D. C. (2014). Uma sistemática para a avaliação de riscos na implantação de produção enxuta. Revista Produção Online, 14(1), 364-401. http://dx.doi.org/10.14488/1676-1901.v14. i1.1667.
Motwani, J. (2003). A business process change framework for examining lean manufacturing: A case study. Industrial Management & Data Systems, 103(5), 339-346. http:// dx.doi.org/10.1108/02635570310477398.
Paez, O., Dewees, J., Genaidy, A., Tuncel, S., Karwowski, W., & Zurada, J. (2004). The lean manufacturing enterprise: An emerging sociotechnological system integration. Human Factors and Ergonomics in Manufacturing, 14(3), 285-306. http://dx.doi.org/10.1002/hfm.10067.
Papadopoulou, T. C., & Ozbayrak, M. (2005). Leanness: experiences from the journey to date. Journal of Manufacturing Technology Management, 16(7), 784-807. http://dx.doi.org/10.1108/17410380510626196.
Pettersen, J. (2009). Defining lean production: some conceptual and practical issues. The TQM Journal, 21(2), 127-142. http://dx.doi.org/10.1108/17542730910938137.
Pfohl, H. C., Gallus, P., & Thomas, D. (2011). Interpretive structural modeling of supply chain risks. International Journal of Physical Distribution & Logistics Management, 41(9), 839-8592. http://dx.doi. org/10.1108/09600031111175816.
Ravi, V., & Shankar, R. (2005). Analysis of interactions among the barriers of reverse logistics. Technological Forecasting and Social Change, 72(8), 1011-1029. http:// dx.doi.org/10.1016/j.techfore.2004.07.002.
Ritchie, B., & Brindley, C. (2007). Supply chain risk management and performance: a guiding framework for future development. International Journal of Operations & Production Management, 27(3), 303-322. http:// dx.doi.org/10.1108/01443570710725563.
Sage, A. P. (1977). Interpretive structural modeling: methodology for large-scale systems (pp. 91-164). New York: McGraw-Hill.
Produção, 20(1), 23-45. http://dx.doi.org/10.1590/ S0104-530X2013000100003.
Womack, J. P., Jones, D. T., & Roos, D. T. (1990). The machine that changed the world. New York: Scribner.
Yin, R. (2003). Case study research: design and methods (5. ed.). Thousand Oaks: Sage.
Wallace, L., Keil, M., & Rai, A. (2004). Understanding software project risk: a cluster analysis. Information & Management, 42(1), 115-125. http://dx.doi.org/10.1016/j. im.2003.12.007.