Article
J. Braz. Chem. Soc., Vol. 29, No. 2, 390-397, 2018. Printed in Brazil - ©2018 Sociedade Brasileira de Química
*e-mail: [email protected]
Comparative Study of the Lipid Profiles of Oils from Kernels of Peanut, Babassu,
Coconut, Castor and Grape by GC-FID and Raman Spectroscopy
William S. Martini,a Brenda L. S. Porto,a,b Marcone A. L. de Oliveiraa and
Antonio C. Sant’Ana*,a
aDepartamento de Química, Instituto de Ciências Exatas, Universidade Federal de Juiz de Fora,
36036-330 Juiz de Fora-MG, Brazil
bDepartamento de Química, Instituto de Ciências Exatas, Universidade Federal de Minas Gerais,
31270-901 Belo Horizonte-MG, Brazil
The characterization of the lipid profiles of oils extracted from the kernel of seeds and nuts
of peanut (Arachis hypogaea), babassu (Attalea speciosa), coconut (Cocos nucifera), castor
(Ricinus communis) and grape (Vitis vinifera) was performed by using Raman spectroscopy and gas chromatography with flame ionization detector (GC-FID). Chromatographic analyses showed that coconut and babassu oils are composed essentially by saturated fatty acids (SFA), whereas the others are composed mainly by unsaturated fatty acids (UFA). The comparison of commercial and homemade castor oils showed the former have a lower level of ricinoleic acid at ca. 58%. Spectroscopic analyses of three distinct castor oils showed their profiles could be differentiated by marker features ascribed to carbonyl modes which were correlated with storage time. The comparison between the Raman spectra of standard samples of fatty acids with the samples of oils allowed the assignment of the spectroscopic features and the characterization of marker bands for the degree of unsaturation.
Keywords: vibrational spectroscopy, chromatographic profile, handmade castor oil
Introduction
Vegetable oils are greasy, hydrophobic and unctuous to touch, with the most part of their composition having triglyceride nature; they are present in cellular organelles from mainly oleaginous fruits or grains. They are formed basically by saturated (SFA) and unsaturated (UFA) fatty acids, unsaponifiable matter and antioxidants, which makes them potentially attractive as sources of natural products for several applications in feeding and pharmacology.1,2
The most common fatty acids in vegetable oils are oleic (C18H34O2, octadecamonoenoic acid), linoleic (C18H32O2,
octadecadienoic acid), linolenic (C18H30O2, octadecatrienoic
acid), palmitic (C16H32O2) and stearic (C18H36O2) acids.
Peanut (Arachis hypogaea) oil is rich in UFA (oleic, linoleic and linolenic acids) and poor in SFA, while its kernel is the major source of vegetable protein, dietary fiber, antioxidant vitamins, minerals and phytochemicals.3
Babassu (Attalea speciosa) oil presents high levels of fats used in food and industrial applications, as the production of
cosmetic, soap, detergent, glycerin, animal feed, lubricant and biofuel. It is composed by nearly 85% of SFA and 15% of UFA.4,5 Coconut (Cocos nucifera) oil has SFA as
principal components (over 80%). It is rich in lauric acid (levels over 40%), which is important to cosmetic and food industry due to its physical properties and oxidative resistance.6,7 Grape (Vitis vinifera) seed oil presents high
level of linoleic acid, higher than sunflower and soy oils, which is considered as the main characteristic for commercial interest.8,9
Castor (Ricinus communis) oil differs from the other vegetable oils because of its high amount of hydroxylated UFA, named ricinoleic acid (C18H34O3). The hydroxyl
group provides high viscosity and chemical stability for this compound.10,11 In ancient times, the homemade production
of castor oil was disseminated by Brazilian countryside families, which had low financial resources and difficulty in the access of health care, for its anti-inflammatory, antioxidant and laxative properties.12
electrophoresis,18,19 nuclear magnetic resonance,20-22 and
near-infrared spectroscopy.23,24 However, in the last decade
vibrational spectroscopies have been presented as an alternative, since the analysis is fast and usually the sample preparation is very simple.25-29 Raman spectroscopy is an
outstanding technique in the characterization of materials because allows obtaining finger print spectra with narrow and well resolved bands and water does not generate significant interference in the signal. This technique has been used in certification, authentication, search for adulteration of products, fatty acids determinations and in the analysis of the oxidation of oils.30-33 The stearic, oleic,
linoleic and linolenic acids have eighteen carbons in their chains, being differentiated by the degree of unsaturation. However, they can be separated by gas chromatography, as well as, identified through significant differences in some features by Raman spectroscopy.
In this context, this work characterizes the lipid profile of the oils extracted from the kernel of the nuts of peanut, coconut and babassu and the seeds of castor and grape through Raman spectroscopy and gas chromatography with flame ionization detection (GC-FID). A comparative study among three distinct castor oil samples through both techniques was also performed.
Raman spectroscopy allows inferring the chemical properties of the samples, such as the level of unsaturation and oxidation of the oils, without pre-treatment of the samples. The characterization of the lipid profile of the vegetable oils by GC-FID had the objective of obtaining quantitative information about their composition for comparing with the spectroscopic analysis. In addition, the results here obtained with both techniques and their presented interpretations have potential to be useful in applications for investigations of possible fraud, adulteration and deterioration of these oils.
Experimental
Samples
The oils extracted from the kernel of seeds and nuts of peanut, babassu, coconut, castor and grape were acquired in local market. Three distinct samples of castor oil were investigated. Besides the commercial one, two homemade was acquired, with a gap in their dates of manufacture of fifteen-year.
In the process of production of castor oil, commercial sample is extracted by cold pressing process of the seeds, whereas the homemade oil is obtained by heating process as follows: seeds are dried, powdered and heated at ca. 100-130 °C in a metallic recipient on a wood-burning
stove. Water is added under stirring until the maximum of the extraction of the oil, after ca. 12 h. In the sequence equal part of water is added and the mixture is allowed to settle overnight. The organic phase is formed (extracted oil) in the presence of aqueous phase, where residual solids in suspension are trapped. The separation of the phases is achieved by simple filtration.
Reagents and materials
Standard fatty acids C14:0 (myristic acid), C16:0 (palmitic acid), C18:0 (stearic acid), C18:1c (oleic acid), C18:2cc (linoleic acid), C18:3ccc (alpha-linolenic acid), as well individual standards of fatty acid methyl esters (FAME): C16:0 (palmitic acid), C18:0 (stearic acid), C18:1c (oleic acid), C18:2cc (linoleic acid), C18:3ccc (alpha-linolenic acid) and ricinoleic acid, and a mixture of commercial standards composed by 37 fatty acid methyl esters (FAME 37), were purchased from Sigma-Aldrich, St. Louis, MO, USA. Sodium hydroxide, methanol, acetic acid, anhydrous sodium sulfate and hexane were purchased from Vetec, Duque de Caxias, RJ, Brazil. Deionized water was obtained by a reverse osmosis system.
The methanolic solution of NaOH 0.5 mol L-1 was
prepared and stored in a plastic flask at room temperature. Stock solutions of the individual standards of FAME, at the concentration of 20.0 mmol L-1, were prepared in hexane.
Such solutions were stored in glass flasks in a freezer at –20 °C until the moment of analysis.
Sample analysis by GC-FID
Samples of peanut, babassu, coconut, castor (homemade and commercial) and grape oils were prepared by base catalyzed transesterification, in duplicate, as follow: 20 µL of sample were transferred to a glass tube, 3.0 mL of 0.5 mol L-1
NaOH methanolic solution were added and the mixture was heated in a bath at 50 °C for 10 min in a capped tube. After that, 150 µL of glacial acetic acid and 5.0 mL of 0.8% m/m NaCl aqueous solution were added and the mixture were stirred by vortexing for 15 s. Next, 3.0 mL of hexane were added in order to extract FAME’s and the mixture was stirred by vortexing for 15 s. After phase separation, the upper organic one was transferred to a glass tube and the process was performed twice. The supernatant was dried by using 0.5 g of anhydrous Na2SO4.34,35 The samples were stored in
glass flasks at –20 °C until the moment of analysis, when they were transferred to a vial and injected into GC-FID analyzer without previous dilution.
a split-splitless injector, AOC 20-I auto-injector flame ionization detection. Data acquisition and analysis were performed in GC Solution software (Shimadzu, Kyoto, Japan). The column used was a CP-SIL 88 with 100 m length, internal diameter of 0.025 mm and film thickness of 0.2 µm (Agilent Technologies, Netherlands). The analysis conditions were: injector at 250 °C, flow controlled by linear speed of 26.0 cm s-1, pressure at 140.3 kPa, total flow of 22.6 mL min-1,
injection of 1.0 µL in the split mode, initial temperature of column at 80 °C with heat ratio of 4 °C min-1 up to 220 °C,
isotherm at 220 °C for 5 min, heat ratio of 4 °C min-1 up to
240 °C and isotherm at 240 °C for 10 min.
The analysis condition for castor oil samples were: injector at 250 °C, flow controlled by linear speed of 26.0 cm s-1, pressure at 140.3 kPa, total flow of 22.6 mL min-1,
injection of 1.0 µL in the split mode, initial temperature of column at 80 °C with heat ratio of 4 °C min-1 up to 220 °C,
isotherm at 220 °C for 5 min, heat ratio of 4 °C min-1 up
to 240 °C and isotherm at 240 °C for 10 min, heat ratio of 3 °C min-1 up to 270 °C and isotherm 270 °C for 6 min.
The normalized areas were used in the analysis of fatty acids by GC, as the recommendation of The American Oil Chemists’ Society.36,37 Hence, the areas of all peaks were
integrated in the chromatogram of each fatty acid and the quantification in the oil samples was done by the ratio of the integrated areas from the respective standards. The compounds were identified by standard co-injection and retention time relative to the FAME 37 standard, a mix with 37 methyl ester fatty acids. The fatty acid concentrations were determined and expressed in g per 100 g of fat.
Sample analysis by Raman spectroscopy
Oil samples and fatty acids standards were analyzed in a Bruker RFS 100 instrument equipped with a Nd3+/YAG
laser operating with wavelength at 1064 nm, and with a Ge detector cooled with liquid nitrogen. The samples, without pre-treatment, were placed in borosilicate glass tubes, which were fixed on a support and aligned with the laser beam and the light was collected at a 180° geometry. The spectra were obtained with 256 scans, using a laser power of 100 mW and spectral resolution of 4 cm-1, in the range
from 3500 to 200 cm-1.
Results and Discussion
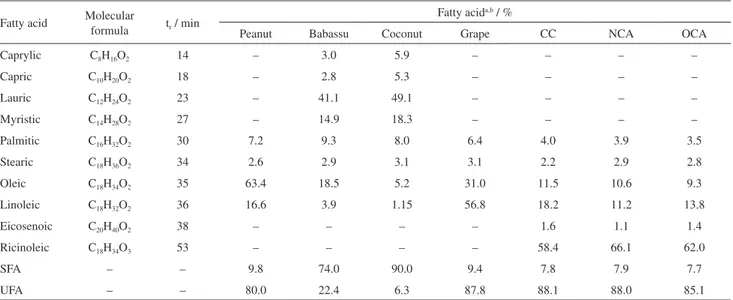
The separation, identification and quantification of the levels of fatty acids in the oils of peanut, babassu, coconut, grape and castor were performed through GC-FID analyses. These results were obtained based on the previous analysis of the FAME 37 mixture that was injected and used to obtain the retention time of the fatty acids of interest presented in the vegetable oil samples. The final concentrations of the fatty acids for each oil samples are presented in Table 1.
In the analysis of chromatographic profile of peanut oil sample, the predominance of palmitic, stearic, oleic and linoleic acids were verified; with UFA composition at 80.0%. In babassu oil the major fatty acids found were caprilic, capric, lauric, myristic, palmitic, stearic, oleic and linoleic acids, which gives 74.0% of SFA composition.
Table 1. Fatty acid composition in the vegetable oil samples at mass percentage
Fatty acid Molecular
formula tr / min
Fatty acida,b / %
Peanut Babassu Coconut Grape CC NCA OCA
Caprylic C8H16O2 14 – 3.0 5.9 – – – –
Capric C10H20O2 18 – 2.8 5.3 – – – –
Lauric C12H24O2 23 – 41.1 49.1 – – – –
Myristic C14H28O2 27 – 14.9 18.3 – – – –
Palmitic C16H32O2 30 7.2 9.3 8.0 6.4 4.0 3.9 3.5
Stearic C18H36O2 34 2.6 2.9 3.1 3.1 2.2 2.9 2.8
Oleic C18H34O2 35 63.4 18.5 5.2 31.0 11.5 10.6 9.3
Linoleic C18H32O2 36 16.6 3.9 1.15 56.8 18.2 11.2 13.8
Eicosenoic C20H40O2 38 – – – – 1.6 1.1 1.4
Ricinoleic C18H34O3 53 – – – – 58.4 66.1 62.0
SFA – – 9.8 74.0 90.0 9.4 7.8 7.9 7.7
UFA – – 80.0 22.4 6.3 87.8 88.1 88.0 85.1
ag of fatty acid per 100 g of total fatty acid; ball measurements were performed in duplicate and relative standard deviation (%RSD) of all samples were
below 5%. tr: retention time; CC: commercial castor oil; NCA: newer homemade castor oil; OCA: older homemade castor oil; SFA: saturated fatty acids;
In coconut oil the same major fatty acids from babassu oil were found, with 90.0% of SFA. In grape oil sample, palmitic, stearic, oleic and linoleic acids were identified and UFA composition was 87.8%.
In the commercial castor oil were predominant palmitic, stearic, oleic, linoleic, eicosenoic and ricinoleic fatty acids, with UFA composition at 88.1%, from which 58.4% were ricinoleic acid. From both newer and older homemade castor oils the same major components were found, with UFA composition at 88.0 and 85.1%, from which 66.1 and 62.0% were ricinoleic acid, respectively. It is noteworthy that even though the alpha-linolenic acid was chosen in detriment of its other isomers, this UFA species was not identified in all analyzed oil samples. For instance, the presence of gamma-linolenic acid is not common in vegetable oils, but it could be detected and differentiated from its isomers by GC technique.
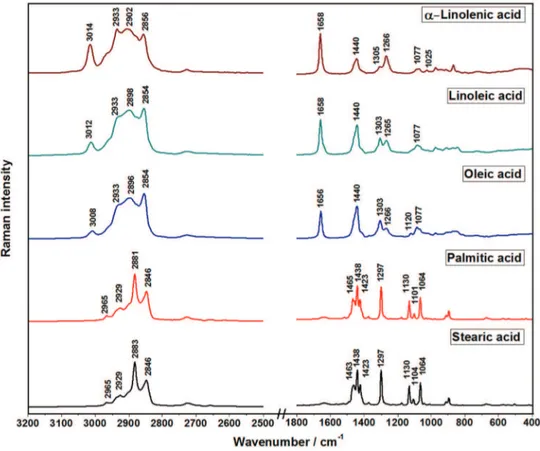
The Raman spectra of standard samples of alpha-linolenic, linoleic, oleic, palmitic and stearic acids are presented in Figure 1. The tentative assignments of the bands, based on pertinent literature,38-41 are presented in
Table 2.
These results show that there are two distinct spectral patterns ascribed to UFA (alpha-linolenic, linoleic and oleic acids) and SFA (palmitic and stearic acids). The common bands for all these standard samples were observed with
different relative intensities, at 2933-2929, 1440-1438 and 1305-1297 cm-1, and assigned to the asymmetric stretching
of CH2, bending of CH2/CH3 groups and torsion of CH2,
respectively.
Figure 1. Raman spectra of standard samples of fatty acids. All spectra were normalized based on the intensities of the bands at 2906-2880 cm-1 region.
Table 2. Tentative Raman assignment of the bands of standard fatty acids
Wavenumber / cm-1 Assignment
Oleic Linoleic α-Linolenic Palmitic Stearic
3008 3012 3014 νas(CH)
2965 2965 νas(CH3)
2933 2933 2933 2929 2929 νas(CH2)
2896 2898 2902 νs(CH3)
2881 2883 νas(CH2)
2854 2854 2856 2846 2846 νs(CH2)
1656 1658 1658 ν(C=C)
1465 1463 δ(CH2, CH3)
1440 1440 1440 1438 1438 δ(CH2, CH3)
1423 1423 ν(COO-)
1303 1303 1305 1297 1297 τ(CH2)
1266 1265 1266 δ(CH)
1130 1130 ν(C–C)
1077 1077 1077 1064 1064 ν(C–C)
The bands at 3014-3008, 1658-1656 and 1266-1265 cm-1,
assigned to the stretching of CH, the stretching of C=C and the bending of CH, respectively, all involving the unsaturation moieties of UFA cis isomers, showed intensities proportional to the number of double bonds present in the molecular structure of the standard fatty acids. Hence, in the Raman spectra of oleic acid such bands presented one-third of the respective intensities observed in the spectra of alpha-linolenic acid and one half of those present in the spectra of linoleic acid.
Such a differentiation allows conceiving a future work in which could be used chemometrics tools, as for instance multivariate calibration, for identification of oil samples by using Raman spectroscopy.
In the Raman spectra of UFA the enlargement of the bands and the shifts to higher wavenumbers, when compared with SFA ones, are marker features for the presence of double bonds. In particular, the enlargement one can be ascribed to the breaking of the spectral degeneracy by the nonequivalence of the carbons in the polymer chains.40
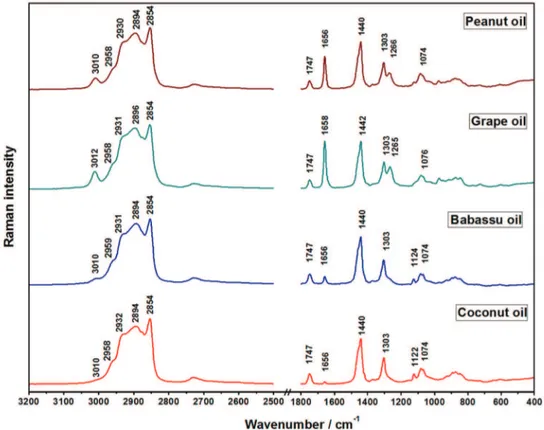
The Raman spectra of the vegetable oils are shown in Figures 2 and 3. The assignments of the features were performed based on the Raman spectra of the standard fatty acids and the data are presented in Table 3.
It is possible to notice that the band at 1658-1656 cm-1,
assigned to the stretching of C=C group, presented relative
intensity in accordance with the level of unsaturation, which was from 80.0 to 88.1% of UFA for peanut, grape and castor oils. Such features are ascribed to cis isomer of UFA and the absence of bands at 1670 cm-1, assigned to the same mode
from trans isomer, allows inferring the contamination with
trans groups was not present in all analyzed oil samples.38
In the spectra of babassu and coconut oils the bands at 3010 and 1656 cm-1, assigned to asymmetric stretching of =C–H
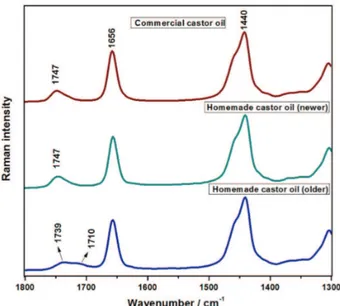
and stretching of C=C, respectively, presented low relative intensity, since their compositions are 74.0 and 90.0% of SFA. Therefore, the results from the assessment of the Raman spectra are in agreement with those obtained by GC-FID (Table 1). The band at 1747-1739 cm-1 was assigned to the
stretching of C=O from triacylglycerol structure that was present in all Raman spectra of oil samples.
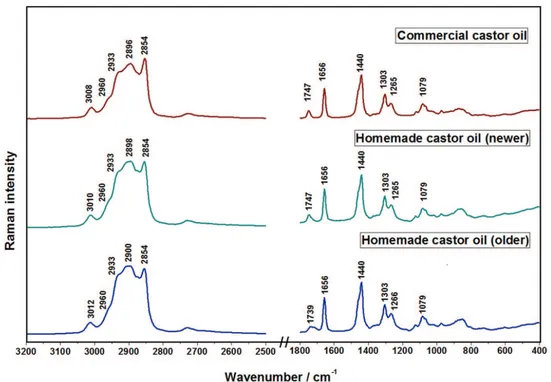
Commercial and homemade castor oils presented similar spectral profiles, with the Raman spectra presenting a pattern of the features characteristic of high level of UFA. However, commercial castor oil was extracted by a cold process while the homemade oils were extracted by a hot process. The similarity in the Raman spectra allows inferring the extraction methods did not interfere significantly in the composition of each castor oil sample. Nevertheless, in the older homemade castor oil, a new band at 1710 cm-1 was
observed, which was assigned to the carboxyl moiety from the oxidation of the sample (Figure 4) that can be explained
by its long time of storage. Such a marker Raman feature from the oxidative process was not observed for all other recent produced oil samples. Chromatographic profiles for the three castor oils were quite similar, but signs of impurity in the older homemade castor oil sample were observed. In conclusion, the Raman spectroscopy showed adequate for fast evaluation of the presence of oxidized chains in vegetable oil samples, even when the presence of this species is in very low concentration.
Conclusions
The GC-FID analyses allow determining the profile
of FA in the oil samples. Some peaks presented area percentage below 1% and were not identified, but major FA quantification in the samples were not compromised. Raman spectra of the different FA and vegetable oils presented characteristic marker bands of their chemical structure and composition. The intensities of the bands at 3014-3008, 1658-1656 and 1266-1265 cm-1 showed
correlation with the levels of unsaturated fatty acids present in the oil.
Commercial and newer homemade castor oils presented similar spectral profile; even though the commercial oil is extracted by a cold process while the homemade oil is extracted by a hot process, leading to conclude the
Figure 3. Raman spectra of homemade (newer and older) and commercial castor oils. All spectra were normalized based on the intensities of the bands at 2906-2880 cm-1 region.
Table 3. Tentative assignment of Raman bands of vegetable oils
Wavenumber / cm-1 Tentative
assignment
Peanut Grape Babassu Coconut CC NCA OCA
3010 3012 3010 3010 3008 3010 3012 νas(CH)
2930 2931 2931 2932 2933 2933 2933 νas(CH2)
2894 2896 2894 2894 2896 2898 2900 νs(CH3)
2854 2854 2854 2854 2854 2854 2854 νs(CH2)
1747 1747 1747 1747 1747 1747 1739 ν(C=O)
1656 1658 1656 1656 1656 1656 1656 ν(C=C)
1440 1442 1440 1440 1440 1440 1440 δ(CH2, CH3)
1303 1303 1303 1303 1303 1303 1303 τ(CH2)
1266 1265 – – 1265 1265 1266 δ(CH)
1074 1076 1074 1074 1079 1079 1079 ν(C–C)
extraction method does not interfere significantly in the oils composition. In the older homemade castor oil, a band at 1710 cm-1, assigned to carbonyl moiety from the oxidation
of the sample was observed, which can be rationalized by its long time of storage. However, such a marker Raman feature was not observed in all recent produced samples. Chromatographic profiles for the three samples were quite similar, but signs of impurity in the older homemade castor oil samples were observed. Raman spectroscopy revealed itself as an efficient and fast technique that can be used in the evaluation of the integrity of the oils and their esters, as well as in the search of information related to oils compositions and their degradation processes.
Acknowledgments
The authors would like to thank the CAPES, CNPq and FAPEMIG (CEX-APQ-02392-15) Brazilian funding agencies. This work is a collaboration research project of members of the Rede Mineira de Química (RQ-MG) supported by FAPEMIG CEX-RED-00010-14. INCTBio (FAPESP grant No. 2014/50867-3 and CNPq grant No. 465389/2014-7) is kindly acknowledged for the grants. The authors would like to thank Manuela Francisca da Silva (in memoriam) and Maria Luisa de Morais for the homemade castor oil samples.
References
1. Zhang, R.; Zhang, Z.; Zou, L.; Xiao, H.; Zhang, G.; Decker, E. A.; McClements, D. J.; J. Agric. Food Chem. 2015, 63, 10508. 2. Albuquerque, M. L. S.; Guedes, I.; Alcantara Jr., P.; Moreira, S. Figure 4. Raman spectra of homemade (newer and older) and commercial castor oils in the spectral region of carboxyl features.
G. C.; Barbosa Neto, N. M.; Correa, D. S.; Zilio, S. C.; J. Braz.
Chem. Soc. 2005, 16, 1113.
3. Kris-Etherton, P. M.; Hu, F. B.; Ros, E.; Sabaté, J.; J. Nutr. 2008,
138, 1746S.
4. Ferreira, B. S.; Faza, L. P.; Hyaric, M. L.; Sci. World J. 2012, 532374.
5. Machado, G. C.; Chaves, J. B. P.; Antoniassi, R.; Rev. Ceres 2006, 53, 463.
6. Laureles, L. R.; Rodriguez, F. M.; Reaño, C. E.; Santos, G. A.; Laurena, A. C.; Mendoza, E. M. T.; J. Agric. Food Chem. 2002, 50, 1581.
7. Mel’nikov, D. P.; Antonov, I. A.; Kotelev, M. S.; Novikov, A. A.; Vinokurov, V. A.; Chem. Technol. Fuels Oils 2014, 50, 95. 8. Freitas, L. D. S.; de Oliveira, J. V.; Dariva, C.; Jacques, R. A.;
Caramão, E. B.; J. Agric. Food Chem. 2008, 56, 2558. 9. Cao, X.; Ito, Y.; J. Chromatogr. A 2003, 1021, 117.
10. Turner, C.; Whitehand, L. C.; Nguyen, T.; McKeon, T.; J. Agric.
Food Chem. 2004, 52,26.
11. Muller, H. G.; Introduccion a la Reologia de los Alimentos, 1st ed.; Acribia Ed.: Zaragoza, Spain, 1978.
12. Bernardi, D. S.; Pereira, T. A.; Maciel, N. R.; Bortoloto, J.; Vieira, G. S.; Oliveira, G. C.; Rocha, P. A.; J. Nanobiotechnol. 2011, 9, 1.
13. Jabeur, H.; Zribi, A.; Makni, J.; Rebai, A.; Abdelhedi, R.; Bouaziz, M.; J. Agric. Food Chem. 2014, 62, 4893.
14. Becerra-Herrera, M.; Sánchez-Astudillo, M.; Beltrán, R.; Sayago, A.; LWT - Food Sci. Technol. 2014, 57, 49.
15. Cajka, T.; Riddellova, K.; Klimankova, E.; Cerna, M.; Pudil, F.; Hajslova, J.; Food Chem. 2010, 121, 282.
16. Aparicio, R.; Aparicio-Ruíz, R.; J. Chromatogr. A 2000, 881, 93.
17. Porto, B. L. S.; Mendes, T. O.; Franco, D. F.; Martini, W. S.; Bell, M. J. V.; de Oliveira, M. A. L.; Rev. Inst. Adolfo Lutz 2016,
75, 1694.
18. Balesteros, M. R.; Tavares, M. F. M.; Ribeiro, S. J. L.; Polachini, F. C.; Messaddeq, Y.; de Oliveira, M. A. L.; Electrophoresis 2007, 28, 3731.
19. Vergara-Barberan, M.; Escrig-Domenech, A.; Lerma-Garcia, M. J.; Simo-Alfonso, E. F.; Herrero-Martinez, J. M.; J. Agric.
Food Chem. 2011, 59, 10775.
20. Dais, P.; Hatzakis, E.; Anal. Chim. Acta 2013, 765, 1. 21. Guillén, M. D.; Goicoechea, E.; Food Chem. 2009, 116, 183. 22. Guillén, M. D.; Ruiz, A.; Food Chem. 2006, 96, 665. 23. Christy, A. A.; Kasemsumran, S.; Du, Y.; Ozaki, Y.; Anal. Sci.
2004, 20, 935.
24. Özdemir, D.; Öztürk, B.; J. Food Drug Anal. 2007, 15, 40. 25. Dong, W.; Zhang, Y.; Zhang, B.; Wang, X.; J. Raman Spectrosc.
2013, 44, 1739.
26. Mailer, R.; J. Am. Oil Chem. Soc. 2004, 81, 823.
28. López-Díez, E. C.; Bianchi, G.; Goodacre, R.; J. Agric. Food
Chem. 2003, 51, 6145.
29. Zou, M.-Q.; Zhang, X.-F.; Qi, X.-H.; Ma, H.-L.; Dong, Y.; Liu, C.-W.; Guo, X.; Wang, H.; J. Agric. Food Chem. 2009, 57, 6001. 30. Mendes, T. O.; da Rocha, R. A.; Porto, B. L. S.; de Oliveira,
M. A. L.; dos Anjos, V. C.; Bell, M. J. V.; Food Anal. Methods 2015, 8, 2339.
31. Gurdeniz, G.; Ozen, B.; Food Chem. 2009, 116, 519. 32. Jentzsch, P. V.; Ciobotă, V.; Flavour Fragrance J.2014, 29,
287.
33. Guzmán, E.; Baeten, V.; Pierna, J. A. F.; García-Mesa, J. A.;
Food Control 2011, 22, 2036.
34. Christie, W. W.; Han, X.; Lipid Analysis, 4th ed.; Elsevier:
London, England, 2012.
35. Christie, W. W.; Advances in Lipid Methodology, vol. 2, 1st ed.;
Elsevier: London, England, 1993.
36. Official Method Ce1f-96, Reapproved 1997, Revised 2001;
Determination of cis and trans Fatty Acids in Hydrogenated
and Refined Oils and Fats by Capillary GLC; AOCS Press: New York, USA, 2009.
37. Official Method Ce 1h-05; Determination of cis-, trans-,
Saturated, Monounsaturated and Polyunsaturated Fatty Acids in
Vegetable or Non-Ruminant Animal Oils and Fats by Capillary
GLC; AOCS Press: New York, USA, 2009.
38. Bailey, G. F.; Horvat, R. J.; J. Am. Oil Chem. Soc. 1972, 49, 494.
39. da Silva, C. E.; Vandenabeele, P.; Edwards, H. G. M.; de Oliveira, L. F. C.; Anal. Bioanal. Chem. 2008, 392, 1489. 40. Czamara, K.; Majzner, K.; Pacia, M. Z.; Kochan, K.; Kaczor,
A.; Baranska, M.; J. Raman Spectrosc. 2015, 46, 4.
41. de Gelder, J.; de Gussem, K.; Vandenabeele, P.; Moens, L.;
J. Raman Spectrosc. 2007, 38, 1133.
Submitted: July 5, 2017
Published online: August 24, 2017