Natural antioxidants extraction and
their incorporation into model
pharmaceutical systems
Dissertation to obtain a Master Degree in Biotechnology
Supervisor: António Lopes, Ph.D, ITQB
Júri:
Presidente: Prof. Doutor Pedro Viana Baptista Arguente: Prof. Doutora Carla Brazinha
Vogal: Prof. Doutor António Lopes
Natural antioxidants extraction and
their incorporation into model
pharmaceutical systems
Dissertation to obtain a Master Degree in Biotechnology
Supervisor: António Lopes, Ph.D, ITQB
Ao Doutor António Lopes pela oportunidade que me deu, pela sempre boa disposição e claro por todas as explicações e ideias nos momentos em que foi precisa uma ajuda extra para andar para a frente.
Ao Doutor José Cochicho Ramalho e Doutor António Eduardo Leitão, por todo o apoio dado na parte dos estudos do café, pela boa disposição e por toda a disponibilidade incondicional que tiveram desde sempre.
À Doutora Isabel Marrucho e Doutora Isabel Mota Veiga, por estarem sempre ―ali ao lado‖, pelos momentos para desanuviar e por todo o apoio moral tanto em momentos baixos como altos.
À Joana Valério, pelo apoio, tanto inicial como durante todo o ano e pela companhia contínua durante a minha aprendizagem.
Um grande obrigado a todos os que colaboraram directamente comigo, para ajudar a realizar todo o trabalho ou simplesmente pela companhia e troca de ideias promovendo o meu crescimento pessoal e intelectual.
Um enorme obrigado ao Doutor Joakim Balogh, que não chega dizer apenas por palavras. Por todos os momentos claramente de ―ensino‖ (tanto intelectual como pessoal), pela força inabalável de promover a filosofia do ―pensar e ir ao cerne da questão‖, ainda que muitas vezes eu demorasse mais um bocado a lá chegar. Por toda a companhia, intercâmbio de cultura, pelas discussões sempre construtivas e por fim, pela amizade incondicional.
Nada disto seria possível, sem o apoio dos melhores companheiros de vida, os amigos. Sem eles, nada poderia fazer sentido. Eles sabem que são. Um obrigado especial ―Aos da infância‖, aos ―Trambas‖, aos ―da Faculdade‖ e a um ―núcleo duro‖ recente, por toda a galhofa, aventuras, por crescermos juntos, muitas vezes simplesmente apenas pela companhia ou apoio incondicional. Um inestimável, precioso e singular agradecimento, à Bárbara.
que se juntam com um propósito funcional: estudo da composição polifenólica em folhas de três genótipos de café e suas respostas aos stresses de frio e seca; análise do efeito da incorporação de dois antioxidantes e um fármaco num sistema de microemulsões modelo.
Três genótipos de café, Icatu, Obatã e Apoatã, foram submetidos a condições de stress de temperatura e teor hídrico, investigando-se a resistência dos cafeeiros aos tratamentos impostos. As respostas foram analisadas relativamente à fracção fenólica das folhas dos cafeeiros. Verificou-se que os polifenóis estão de facto envolvidos na resposta aos stresses abióticos impostos, sobressaindo o 4.5-diCQA que parece ter um papel essencial na recuperação ao frio na Obatã. Foram identificados e quantificados vários compostos fenólicos sendo os maioritários: 5-CQA, epicatequina, procianidina, 3,4-diCQA, 3.5-diCQA, 4.5-diCQA, 5-FQA e ainda a mangiferina como novidade em folhas de C. arabica e biomarcador de distinção entre
C. arabica e C. canephora Corroborou-se que a Apoatã (Coffea canephora) tem maior
quantidade de polifenóis do que Icatú e Obatã (Coffea arabica). Determinou-se que a Icatu e Obatã parecem ser mais resistentes ao stress de frio mas mais sensíveis à seca comparadas com Apoatã.
As microemulsões modelo são constituídas por um surfactante não-iónico, C12E5,
decano e água, estando este sistema muito bem caracterizado. Incorporaram-se dois antioxidantes, 5-CQA e α-tocoferol, e um fármaco, a lidocaína e estudou-se o seu efeito através dos diagramas de fases e DLS. Propôs-se um modelo geral, que defende que a adição de uma molécula hidrofílica aumenta as temperaturas da fase microemulsão (micelas) enquanto que uma hidrofóbica diminui, e que tem aplicações directas na indústria farmacêutica. A actividade antioxidante não é significativamente afectada dentro e fora da microemulsão e verificou-se um efeito sinérgico resultante da mistura 5-CQA e α-tocoferol no sistema.
Palavras chave: Polifenóis do café; stress de frio e seca; microemulsões; antioxidantes em
bonded with a functional purpose: study of the polyphenolic composition in leaves of three coffee genotypes and their responses to cold and drought stresses; and analysis of the effect of incorporation of some polyphenolic compounds in a microemulsion model system.
Three genotypes of coffee, Icatu Obatã and Apoatã, were subjected to temperature and water content stress conditions and their sensitivity or resistance to the treatments imposed was investigated. Responses were analyzed from phenolic fraction point of view in the leaves of coffee plants. It was found that polyphenols are actually involved in the response to these abiotic stresses and that the 4.5-diCQA seems to have an essential role in the recovery from cold in Obatã. Various phenolic compounds were identified and quantified, being the majority: 5-CQA, epicatechin, procyanidin, 3,4-di5-CQA, 3.5-di5-CQA, 4.5-di5-CQA, 5-FQA and mangiferin that was discovery as a new polyphenol in C. arabica and also works as a biomarker to differentiate between C. arabica and C. canephora.
It was confirmed that Apoatã (Coffea canephora) possesses a greater amount of polyphenols than Obatã and Icatu (Coffea arabica). It was ascertained that Icatu and Obatã seem to be more resistant to cold stress than Apoatã, but more sensitive to drought than Apoatã.
The model microemulsions is build up from a nonionic surfactant, C12E5, decane and
water, a system already well characterized. Two antioxidants, 5-CQA and α-tocopherol, and a drug, lidocaine, were incorporated in microemulsions, being the effect of its addition studied through phase diagrams and DLS. A general model was proposed, arguing that the addition of a hydrophilic molecule increases the temperature of the microemulsion phase (micelles), while a hydrophobic decreases, which is of most importance for pharmaceutical applications. The antioxidant activity is not significantly affected within and outside the microemulsion and was determined the existence of synergistic effect when mixing 5-CQA and α-tocopherol in this system.
Keywords: Coffee polyphenols; cold and drought stresses; microemulsions; antioxidants in
Acknowledgments ... V
Resumo ... VII
Abstract ... IX
Index ... XI
Figures index ... XIII
Tables index ... XIX
List of abbreviations, acronyms and symbols ... XXI
Objectives...XXIII
1.
Introduction ... 1
1.1 Coffee history ... 1
1.2 Botanical and environmental aspects of coffee plant ... 2
1.3 Drought and low temperatures effects on coffee plant and control of oxidative stress ... 3
1.4 Polyphenols in coffee – biological activities, properties and role ... 6
1.5 Impact of polyphenols on human health ... 12
1.6 Microemulsions - history and definition ... 17
1.7 Microemulsions properties ... 18
1.8 Components and properties ... 19
1.9 Microemulsions structures ... 24
1.10 Phase diagrams ... 26
1.11 Industrial Applications ... 29
2. Materials and methods ... 33
3. Results and discussion ... 39
3.1 Identification of polyphenols ... 39
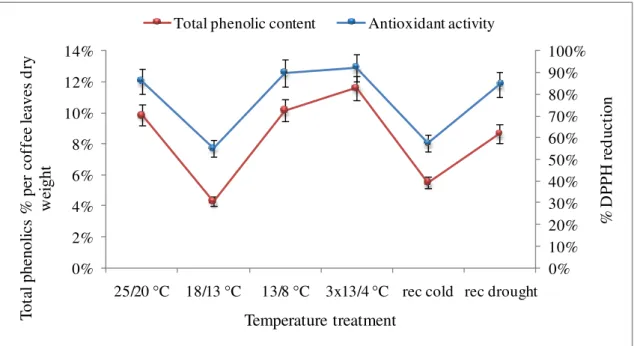
3.2 Response of polyphenols to drought and cold treatments ... 43
3.3 Antioxidant activity of coffee leaves extracts (DPPH method) ... 52
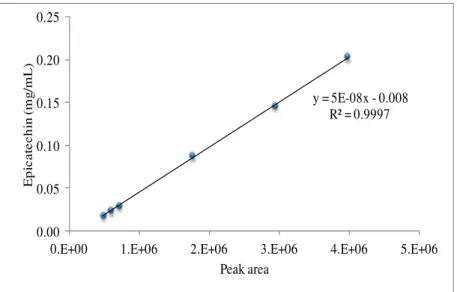
3.4 Quantification some phenolic compounds in coffee leaves ... 53
3.5 Standard microemulsion (C12E5 + decane + water) ... 60
3.6 Chlorogenic acid addition ... 70
3.7 Lidocaine addition ... 80
3.8 α-Tocopherol ... 84
Figure 1.2 Main families and biosynthetic pathways of plants polyphenols. ... 7
Figure 1.3 General chemical structure of hydroxybenzoic acids. ... 9
Figure 1.4 Chemical structure of hydroxycinnamic acids. ... 9
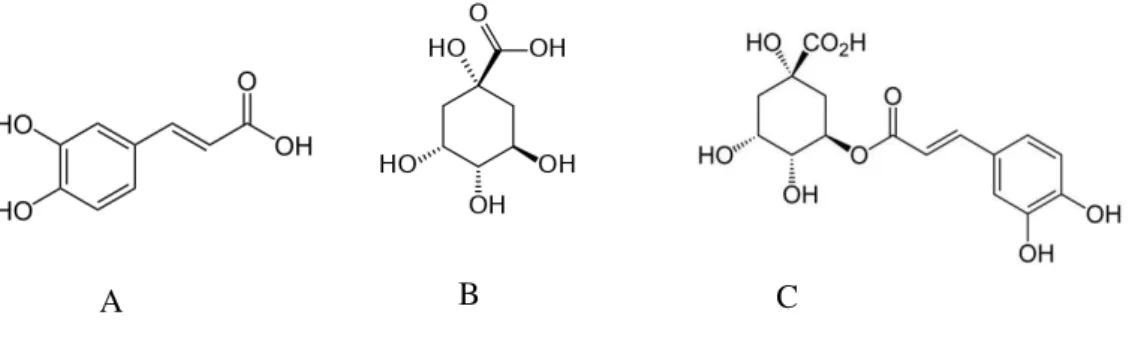
Figure 1.5 Chemical structures of: A
– Caffeic acid; B
– Quinic acid and C
–
Chlorogenic acid. ... 10
Figure 1.6 General chemical structures of flavonols. ... 11
Figure 1.7 Chemical structures of flavanols (above) and an example of a trimeric
procyanidin. ... 12
Figure 1.8 Polyphenols bioactivities ... 13
Figure 1.9 Chemical structure of 4.5-dicaffeoylquinic acid (4.5-diCQA). ... 14
Figure 1.10 Chemical structure of mangiferin. ... 14
Figure 1.11 α-tocopherol chemical structure. ... 15
Figure 1.11 Chemical structures of anionic surfactants. ... 20
Figure 1.12 Chemical structure of a cationic surfactant, ... 21
Figure 1.13 Chemical structure of a zwitterionic surfactant ... 21
Figure 1.14 Chemical structures of a non-ionic surfactant ... 22
Figure 1.15 Chemical structure of two different oils ... 23
Figure 1.16 Low (A) and high (B) curvature of the surfactant interface,
corresponding to bigger and smaller droplets ... 25
Figure 1.17 A few structures in which microemulsions may self-assembly ... 25
Figure 1.18 Schematic representation of two microemulsions: A - Oil-in-water
(O/W) and B - water-in-oil (W/O) microemulsions. ... 25
Figure 1.19 A hypothetical ternary phase diagram of an oil, surfactant and water
system. ... 27
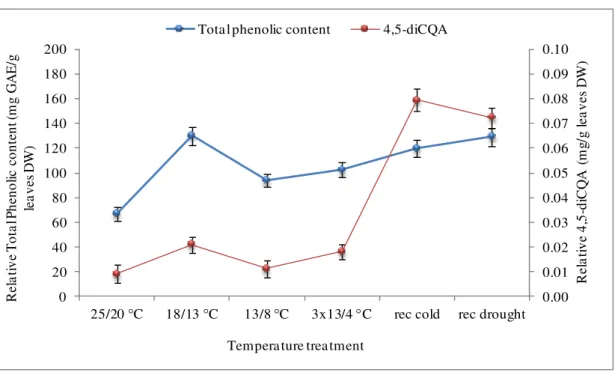
Figure 3.16 Comparison between 4.5-diCQA and total phenolic content profile
in response to cold treatment in Obatã (at control condition). ... 58
Figure 3.17 Microemulsion solutions as a function of temperature, showing
different macroscopic phases... 60
Figure 3.18 Phase diagram of the standard system (decane + C12E5 + water)
with fixed surfactant to oil volume ration (0.815:1), varying water dilution. ... 61
Figure 3.19 Diffusion (left axis) and polydispersity index (right axis) versus
temperature for the sample Φ = 0.05 ... 62
Figure 3.20 Diffusion (left axis) and polydispersity index (right axis) versus
temperature for the sample Φ = 0.15. ... 63
Figure 3.21 Size distribution by intensity, varying with temperature from 25 °C
to 31 °C of the Φ = 0.05 sample. ... 64
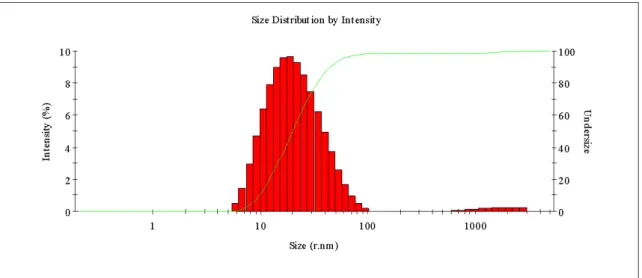
Figure 3.22 Histogram of the size distribution by intensity of the Φ 5% sample at
the lower phase boundary (25 °C). ... 65
Figure 3.23 Histogram of the size distribution by intensity of the Φ 5% sample
near the upper phase boundary (29.5 °C). ... 65
Figure 3.24 Correlation function versus time. It is represented Φ = 0.05 sample,
within the temperature trend, from 25 °C to 31 °C. ... 66
Figure 3.25 Diffusion versus temperature, of the standard system ... 68
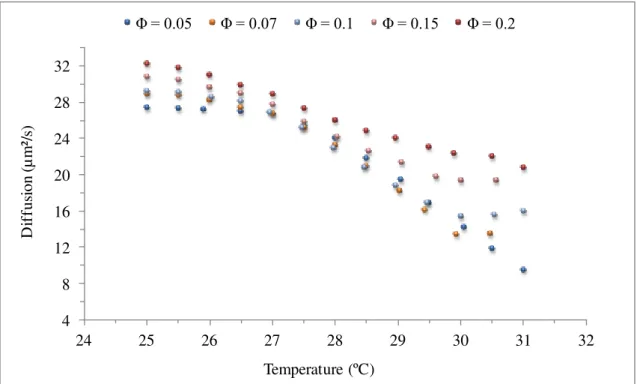
Figure 3.26 Diffusion coefficient versus volume fraction ... 69
Figure 3.27 Relative diffusion coefficient values (Dc/D0) and the hard spheres
behavior prediction, versus volume fraction. ... 69
Figure 3.28 Phase diagram of the microemulsions with 5-CQA addition (in
percentage by volume) ... 71
Figure 3.29 Phase diagram of the microemulsions with the addition of 5-CQA.72
Figure 3.30 Size distribution by intensity, showing the Φ =
0.05 with 0.25%
Figure 3.31 Correlation function versus time, showing the Φ =
0.05 with 0.25%
5-CQA addition sample... 73
Figure 3.32 Diffusion versus temperature of the, Φ =
0.05 with 1% NaCl
addition microemulsion sample and comparing with Standard Φ =
0.05 microemulsion.
... 74
Figure 3.33 Diffusion versus temperature of the, Φ =
0.15 with 1% NaCl
addition microemulsion sample and comparing with Standard Φ = 0.15 microemulsion.
... 75
Figure 3.34 Zeta potential distribution, total counts versus Zeta Potential ... 76
Figure 3.35 Zeta potential versus percentage (in volume) of 5-CQA addition of
the Ф = 0.05 microemulsion. ... 76
Figure 3.36 Zeta potential versus volume fraction with a 1% 5-CQA addition in
microemulsions samples. ... 77
Figure 3.38 Diffusion versus temperature, where are represented for the Φ = 0.15
microemulsion with different percentages (in volume) of 5-CQA addition. ... 78
Figure 3.37 Proposed model for the effect of a hydrophilic antioxidant addition
to a non-ionic microemulsion ... 79
Figure 3.38 Phase diagram of microemulsions with lidocaine addition ... 80
Figure 3.39 Diffusion versus temperature, of the standard system and Ф =
0.05
samples, with 1%, 5% and 10% lidocaine addition. ... 81
Figure 3.40 Size distribution by intensity, showing the Φ =
0.05 sample, with
5% lidocaine addition, between 22.5 °C and 28.5 °C. ... 82
Figure 3.41 Correlation function versus time. It is represented the Φ =
0.05
of lidocaine addition and also the standard Φ = 0.15 microemulsion... 86
Figure 3.47 Size distributed by intensity, showing the behavior of the Ф =
0.15
microemulsion sample with 5% α
‐
tocopherol addition, between 17 °C and 22 °C. ... 87
Figure 3.48 Correlation function (%) versus time (μs) ... 87
Figure 3.49 Proposed model for the effect of a hydrophobic antioxidant addition
to a non-ionic microemulsion ... 88
Figure 3.50 Calibration curve of DPPH in methanol ... 89
Figure 3.51 Reduction of DPPH with 5-CQA addition. ... 90
Figure 3.52 Calibration curve of DPPH in decane. ... 91
Figure 3.53 Reduction of DPPH with α-tocopherol addition... 91
Figure 3.54 EC50% (g antioxidant/kg DPPH) versus chlorogenic acid and
α-tocopherol. ... 92
Figure 3.55 Calibration curve of DPPH in Ф = 0.05 microemulsion. ... 93
Figure 3.56 Reduction of DPPH with 5-CQA addition in Ф =
0.05
microemulsion. ... 93
Figure 3.57 Reduction of DPPH with 5-CQA addition both in bulk and in Ф =
0.05 microemulsion.. ... 94
Figure 3.58 Reduction of DPPH with α-tocopherol addition... 95
Figure 3.59 Absorbance (at 515 nm) versus antioxidant concentration
(μmol/dm3). ... 96
Table 1.1 Main differences between arabica and robusta coffee plant species .... 2
Table 1.2 Major differences between microemulsions and emulsions. ... 18
Table 3.1 Identification of phenolic compounds for Icatu ... 40
Table 3.2 Identification of phenolic compounds for Obatã ... 41
Table 3.3 Identification of phenolic compounds for Apoatã ... 42
Table 3.4 – Changes in total phenolic content of coffee leaves in relation to cold
and drought treatments for Icatu genotype ... 45
Table 3.5. Changes in total phenolic of coffee leaves in relation to cold and
drought treatments for Obatã genotype ... 47
Table 3.6 Changes in total phenolic content of coffee leaves in relation to cold
and drought treatments for Apoatã genotype.. ... 49
Table. 3.7 5-CQA content in coffee leaves (mg/g dry weight leaves). ... 56
Table 3.8 Average of the total values (mg/g leaves dry weight) of the remaining
phenolic compounds identified for the three water content conditions and for three
genotypes.. ... 57
5-CQA 5-caffeoylquinic acid APX Ascorbate peroxidase
C12E5 Pentaethylene glycol monododecyl ether
CFQA Caffeoylferuloylquinic acid CGA Chlorogenic acids
CMC Critical Micelle Concentration
Ctr Control
DAD Diode Array Detector diCQA Dicaffeoylquinic acid diFQA Diferuloylquinic acid di-p-CoQA Di-p-coumaroylquinic acids DLS Dynamic Light Scattering DNA Deoxyribonucleic acid DPPH 2,2-diphenyl-1-picrylhydrazyl
E-O Ethylene oxide
FQA Feruloylquinic acid GAE Gallic acid equivalents GR Glutathione reductase
HIV Human immunodeficiency virus ICO International Coffee Organization L3 Bicontinuous structure
LDL Low Density Lipoprotein
Lα Lamellar phase
MD Mild Drought
O/W Oil-in-water
PAL Phenylalanine ammonia-lyase p-CoQA p-coumaroylquinic acids ROS Reactive Oxygen Species
TPC Total Phenolic Content
UV Ultra-violet
W/O Water-in-oil
γ Surface Tension
ΔA Surface Area
ΔG Gibbs free energy
ΔS Entropy change
I. Study the variation of the polyphenolic composition in coffee tree leaves and relate it with temperature (cold) and water availability (drought) stresses.
Most of the existing literature is made for coffee beans; hence this study will be a novelty because it will be made in leaves, contributing to a broader analysis of the whole coffee plant. Coffee is an economically valuable product (worldwide), and by relating polyphenols to abiotic stresses resistance, may contribute in the future, to higher product yields and also to make uso of the whole plant.
II. Make an extensive qualitative and quantitative analysis of the polyphenolic composition, using three different coffee plant genotypes (already used in the market): Icatu, Obata and Apoatã.
III. Identify a molecule that works as a biomarker to relate the status of temperature and drought stress imposed.
IV. Characterize a model microemulsion (C12E5/decane/water) through phase diagrams
construction and Dynamic Light Scattering.
V. Develop formulations with antioxidants incorporated (α-tocopherol and 5-caffeoylquinic acid) and a drug, lidocaine and evaluate the effect of the incorporation of this components in the system.
VI. Evaluate the antioxidant capacity of the formulations and verify if there is a synergistic effect between the antioxidants in this system.
1.
Introduction
1.1 Coffee history
Historically, coffee has been a desired product for more than a millennium. As a legend, it is said that coffee was probably originated in Kaffa, province of Ethiopia, around the year 800 A.D., when a shepherd was very surprised with the vividness of his goats after they ate this red coffee beans. It was allegedly here that coffee was born.
Apart from this one and other legends that may have arisen, what is really known is that, around the year 1000. after a few monks had religiously drunk coffee and exploited its stimulating effect, as other properties such as, better concentration, increase of attention and keeping them awake, the desire for the coffee drink began to expand across the entire world. Arabia was the main exporter by using infertile beans that kept them in first place as traders, until around 1600. From this point on, the expansion of the coffee plant trade had evolved through successive deviations (stealing) from country to country, as the stimulating feeling caused by this drink was enjoyed by all who were experiencing it. Finally when coffee crossed the Atlantic (1727-1800) it bloomed in Brazil where it carefully began to be mass-produced and protected for its value, until the present day, being now considered an everyday elixir, a pleasure drink for the people (1-3).
Botanical and environmental aspects of coffee plant
1.2 Botanical and environmental aspects of coffee plant
Coffee belongs to the botanical family Rubiaceae, which has some 500 genera and over 6.000 species. Coffee plants are a member of Coffea genus and there are about 90 species. From these, the ones that economically dominate the world coffee trade, include C. arabica, C.
canephora (being Coffea robusta the most known variety) as the majority and also, C. liberica
and C. dewevrei.
From all the coffee species, the two most important (trade and consumed) are Coffea
arabica L. and Coffea canephora Pierre (also known as Coffea robusta), which accounts for
over 60% of world production. Arabica coffee is the more consumed, accounting for about 62% and robusta practically for the rest. When comparing the two species, arabica and robusta, several differences are found being some presented in table 1.1. For instance although robusta coffee plants appear to be more vigorous, productive, robust (―giving is name to use‖) and have a higher caffeine content, the beverage derived from its beans is considered to be of lower quality than the one from arabica coffee (6).
Table 1.1 Main differences between arabica and robusta coffee plant species (7, 8).
The coffee crop is confined to the inter-tropical zone (figure 1.1), due to its required climatic conditions such as temperature and humidity. Major changes that occur in these two parameters may affect the coffee yields, turning them into the main environmental ―enemies" for the coffee plant, being drought the more frequent followed by cold and frost. Frost occurs from time to time damaging or even killing the coffee plant. In the case of drought, episodes are
Characteristic arabica robusta
Date species described 1753 1895
Chromosomes (2n) 44 22
Time from flower to ripe cherry 9 months 10-11 months
Flowering after rain irregular
Ripe cherries fall stay
Yield (kg beans/ha) 1500-3000 2300-4000
Root system deep shallow
Optimum temperature (yearly average) 15-24° C 24-30° C Optimal rainfall 1500-2000 mm 2000-3000 mm
Optimum altitude 1000-2000 m 0-700 m
Caffeine content of beans 0.8-1.4% 1.7-4.0% Typical brew characteristics acidity bitterness, full
more frequent, thus this environmental stress highly affects the coffee production, causing prices to rise due to decrease of yield, that may fall to 80% in very dry years (9).According to these confined environmental growth conditions, it is possible to understand why countries like Brazil and Colombia are leaders in coffee production. In fact, according to the "Coffee Monthly Market Report" of July 2011 (5), obtained from ICO, when analyzing the market fundamentals, the main exporting countries were (figure 1.1), Brazil, Vietnam, Colombia, Indonesia, Ethiopia, India and Mexico (in descending order).
Figure 1.1 Major coffee producing countries in the world. The top ten coffee producers are shown in
yellow (1).
Knowing the concepts behind the coffee plant ecophysiology has been one of the main aims attempted to achieve, since it is one of the most consumed and traded products (commodities) in the world (10). The major key issues to be studied not only by scientific areas as biotechnology, biochemistry, genetics, agriculture industry but also, more indirectly by economy, have been the improvement of: coffee plant production conditions, performance, growth, development and understand what influences the acclimation ability to environmental stresses.
1.3 Drought and low temperatures effects on coffee plant and control of
oxidative stress
Drought and low temperatures effects on coffee plant and control of oxidative stress
and drought. A few cultivars have been released from some research centers, such as Icatu Vermelho, Icatu Amarelo, Obatã and Catucaí. These cultivars and other genotypes have shown the high profitability level of the investments being made by genetic breeding research and are being prepared to be released in the market (11).
Examples of some studied genotypes are:
1. Icatu
This genotype, hybrid of C. canephora x C. arabica - IAC 2944, is very similar to arabica, since it was backcrossed so many times with arabica, that some researchers consider it as such. It is a high stature plant, vigorous, medium to late fruit maturing, rust resistant and gives an excellent beverage quality. Icatu species seem to tolerate cold better, especially at their initial development stages (12).
2. Obatã
The genotype IAC Obatã 1669-20 is derived from the crossing of Villa Sarchi (C. arabica) coffee with the Timor Hybrid (C. arabica x C. canephora), conducted by the ―Centro de Investigação das Ferrugens do Cafeeiro‖ (CIFC), in Oeiras, Portugal. It is a cultivar of low stature, vigorous, with high resistance to rust, large fruits and seeds and are highly productive plants, with yields averaging between 60 and 70 bags of green coffee per hectare. It is demanding in irrigation and nutrition. Have shown excellent production and quality of the coffee beverage is good, which is why the use of this genotype has rapidly increased (12-14).
3. Apoatã
Apoatã is different when compared to the two mentioned above, since it is a cultivar of Coffea canephora (C. canephora cv. Apoatã IAC 2258). Normally used as rootstocks, it is resistant to some nematodes species and rust and it is a vigorous plant, although it has a much more developed root system than arabica coffee, it shows to be more sensitive to cold than the other one, as also indicated in table 1.1 (12).
1.3.1 Plant responses to drought and cold stresses involving oxidative stress
The responses of plants to abiotic stresses such as drought and cold are very complex to interpret, showing different modifications in conjunction with the soil drought. All the dynamics involved in soil water depletion, plant growth and different temperatures are major sources of variation in responses to these types of stress that may often be a result of multidimensional stress (23).
The primary effects regarding abiotic stress, such as drought and cold, are mostly related to: cellular damage and enzyme inactivation, resulting for example from oxidative and osmotic stress, leading to the breakdown of homeostasis, proteins and membranes damage. An inevitable consequence is the breaking of electron transport in chloroplasts to molecular oxygen. When this happens there is a decrease in energy consumption without a significant reduction in energy capture and this will contribute to a higher possibility of transfer the excited state of chlorophyll to O2, producing O2.-, which in turn can lead to •OH and H2O2 formation. These
molecules are known as reactive oxygen species (ROS) and are responsible for damage of the cellular machinery, causing lipid peroxidation and consequently membrane injury, enzyme inactivation, protein degradation and disruption of DNA strands (24-29).
All this imbalance triggers several protection mechanisms (controlled by downstream signaling and transcriptional control), as:
osmoprotection (proline accumulation) and antifreezing proteins (30) (chitinase, heatshock proteins and coldrelated genes);
control of highly reactive oxygen species by, superoxide dismutase (SOD), ascorbate peroxidase (APX) and glutathione reductase (GR), as well as ascorbate and α-tocopherol molecules (10);
promotion of the reduction of energy capture, mainly in leaves by its movements and rolling, and also by chloroplasts movements to the opposite side where the light is focused, thus decreasing the absorption of incident radiation by until 40% (31, 32).
All these processes prevent the over-reduction of the electron transport chain and the over-acidification of the thylakoid lumen (which would photodamage the photosystem II), and contribute to the decreasing of highly reactive compounds that are generated during the induced plant stress (28).
Polyphenols in coffee – biological activities, properties and role
abiotic stresses, including cold, drought, and pathogen defense by acting as free radicals scavengers (33).
1.4 Polyphenols in coffee
–
biological activities, properties and role
As previously stated, coffee has always been a very popular drink due to its stimulant effects, enjoyed by all who have tasted it, but during the last decades, there has been a new interest related to one of its major constituents, these secondary metabolites: polyphenols.
Nowadays, polyphenols have gained a major interest by the community due to associated benefits to human health. They can be found in fruits, vegetables, cup of tea or coffee and even in a glass of red wine.
Plants synthesize a wide range of organic compounds, and those with fundamental functions associated with photosynthesis, growth and development of the plant, are considered primary metabolites. On the other hand, there are the secondary metabolites that despite having been ignored for too long are now becoming attractive. They have been related to have a major role in plant protection, from UV light, pathogens attack and protection responses for other biotic and abiotic stresses (34). In addition, secondary metabolites may have diverse interests, since they can be used as dyes, flavoring agents, drugs, and also viewed as potential sources of new natural drugs. However, these are distinguished from the classical vitamins or pharmaceutical drugs, once they are not used for short-term well being. Instead there have been multiple evidences that the long-term administration of them may have favorable effects on various types of diseases: cancer, chronic diseases, especially cardiovascular and diabetes type II (35-37).
1.4.1 Phenylpropanoid pathway
Briefly, the entrance to the phenylpropanoids pathway is the shikimate pathway that generates (besides the shikimate), three aromatic amino acids: phenylalanine, tyrosine, and tryptophan. From this point on the formation of phenylpropanoids (polyphenolic compounds), occurs through the phenylpropanoid pathway starting with the deamination of L-phenylalanine into trans-cinnamic acid, catalized by the enzyme phenylalanine ammonia-lyase (PAL).
Figure 1.2 Main families and biosynthetic pathways of plants polyphenols.
From trans-cinnamic acid, two major groups can be formed: hydroxybenzoic acids (gallic acid and protocatechuic acid, for example) and hydroxycinammic acids (caffeic, ferulic acid and chlorogenic acid for example). Hydroxybenzoic acids usually appear in very low amounts in plants. Otherwise, hydroxycinnamic acids, are found in much larger quantities in plants, especially in coffee plant, hence they will be more covered in this chapter.
Hydroxycinnamic acids are produced, from trans-cinnamic acid, via several reactions such as hydroxylation, methylation and dehydratation. Some examples are: p-coumaric, caffeic, ferulic, sinapic acids and chlorogenic acid. Finally, from this hydroxicinnamic acids, hydroxicinnamoyl alcohol derivatives can be formed, that through oxidative polymerization become the units lignin polymers (33, 38).
Shikimic acid Phenylalanine Trans-cinnamic acid
Hydroxybenzoic acids (gallic acid)
Hydroxycinnamic acids
caffeic acid
ferulic acid
sinapic acid
chlorogenic acid
Flavonoids
Stilbenes
Proanthocyanidins
Antocyanins
Condensed tannins
PAL
Coumarins
Polyphenols in coffee – biological activities, properties and role
The subcellular localization (intracellular, plastidial) of these pathways has been investigated for more than a decade. They may be produced near the site of infection in case of a pathogen attack, accumulation in the epidermis in case of increased UV radiation, and accumulation in vacuoles as glycosides or other conjugates for later use (39), thus it often depends on the stress to which the plant is imposed. However it is not known whether the compounds are synthesized in situ or are transported by adjacent cells (40, 41).
1.4.2 Polyphenols classification
Secondary metabolites of plants can be divided into three major groups: 1) Phenolic acids and flavonoids;
2) Terpenoids;
3) Nitrogen-containing alkaloids and sulfur-containing compounds.
For the purpose of this work, only the first group will be detailed: flavonoids and phenolic acids. Even with more detail in phenolic acids rather than flavonoids, despite both being present in coffee, coffee leaves are much richer in phenolic acids than flavonoids (42).
Polyphenolic compounds are ubiquitous constituents of higher plants and therefore found in many commonly consumed beverages, such as wine, tea and coffee (42-44). They are characterized to have at least one aromatic ring with one or more hydroxyl groups attached. Depending on their structure (more than 8.000 structures have been reported) (45), they can be classified in different ways, based on the number and arrangement of carbon atoms.
1.4.3 Phenolic acids
There are two major classes of phenolic acids: hydroxybenzoic acids and hydroxycinnamic acids.
being the latter one best known as a plant hormone or a compound that can be used for the preparation of aspirin (acetylsalicylic acid) (46).
Figure 1.3 General chemical structure of hydroxybenzoic acids (44).
Hydroxycinnamic acids are much more common in plants than hydroxybenzoic acids. They have a C6-C3 skeleton (figure 1.4) being p-coumaric, caffeic, ferulic and sinapic acids, the most common.
Figure 1.4 Chemical structure of hydroxycinnamic acids (44).
One of the best known compounds of this subclass is 5-caffeoylquinic acid (5-CQA), commonly referred to as chlorogenic acid, gives name to another great family related to, trans-cinnamic and quinic acids conjugates.
1.4.4 Chlorogenic acids
Polyphenols in coffee – biological activities, properties and role
Figure 1.5 Chemical structures of: A – Caffeic acid; B – Quinic acid and C – Chlorogenic acid.
Depending on the nature, number and position of cinnamic acid and on the cyclohexane ring of quinic acid substituints, chlorogenic acids may be divided into (42):
Caffeoylquinic acids: the most often reported are the isomers, 3-CQA, 4-CQA and 5-CQA, with 5-CQA being the most abundant compound found in coffee beans, responsible for about 56-62 % of total chlorogenic acids;
Dicaffeoylquinic acids (diCQA): existing isomers include, 3,4-diCQA, 3.5-diCQA and 4.5-diCQA. DiCQA isomers account for about 15-20% of total chlorogenic acids in coffee beans;
Feruloylquinic acids (FQA): existing isomers include 5-FQA, 4-FQA and 3-FQA, which may count for about 5-13% of total chlorogenic acids;
p-coumaroylquinic acids (p-CoQA) and caffeoylferuloylquinic acids (CFQA): 3-p-CoQA, 4-p-CoQA and 5-p-CoQA are recently identified isomers and are present in smaller amounts (remaining percentage of the ones referred above).
Chlorogenic acid is found in many plants (51-53), but it is in coffee plant that they are present in greater amounts, ranging from 4% to 14% (dry matter basis) of phenolic content in coffee beans (42, 47), having already been identified 45 different CGA compounds , including minor classes (less than 1% of total chlorogenic acids content), such as diferuloylquinic acids (diFQA), di-p-coumaroylquinic acids (di-p-CoQA) and dimethoxycinnamoylquinic acids, that have been recently identified (54, 55).
Besides having an important role in quality (flavor, acidity) of coffee beverage (56) chlorogenic acids are the phenolic compounds in plants that have been most studied in applications to improve human health. Due to its high antioxidant potential, many health benefits have been attributed to chlorogenic acids, both in vivo and in vitro, being hepatoprotective, immunoprotective, hypoglycemic and antiviral activities (57).
1.4.5 Flavonoids
Flavonoids, even with less impact on coffee plant, due to their lower presence, also contribute to the antioxidant potential of coffee (44), thus some families will also be presented.
The flavonoids are characterized by having 15 carbons, consisting of two aromatic rings connected by three carbons (pyran ring) with a basic structure, C6-C3-C6 (Figure 1.5). Depending on the substituents, ususally hydroxyl groups, methyl or sugar and the level of oxidation in the C3 ring, there are several major subclasses: flavonols, flavones, flavan-3-ols (or flavanols), isoflavones, flavanones and anthocyanidins.
Flavonols
Flavonols are the subclass of flavonoids most present in foods, having the basic structure shown in figure 1.6 and the most representative compounds are quercetin and kaempferol. Flavonols are normally present in small amounts (15 to 30 mg/kg fresh weight), and are often associated with a sugar moiety such as glucose or rhamnose. Usually, they are accumulated in the outermost tissues (leaves) once their biosynthesis is stimulated by light. One of the richest sources is onions that can go up to 1,2 g / kg fresh weight (44).
Figure 1.6 General chemical structures of flavonols .
Impact of polyphenols on human health
Flavanols (flavan-3-ols)
Flavanols or flavan-3-ols, comprise monomeric (catechins) or polymeric (proanthocyanidins, which are also known as condensed tannins) molecules, making this subclass, one of the most complex of the flavonoids. Flavanol molecules, have two chiral centers and therefore are four possible isomers depending on the level of hydroxylation in the B-ring (middle ring). For example, both (+)-catechin, (-)-epicatechin and vice versa can exist, being some forms more or less present in certain plants.
Figure 1.7 Chemical structures of flavonols (left) and an example of a trimeric procyanidin (right).
For instance, in fresh coffee pulp an average of 21,6% of epicatechin and 2,2% of catechin content was found (59). Other families of flavonoids are not covered because they are not present in coffee or their amount is very low.
1.5 Impact of polyphenols on human health
Figure 1.8 Polyphenols bioactivities (62).
Fruits, vegetables, cereals, chocolate and beverages such as wine, tea and coffee are the main sources of polyphenols. Dietary intake of polyphenols is estimated to be about 1 g/day (44, 61) and these compounds are extensively metabolized by intestinal and hepatic enzymes, and also by the intestinal microflora.
Polyphenols found in the coffee plant present general properties, such as: 5-CQA:
Is the most abundant compound in the coffee plant, either in beans or in leaves (42, 63) and some of its properties besides protection against oxidative damage include, an increase in resistance of LDL from oxidation (60, 64), there is quantitative evidence of an inverse relation between coffee drinking and liver cancer (65, 66) and a role in inhibiting the formation of potent mutagenic and carcinogenic N-nitroso compounds in vivo (67).
Di-CQA (dicaffeoylquinic acids)
Impact of polyphenols on human health
that they can contribute to the inhibition of HIV replication (in vitro) (68, 69) and have shown a protective effect in in vitro assays involving the Alzheimer’s disease (70).
Figure 1.9 Example of a diCQA chemical structure, in this case is 4.5-dicaffeoylquinic acid (4.5-diCQA).
Mangiferin
Mangiferin (figure1.10) has been reported very rarely in the coffee plant, there is indeed only one reference (71) and (now) another one will be made with this work, showing that this is a major component in coffee leaves and a possible biomarker to distinguish C. arabica from C. canephora, thus an interesting compound to study further in the future.
This polyphenol has been reported to possess antidiabetic properties, thus it is suggested to be used in treating type-2 diabetes (72-74).
Figure 1.10 Chemical structure of mangiferin.
Epicatechin and procyanidins
consumed values of this polyphenol, it could be used for therapeutic interventions aimed to improve and maintain vascular health.
Procyanidins were found as the main vasoactive polyphenols in red wine (78), chocolate and cocoa (79) and is also reported due to its ability in inhibiting LDL oxidation in vitro, however the mechanisms by which these flavonoids enhance cardiovascular health are still to be established.
α-tocopherol
Vitamin E or one of its forms, α-tocopherol (figure 1.11) will be approached here, since it was one of the antioxidants (lipophilic one) that were used to study in microemulsions formulations in this work.
α-tocopherol is the form of vitamin E that is preferentially absorbed and accumulated in humans (80) and is widely used as an inexpensive antioxidant in cosmetics and food supplements.
Figure 1.11 α-tocopherol chemical structure.
Products containing α-tocopherol are commonly used in the belief that it (or generally vitamin E) is good for the skin, and many cosmetics include it, often labeled as tocopherol acetate, tocopheryl linoleate or tocopheryl nicotinate (81). Some studies have shown that applying vitamin E before UV exposure significantly reduces acute responses such as edema and eythema (82),as well as that the topical application is related to decrease of the incidence of ultraviolet UV-induced skin cancer (83, 84).
1.6 Microemulsions - history and definition
It is well established that two liquids like water and oil do not mix, but by addition of an appropriate amount of surfactant, they can be brought into a single phase (macroscopically homogeneous but microscopically heterogeneous). When these three components, water, oil and surfactant are mixed, the determinant factor lies in the surfactant molecule. In a very brief explanation, the surfactant molecule has a polar (head) and an apolar (tail) region, thus hydrophilic and hydrophobic, which make it possible to form structures where water and oil are together in the same solution separated by a surfactant film. Depending on the amount and type of surfactant (and the other components as well), this unique class of optically clear solutions that is currently known as, microemulsions, can be made which comprise the colloidal systems that have attracted much scientific and technological interest over the past decades (90).
This interest stems from their unique characteristic properties as, ultralow interfacial tension, large interfacial area, solubilization for both water and oil-soluble compounds, and that they are spontaneously forming and thermodynamically stable (91). These and other properties insures that microemulsion systems have been studied from a fundamental point of view and make them attractive and suitable for many industrial and technological applications, including, personal care product formulations (cosmetics), novel drug delivery systems, enhanced oil recovery, nanoparticles formation, chemical reaction media and environmental protection (90).
The microemulsion concept was introduced in 1943 by Hoar e Schulman, who generated a clear single phase solution by titrating a milky emulsion with hexanol (92) but it was Schulman and his coworkers who first proposed the word ―microemulsion‖ in 1959 (93).
A general definition of the term ―microemulsion‖, used nowadays, was given later by Danielsson and Lindman, who described it as a ―system, composed of water, oil and an amphiphilic component, being an optically isotropic and thermodynamically stable liquid solution‖ (94)
In the late 1970's and early 1980's, interest in microemulsions increased when it was recognized that these systems could improve oil recovery. Comparing to other surfactant solutions, microemulsions have a ultralow interfacial tension, lower than 10-3 mN/m (minimum
Microemulsions properties
pollution control, agrochemicals and textile dyeing, and a few will be in detail later in this chapter (90).
1.7 Microemulsions properties
Other colloidal systems such as emulsions can be used as well, when compared with, microemulsions. However, microemulsions have much more advantages and some are presented in table 1.2 (85, 96).
Table 1.2 Major differences between microemulsions and emulsions.
Microemulsions Low energy required for preparation Thermodinamically stable Isotropic/clear appearance (aesthetic property for consumer products) Dynamic microstructure (fluctuating surfaces) Small aggregates (less than 100 nm) important in drug delivery
Emulsions Large input of energy Unstable, eventually separate Cloudy/turbid
Static structure (until coalescence)
Large droplets (0.1 to 10
µm)
All these advantages stem from the fact that the surface tension in microemulsions has very low values. In order to have a better understanding and a more detailed explanation, we must look at it in a thermodynamic point of view.
Taking one step back, the scientific process of formulating the otherwise immiscible oil and water by adding an amphiphile is itself an art, however behind this art there is always a great amount of science. The immiscibility arises due to very high interfacial tension between oil and water. For a mixture to be thermodynamically stable, Gibbs free energy (ΔG), must be at a minimum value and the change in ΔG is dependent on the surface tension of the oil-water interface (91), according to equation 1.1:
, at constant pressure and temperature, equation 1.1
If the surface tension is higher between two solvents, Gibbs free energy increases as well and hence the mixing fails. Therefore to change the ΔG to very low values, surface tension requires to be reduced to very low values as well and there, begins the role of surfactant. A simplified thermodynamic model has been proposed (97) to explain the formation of a microemulsions system as shown in equation 1.2:
, equation 1.2
where ΔG is Gibbs free energy, γ is surface tension, ΔA surface area, T is temperature and ΔS is entropy change (related to dispersion entropy of the system).
In microemulsions formation, the changes in ΔA are very large due to the large number of very small droplets formed. In the beginning it was proposed that in order for a microemulsion to be formed a (temporary) negative value of γ was required (98), but it is now recognized that while value of γ is always positive (99), it is very low (of the order of fractions of mN/m), due to the migration of surfactant molecules to the interface of the two immiscible phases. Besides that, the ΔS, entropy change of the system, offsets the other component, because when mixing one phase in the other in the form of a large number of small droplets, there is a positive change in entropy (TΔS>>γΔA) thus, Gibbs free energy becomes negative and so the microemulsification process is spontaneous resulting in a thermodynamically stable dispersion.
1.8 Components and properties
To be able to understand how microemulsions are formed and what can possibly influence them, one must perfectly know their components and its properties. In other words, we must know the properties of the surfactant, of the oil molecules and also of the water that is not always just water.
Components and properties
part is a surfactant. Additives to microemulsions can be co-surfactants, salt and polymers, but here we will not go into detail on that.
1.8.1 Surfactant
The term surfactant comes from Surface Active Agent, and surfactants lower the surface tension of a liquid or the interfacial tension between two liquids. Conventional surfactant molecules comprise of polar head group (hydrophilic region) and an apolar tail region (hydrophobic region).
There are mainly four types of surfactants: anionic, cationic, zwitterionic and non-ionic. The first three (anionic, cationic and zwitterionic) are charged (in the head group region), and the charged counterpart is called a counter ion, and the last one, non-ionic, does not have charge.
Anionic surfactants (figure 1.11) are negatively charged in the head group, usually with, sulfates, sulfonates, phosphates and carboxylates. Examples of anionic surfactants are:
Sodium dodecyl sulfate (SDS);
Sodium lauryl ether sulfate (SLES);
Carboxylates (Sodium stearate);
Sodium bis-2-ethylhexylsulphosuccinate (AOT).
Figure 1.11. Chemical structures of anionic surfactants, SDS (A) and AOT (B). A
Cationic surfactants (figure 1.12) are positively charged in the head group, and in this case the more used counter-ions are, bromides and chlorides. Examples are:
Cetyl trimethylammonium bromide (CTAB) and cetyl trimethylammonium chloride (CTAC);
Decyltrimethylammonium bromide (DETAB).
Figure 1.12. Chemical structure of a cationic surfactant, CTAB.
Zwitterionic surfactants (figure 1.13) have both positive and negative charges in the polar region but are neutral overall. Some examples of this type of surfactant are:
3-[(3-Cholamidopropyl)dimethylammonio]-1-propanesulfonate (CHAPS);
Lecithin (mixture of several fatty substances, from a variety of sources like soybean and egg yolk, with its major constituent is diacylphosphatidylcholine);
Phospholipids are also an example of zwitterionic surfactants and exhibit excellent biocompatibility.
Figure 1.13. Chemical structure of a zwitterionic surfactant, CHAPS.
Non-ionic surfactants (figure 1.14) do not have charge in the polar group, but a polar headgroup like an ethylene oxide (E-O) chain or a sugar group. They are not as influenced by addition of salts as the other groups and the ones with E-O groups are temperature sensitive.
Components and properties
Polyoxyethylene alkyl ethers (CmEn, where m is hydrocarbon chain length and n
is the number of oxyethylene units), like C12E5 (pentaethylene glycol monododecyl
ether), Brij 35 (C12E23) and Triton X-100;
Sucrose esters, such as sorbitan monooleate (Span 80);
Glucosyde alkyl ethers, as lauryl glucoside;
Cocamide MEA - cocamide monoethanolamine (derived from coconut oil).
Some are registered trademark, as Transcutol® (diethylene glycol monoethyl ether) and Plurol Isostearique® (isostearic acid ester of polyglycerols mixture).
Figure 1.14 Chemical structures of a non-ionic surfactant, C12E5 (A) and cocamide MEA (B).
Polyoxyethylene alkyl ethers (CmEn) have some distinguishing properties that make
them good to use as model systems (100). They are particularly attractive because it is possible to create a microemulsion by just varying temperature and diluting with water, without the use of a co-surfactant or co-solvents (101). These systems have also been extensively studied, and there are detailed information available so they are ideal as a model system, in particular microemulsions formed with C12E5 (85, 101-104).
In most formulations the presence of a co-surfactant or co-solvents such as a short-chain alcohol, is required to further decrease the interfacial tension, to be able to have many different structures. Some of these additives are irritating and many co-surfactants are not pharmaceutically acceptable. Most of non-ionic surfactants are generally are considered safe for human applications, and are generally regarded as less irritant than ionic surfactants.
The critical micelle concentration (CMC) is very low, therefore low amounts of this type of surfactants are needed to form aggregates.
The temperature sensitivity comes from the ethylene oxide group (hydrophilic part) as it becomes less soluble in water with increasing temperature (105) (most compounds have the opposite pattern). This way by changing the temperature it is possible to ―regulate‖ the transition from one phase to another, thus making the studies much easier. In ionic surfactants case, this could be done with the addition of a co-surfactant or co-solvent or possibly salt, which requires several samples.
1.8.2 Oil
Compounds that can be used as an oil for formulating microemulsions, generally can go from, fatty acids, esters of fatty acids and alcohols, medium chain triglycerides to hydrocarbons. The most common used, range from, corn oil (mostly triglyceride), capric acid (decanoic acid), ethyl oleate (ester of oleic acid and ethanol), isopropyl myristate, an ester of isopropanol and myristic acid (figure 1.15) and aromatic hydrocarbons (benzene, toluene) or aliphatic hydrocarbons, such as alkanes like, decane and hexadecane (figure 1.15). There are also some cases of using terpentenes like, limonene and menthol to exploit their penetration enhancement abilities (89) and take advantage of its odor.
The choice of oil depends on the purpose with which the microemulsion is made. For instance, if the aim is large-scale use (example in enhanced oil recovery), one wants an economic oil (preferably with vegetable origin, even if it is not a pure solution but a of mixture similar oils). If one wants to study a system for pharmaceutical application, as drug delivery for example, the oil must be biocompatible, i.e, one already approved by regulatory bodies for pharmaceutical use (not toluene for instance). In general one should look to price, biocompatibility, solubility, viscosity, depending on the purpose for which microemulsion is used. On the other hand, most of the fundamental work and research focuses on using hydrocarbons, such as decane, hexane, dodecane, cyclohexane, as the oil component, because they have similar structures (101, 104) (although can differ in some properties). Changing from a decane to a dodedecane, is useful to study the effect of different oil in the system, if we know exactly that this is the only thing changing, thus have more control and can predict the behaviour of the microemulsion. However, these last oils are not suitable pharmaceutical ingredients. Different oils have different properties such as, density, vapor pressure, solubility in water, among others. Even though the last one (solubility in water), may be very low for oils in general, the differences between being, extremely low soluble or just low soluble, can influence the kinetics, so reactions may occur more or less rapidly and thus influencing the choice.
Figure 1.15 Chemical structure of two different oils, isopropyl myristate (A) and decane (B). B
Microemulsions structures
1.9 Microemulsions structures
When dispersed in water or in non-aqueous solvents (such as alkanes), surfactants self-assemble into a variety of equilibrium phases, which depend from the interplay of various molecular forces and also of entropy considerations in order to minimize the free energy of the overall system (97). In other words, surfactant molecules locate at the oil/water interface and orientate the hydrophilic region towards the water and the hydrophobic region for oil. When there are enough surfactant molecules (when it reaches the CMC) they will start to aggregate into what is called micelles.
A number of phases can result of the assembling of surfactant molecules, which are structured on the microscopic and sometimes noticed on a macroscopic scale. They are related with the curvature of the structures, and with the one that is thermodynamically more stable.
1.9.1 Spheres (micelles) growth
Microemulsions with non-ionic surfactants of E-O type are temperature dependent, meaning that the structures change with increase or decrease of temperature. When the system is in the microemulsion phase temperatures, it is considered to be mainly composed of spherical micelles at least at the lower temperatures (101, 104). In non-ionic surfactants of EO-type, like C12E5, the higher the temperature the less solubility in water do ethylene oxide groups
Figure 1.16 Low (A) and high (B) curvature of the surfactant interface, corresponding to bigger and smaller droplets. Showing that it is a balance between how "tight" surfactant molecules are (more or less curvature) as well as the penetration of water and oil in the hydrophilic and hydrophobic chains of the
surfactant, respectively. This will determine the curvature and size of the micelles (106).
1.9.2 Different structures formed
Besides spheres there are many more structures (figure 1.17) in which microemulsions can self-assembly being all idealized as a set of interfaces dividing polar and apolar domains.
Figure 1.17 A few structures in which microemulsions may self-assembly. A – bicontinuous structure
(L3); B – Lamellar structure (Lα) and C – Hexagonal structure (97).
Depending on the amount of the three compounds, two types of microstructures can be most commonly found, as we can see in figure 1.18.
Figure 1.18 Schematic representation of two microemulsions: A - Oil-in-water (O/W) and B - water-in-oil
(W/O) microemulsions (97).
B A
Phase diagrams
Oil-in-water (O/W) microemulsions are formed, when the volume fraction of oil is low. On the contrary, we have water-in-oil (W/O) microemulsions or reverse micelles, when the volume fraction of oil is high compared to the water and surfactant fractions.
1.10 Phase diagrams
In order to characterize microemulsions there are several methods and techniques, as Dynamic Light Scattering (DLS), Nuclear Magnetic Ressonanse (NMR), Small Angle X-ray Scattering (SAXS) and Small Angle Neutron Scattering (SANS), mainly used to study unknown systems (103). The need to use one or another depends on the characterization that we want to do and the availability of the equipment as some are lab-scale while others are large scale facilities with the need to apply in order to get access. If it were to determine more precisely a type of structure or to evaluate the influence of the addition of a certain incorporated compound, it would require different techniques.
of temperature where changes occur, this process may become very time consuming, that is why it is also usual to make cuts and fix ratios of the components.
The phase diagram can be represented by a ternary diagram (figure 1.19) (three-component system with fixed temperature and pressure) or by a triangular prism if the temperature is considered as a variable (figure 1.21). Another useful way of representing the phase diagram of a microemulsion system is to keep the concentration or ratio between one or two components constant and then just have different concentrations versus temperature (figure 1.20).
Figure 1.19 A hypothetical ternary phase diagram of an oil, surfactant and water system. There are shown several structures in which microemulsions can self-assembly: micelles, reverse micelles, and lamellar
structure. At very high surfactant concentrations two phase systems are observed (97).
Phase diagrams
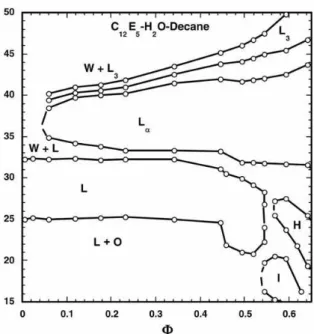
Figure 1.20. A - Phase diagram of the microemulsion system with C12E5/decane/water with a fixed
surfactant to oil ratio (volume fraction, Φ), showing dependence on temperature (Y-axis) and several
structures: L+ O (oil); Sample below lower phase boundary (oil on top, surfactant and water in the bottom) where there is a macroscopic phase separation; L phase; Sample in the microemulsion temperature range where the structure corresponds mainly to spheres (nanomicelles), where oil, surfactant
and water are in only one macroscopically homogeneous phase; Lα, Lamellar phase, where is seen
birefrangence glowing on the right image using polarized light; L3 phase corresponds to bicontinuous; H
phase corresponds to hexagonal and I to cubic phase (101).
A different phase diagram is represented in Figure 1.21, by a triangular prism, which evidence the fixed ratio between surfactant and oil, and changes in the amount of water, in the system.
1.11 Industrial Applications
Since the discoveries of Hoar and Schulman (92), microemulsions have evolved in so many fields that now can range from chemistry to biology and also to oil industry, in which then branched out in numerous applications. Examples include:
Pharmaceutical industry (drug delivery) (107); Cosmetics industry (96);
Foods industry (nutraceutical carriers) (108, 109); Agrochemicals (pesticides) (110);
Dyeing processes (111, 112);
Microemulsions in enhanced oil recovery, among others (113-115).
Regarding the first topic, in drug delivery systems, during drugs administration a major problem that exists with lipophilic drugs is related to the compromised absorption due to its low aqueous solubility. Some part is absorbed and reaches the pharmacological site of interest where it is effective. However the remaining part that is not absorbed can cause toxicity and side effects. Moreover, another drawback with some methods currently used for drug administration, is the time it takes, after the application, until the full effect being noted. Enhancement of the efficacy and toxicity reduction can be achieved by encapsulation of the drug in mainly aqueous drug delivery systems, such as microemulsions. An example of a long-term used drug (116) in topical applications is lidocaine (figure 1.22). Briefly, this drug is a local anesthetic and antiarrhythmic that has a rapid onset and intermediate duration of action of efficacy (96).
There are several studies on the use of lidocaine in microemulsions, where it is proved that this system promotes increased cutaneous penetration (87, 117), the capacity of lidocaine solubility in microemulsion was analyzed, using microemulsion as vehicle increases dermal drug delivery of lipophilic drugs in humans (lidocaine) (118) as well as fundamental studies about incorporation of lidocaine in microemulsions systems (119, 120).
Industrial Applications
On the second topic, the cosmetic industry, more and more studies using microemulsions have been appearing due to their advantages over existing conventional formulations. Increasing knowledge of the unique properties of microemulsions (referred previously), such as very small dimensions (nanoscale) of the particles and high thermodynamic stability, contributes to the progress of this technology (121). It is also known that it helps in visual appearance and in commercial fields that microemulsions are transparent. This is part of the reasons why they are now being widely investigated for preparing personal care products with superior features such as having improved product efficiency, stability, appearance and minimal irritation (122).
Antioxidants have been largely used in dermatological and cosmetic products owing to its property of scavenging free radicals and oxidative agents that form due to many unfavorable conditions to which we are exposed every day. One of the most widely used antioxidants is vitamin E (α-tocopherol). It has been used in O/W microemulsions due to enhanced capability of this system to delivering the antioxidant predominantly in the epidermis or penetrate further, preventing the accumulation in other organs than the skin.
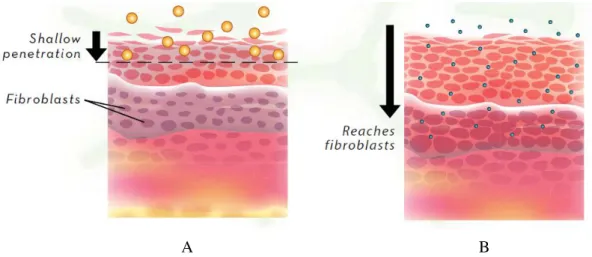
There are already some products on the market, as the case of trademark Agera® Rx, which uses microemulsions formulation, where it includes among other components, vitamin E. Comparing this formulation with conventional ones, it is claimed that the treatment with microemulsions provides significant protection deep within the skin (123), where fibroblasts produce new collagen and elastin thus playing a critical role in wound healing and skin health (figure 1.23).
Figure 1.23. Comparison between the effectiveness of large conventional skin care systems (A) and
microemulsions formulations (B) (124)
Besides vitamin E, other antioxidant compounds have been studied in microemulsions systems, as the case of reveratrol (125), lycopene (88) and quercetin (126) where it was demonstrated that w/o microemulsions increased the skin penetration of quercetin both in vitro and in vivo, and did not cause skin irritation (127).
Regarding the most abundant antioxidant in coffee plant, chlorogenic acid, there are some recent studies with the combination of this polyphenol and microemulsions (128). The finding was quite different from previous findings on relatively to hydrophobic polyphenols, once here there was a pretreatment of the skin with chlorogenic acid containing microemulsion and it prevented erythema formation induced by UV irradiation.
2. Materials and methods
Coffee plant materials and growth conditions
The experiments were carried using 1.5-year-old plants from three different genotypes: Icatu (IAC 2944 - C. canephora x C. arabica), Apoatã (C. canephora cv. Apoatã) and Obatã (IAC 1669-20 - Villa Sarchi x Timor Hybrid). Potted plants were transferred into walk-in growth chambers (10.000 EHHF, ARALAB, Portugal), and maintained with a 12 hours photoperiod, a relative humidity of 65-70% and an irradiance of 750-850 mmol m-2.s-1. After the
acclimatization period, plants were successively submitted to: a gradual temperature decrease (0.5 ºC/day), from 25/20 ºC to 13/8 ºC (day/night), over 24 days, to allow the expression of acclimation ability; a three day chilling cycle at 13/4 ºC (3x13/4 ºC), where the plants were subjected to 4 ºC during the night and in the first 4 hours of the morning (thus, with light), followed by a gradual rise up to 13 ºC, applied throughout the rest of the diurnal period. After that, plants were allowed to recover from cold for seven days at 25/20 ºC, and then more seven days to recover from drought. In addition to being divided by temperature treatment, plants were also divided into three sets of conditions with different water content (drought treatment): control (no lack of water), mild drought (about 50% water content) and severe drought (about 25% water content). Measurements were made from the two top pairs of recent mature leaves from each branch of 8-10 plants per genotype. Material was frozen in liquid N2 and stored at -80
ºC until use, and for further analysis, leaves tissue extractions were performed using an ice-cold mortar and pestle.
Phenolic extraction and chromatographic conditions