ARTIGO ORIGINAL
RESUMO
Introdução: A esperança de vida está a aumentar em Portugal, contudo desconhece-se o estado de saúde dos idosos. Pretende-se determinar a prevalência de multimorbilidade, caracterizar estilos de vida e outros fatores relacionados com a saúde dos idosos. Material e Métodos: Efetuou-se uma avaliação transversal a 2393 adultos com 65 ou mais anos de idade, da coorte EpiDoC que é constituída por uma amostra representativa da população portuguesa. Os inquiridos responderam a um questionário estruturado através de uma entrevista telefónica, tendo-se recolhido dados socioeconómicos demográficos, estilo de vida, doenças crónicas e consumo de recursos em saúde. Análise de clusters foi realizada para a identificação de padrões alimentares. Efetuou-se análise descritiva e analítica para estimar a prevalência de multimorbilidade e fatores associados.
Resultados: A prevalência de multimorbilidade nos idosos foi de 78,3% (72,8% entre os 65 - 69 anos, 83,4% com 80 + anos) e foi superior nos Açores (84,9%) e no Alentejo (83,6%). As doenças crónicas mais prevalentes foram a hipertensão arterial (57,3%), doenças reumáticas (51,9%), hipercolesterolemia (49,4%) e diabetes (22,7%). Os sintomas de depressão (11,8%) foram frequentes, aumentando ao longo dos grupos etários. A qualidade de vida (EQ-5D-3L) foi em média de 0,59 ± 0,38 e 25,8% dos idosos reportaram ter sido hospitalizados nos 12 meses prévios à entrevista. Cerca de 66,6% dos idosos são fisicamente inativos. O padrão alimentar caracterizado por ‘+ fruta e + hortícolas’ foi reportado por 85,4% dos idosos, contudo foram encontradas iniquidades regionais (69% para os idosos açorianos). A prevalência de obesidade foi de 22,3%, sendo superior nos açorianos (33%).
Conclusões: A elevada prevalência de multimorbilidade combinada com estilos de vida pouco saudáveis sugere que a população idosa constitui um grupo vulnerável que requer uma intervenção direcionada.
Palavras-chave: Assistência à Saúde; Avaliação de Resultados (Cuidados de Saúde); Comorbilidade; Envelhecimento; Portugal; Qualidade de Vida
Challenges of Ageing in Portugal: Data from the EpiDoC
Cohort
Os Desafios do Envelhecimento em Portugal: Dados da
Coorte EpiDoC
1. EpiDoC Unit. Centro de Estudos de Doenças Crónicas. NOVA Medical School. Universidade Nova de Lisboa. Lisboa. Portugal. 2. Sociedade Portuguesa de Reumatologia. Lisboa. Portugal.
3. Rheumatology Research Unit. Instituto de Medicina Molecular. Lisboa. Portugal. 4. EpiSaúde – Associação Científica. Évora. Portugal.
5. Faculdade de Ciências da Nutrição e Alimentação. Universidade do Porto. Porto. Portugal.
6. Programa Nacional para a Promoção da Alimentação Saudável. Direção-Geral da Saúde. Lisboa. Portugal. 7. Unidade de Investigação em Saúde. Escola Superior de Saúde. Instituto Politécnico de Leiria. Leiria. Portugal. 8. Hospital Garcia de Orta. Almada. Portugal.
9. NOVA Information Management School. Universidade Nova de Lisboa. Lisboa. Portugal.
10. Serviço de Reumatologia. Centro Hospitalar Lisboa Ocidental. Hospital Egas Moniz. Lisboa. Portugal. 11. Escola Nacional de Saúde Pública. Universidade Nova de Lisboa. Lisboa. Portugal.
Autor correspondente: Helena Canhão. [email protected]
Recebido: 18 de outubro de 2017 - Aceite: 08 de janeiro de 2018 | Copyright © Ordem dos Médicos 2018
Ana Maria RODRIGUES1,2,3,4, Maria João GREGÓRIO1,4,5,6, Rute Dinis SOUSA1,4, Sara S DIAS1,4,7,
Maria José SANTOS2,3,8, Jorge M MENDES9, Pedro Simões COELHO9, Jaime C BRANCO1,2,4,10, Helena CANHÃO1,2,4,11
Acta Med Port 2018 Feb;31(2):80-93 ▪ https://doi.org/10.20344/amp.9817
ABSTRACT
Introduction: Portuguese adults have a long lifespan, but it is unclear whether they live a healthy life in their final years. We aimed to determine the prevalence of multimorbidity and characterize lifestyle and other health outcomes among older Portuguese adults. Material and Methods: We performed a cross-sectional evaluation of 2393 adults, aged 65 and older, during the second wave of follow-up of the EpiDoC cohort, a population-based study involving long-term follow-up of a representative sample of the Portuguese population. Subjects completed a structured questionnaire during a telephone interview. Socioeconomic, demographic, lifestyle behaviours, chronic diseases, and health resources consumption were assessed. Cluster analysis was done to identify dietary patterns. Descriptive and analytic analysis was performed to estimate multimorbidity prevalence and its associated factors.
Results: Multimorbidity prevalence among older adults was 78.3%, increased with age strata (72.8% for 65 – 69 years to 83.4% for ≥ 80 years), and was highest in Azores (84.9%) and Alentejo (83.6%). The most common chronic diseases were hypertension (57.3%), rheumatic disease (51.9%), hypercholesterolemia (49.4%), and diabetes (22.7%). Depression symptoms were frequent (11.8%) and highest in the oldest strata. The mean health-related quality of life (EQ-5D-3L) score was 0.59 ± 0.38. Hospitalization in the previous 12 months was reported by 25.8% of individuals. Overall, 66.6% of older adults were physically inactive. ‘Fruit and vegetables dietary pattern’ was followed by 85.4% of individuals; however, regional inequalities were found (69% in Azores). Obesity prevalence was 22.3% overall and was highest among Azoreans (33%).
Conclusion: The high prevalence of multimorbidity, combined with unhealthy lifestyle behaviours, suggests that the elderly population constitutes a vulnerable group warranting dedicated intervention.
ARTIGO ORIGINAL INTRODUCTION
In Portugal, as in other countries, the population is ageing. Accordingly, the ageing index (number of people > 60 years old per 100 children < 15 years old) is increasing.1
By 2025, it is estimated that more than 20% of Europeans will be more than 65 years old.2 Better living conditions and
advances in science and medicine have extended the life span across Europe, yet large differences exist between nations regarding quality of life in the last 5 to 10 years of life.3 In several countries, these later years are accompanied
by compromised quality of life, adverse drug events, and disability arising from chronic diseases, such as heart or mental disorders, cancer, stroke, diabetes, and rheumatic disease.4 Several of these chronic diseases occur in
clusters and are associated with health-related behaviours, such as physical inactivity and unhealthy diets.5,6 This leads
to the multimorbidity concept, which has been defined as the coexistence of two or more chronic diseases at the same time.7-9 Individual, societal, and economic costs
associated with the last 5 to 10 years of life are mainly due to multimorbidity.5,10
Assessment and intervention in older adults with multimorbidity require an interdisciplinary approach. An understanding of risk factors, clinical situation, healthcare consumption, and social and economic status will help with the design of new strategies and policies to achieve better care.
Epidemiological population-based health data in Portugal are scarce. Some population-based cohorts designed to study health problems consist of a small number of older subjects. The Estudo do Perfil de Envelhecimento
da População Portuguesa (EPEPP) study, a cross-sectional
study performed in 2005 and 2006, enrolled 2672 adults aged over 55 years old and mainly evaluated third-party dependency, functional ability, and laboratory results.11,12
Portugal is one of the 28 participant countries in the Survey of Health, Ageing, and Retirement in Europe (SHARE), a multidisciplinary, cross-national panel database of approximately 123 000 adults aged 50 or older containing microdata regarding health, socioeconomic status, and social and family networks.13 Despite these initiatives,
comprehensive and multidimensional data of older groups representative of the Portuguese population are lacking. In 2011, we established a longitudinal cohort enrolling 10 661 non-institutionalized individuals representative of the adult Portuguese population living in mainland Portugal, as well as the Azores and Madeira islands.14 EpiDoC cohort
subjects have now been followed for more than six years. Three waves of data collection were performed. Data presented in this study are a cross-sectional analysis of the second wave of data collected between 2013 and 2015 (EpiDoC 2 study).
The aim of this work was to identify the current challenges of ageing in Portugal by determining the prevalence of multimorbidity among adults 65 years and older and characterizing their socioeconomic characteristics, lifestyles, chronic diseases, quality of life, and healthcare
resources consumption. Through this process, the ultimate goal was to identify key issues to facilitate the development of optimal health intervention programs and public policies targeted to older adults.
MATERIAL AND METHODS
This study is a cross-sectional evaluation of the second wave of follow-up of the EpiDoC Cohort (i.e., the EpiDoC 2 study). EpiDoC 2 participants who were 65 years and older were included in the current descriptive/analytic analysis.
Population and data collection: EpiDoC cohort
EpiDoC study is a national population-based cohort designed to provide data regarding noncommunicable chronic diseases for use in socioeconomic and biomedical research. The EpiDoC cohort enrolled 10 661 adults residing in Portugal (the mainland, Azores and Madeira). EpiDoC sample size calculation was performed in order to capture health related conditions whose prevalence were of 0.5% as described elsewhere.14,15 The study included
non-institutionalized adults (≥ 18 years old) living in private residences in the Portuguese Mainland and Islands (Madeira and Azores). The study sample was stratified by administrative territorial units [(NUTS II) (Norte, Centro, Lisboa & Vale do Tejo, Alentejo, Algarve, Azores Islands (Azores) and Madeira Islands (Madeira)], and the size of the population within each locality (< 2000; 2000 - 9999; 10 000 – 19 999; 20 000 – 99 999; and ≥ 100 000 inhabitants, respectively).
EpiDoC 1, or EpiReumaPt, was the first cross-sectional evaluation, which was performed between September 2011 and December 2013. This study primarily assessed the prevalence of rheumatic and musculoskeletal diseases and their impact on health-related quality of life, physical function, and mental health in Portugal.14,15
In EpiDoC 1, face-to-face interviews were conducted at the residences of the 10 661 participants across the country, followed by a medical appointment one or two weeks later at the nearest primary health care centre. Detailed methodology was published elsewhere.14
The EpiDoC 2 study (2013 to 2015) expanded the scope of EpiDoC 1 by adding new questions and deleting others. A structured questionnaire was used during a telephone interview conducted by trained research assistants. In this report, we present data from EpiDoC 2.
EpiDoC 2 included 7591 adult participants, of whom 2393 were older adults (65 years and older) (Fig. 1). Data collection was performed from March 26,2013 to July 27, 2015 by a trained research assistant team who randomly called all individuals on the telephone. When the initial contact attempt was not successful, additional attempts were made at different times of the day and days of the week (morning, afternoon, evening, and weekends), to a total of six attempts. The last contact attempt was at least one month after the second last attempt. Only after the sixth attempt was further contact abandoned. Interviews
ARTIGO ORIGINAL
were performed with the assistance of a computed assisted telephone interview (CATI) system. Data were recorded on a standardized form, and database access was restricted by use of a unique username and password for each research team member.
EpiDoC cohort measurements
Sociodemographic and socioeconomic characteristics: Information regarding sociodemographic
factors (sex, age, ethnicity, years of education, marital status, household composition, Nomenclature of Territorial Units for Statistics [NUTS] II region), as well as socioeconomic variables (household income, employment status), was collected in the EpiDoC 1 study. During the EpiDoC 2 interview, subjects were asked whether any of these characteristics had changed.
Lifestyle characteristics: Self-reported height and
weight were collected. Based on these data, body mass index (BMI; weight/height2 in kg/m 2) was calculated and
categorized according to the World Health Organization (WHO) classification system.16 The EpiDoC 2 study
included several questions concerning lifestyle habits, such as frequency of alcohol intake, number of alcohol units per week, smoking habits, frequency and type of physical
activity, sleep habits, frequency of watching television, and frequency of using a computer, video games, or tablets. Physical activity level was classified according to self-reported weekly frequency of physical activity. Dietary intake was assessed through food frequency questions regarding the following foods and beverages: soup, vegetables, fresh fruit, milk, and other dairy products.
Health characteristics and healthcare consumption and costs: In the EpiDoC 1 study, individuals were
asked whether they had been previously diagnosed with the following chronic diseases: hypercholesterolemia, hypertension, rheumatic disease, allergy, gastrointestinal disease, mental disease, cardiac disease, diabetes, thyroid or parathyroid disease, pulmonary disease, hyperuricemia, cancer, or neurologic disease. This information was updated in the EpiDoC 2 study interview. Multimorbidity was defined as the coexistence of two or more of these self-reported chronic diseases.17 Health-related quality of life was
assessed using the European Quality of Life questionnaire with five dimensions and three levels (EQ-5D-3L),18,19
for which a higher score corresponds to a higher quality of life. Physical function was evaluated using the Health Assessment Questionnaire (HAQ; ranging from 0 to 3, with a higher score representing worse functional ability).20
Figure 1 – Flowchart describing the population eligible for this study EpiDoC 1 (2011 - 2013) EpiReumaPt participants n = 10 661 EpiDoC 2 (2013 - 2015) CoReumaPt Elegible to follow-up n = 10 153 EpiDoC 3 (2015 - 2016) Saúde.Come Elegible to follow-up n = 9023 EpiDoC 2 (2013 - 2015) CoReumaPt participants n = 7591
Cross sectional analysis
18 - 64 years old (n = 5198) ≥ 65 years old(n = 2393) EpiDoC 3 (2015 - 2016) Saúde.Come participants n = 5653 EpiDoC 1 (2011 - 2013) Clinical Appointments participants n = 3886 Subjects from EpiReumaPt who refused
to sign consent for follow-up
ARTIGO ORIGINAL The Hospital Anxiety and Depression Scale (HADS)21 was
used to identify symptoms of anxiety and depression. We used Portuguese validated versions of the assessment scales. Hospitalizations, medical appointments, therapies, and homecare support were also assessed.
Statistical analysis
Sample weights: To verify the representativeness
of the sample according to the Portuguese population (mainland and islands), we first compared the participants and non-participants of the EpiDoC 2 study with respect to their sociodemographic, socioeconomic, and health status characteristics. Based on this comparison, we adjusted the weights according to stratification by NUT II region, sex, and age group. Extrapolation weights were computed and used in the subsequent statistical analyses. These were obtained by calibrating the extrapolation weights originally designed for the EpiDoC 1 study sample.
Absolute frequencies and weighted proportions were used to summarize categorical variables. Continuous variables were described by weighted mean values and standard deviations. To identify dietary patterns, we performed cluster analysis based on the responses to food frequency questions, as described elsewhere.22
All analyses were weighted and performed using STATA IC version 12 (StataCorp. 2011. Stata Statistical Software: Release 12. College Station, TX: StataCorp LP).
Ethical issues and personal protection: Details of
ethical issues of the EpiDoC 1 (EpiReumaPt) study were described elsewhere.14,15,23 EpiDoC 1 was performed
according to the principles established by the Declaration of Helsinki and revised in 2013 in Fortaleza.24 The study was
reviewed and approved by the National Committee for Data Protection (Comissão Nacional de Proteção de Dados) and by the NOVA Medical School Ethics Committee. The subjects provided informed consent to participate in all phases of the study.
EpiDoC 2 was also approved by the National Committee for Data Protection (in accordance with the Portuguese law number 67/98, October 26th, regarding protection
of personal data) and by the same Ethics Committee as EpiDoC 1. The study was conducted in accordance with the applicable laws and regulations including, but not limited to, the Guidelines for Good Clinical Practice and the ethical principles stated in the Declaration of Helsinki.24 Participants’
confidentiality was safeguarded by the lack of identifiers in the database (only a unique identification code was used for each participant). The name and contact information for each subject were stored separately from the study data transmitted to the coordinating centre (based at the headquarters of the Portuguese Society of Rheumatology). All data were kept anonymously and securely by authorized EpiDoC staff. Written informed consent was signed during EpiDoC 1 by individuals agreeing to be followed and participate in the EpiDoC 2 study.
RESULTS
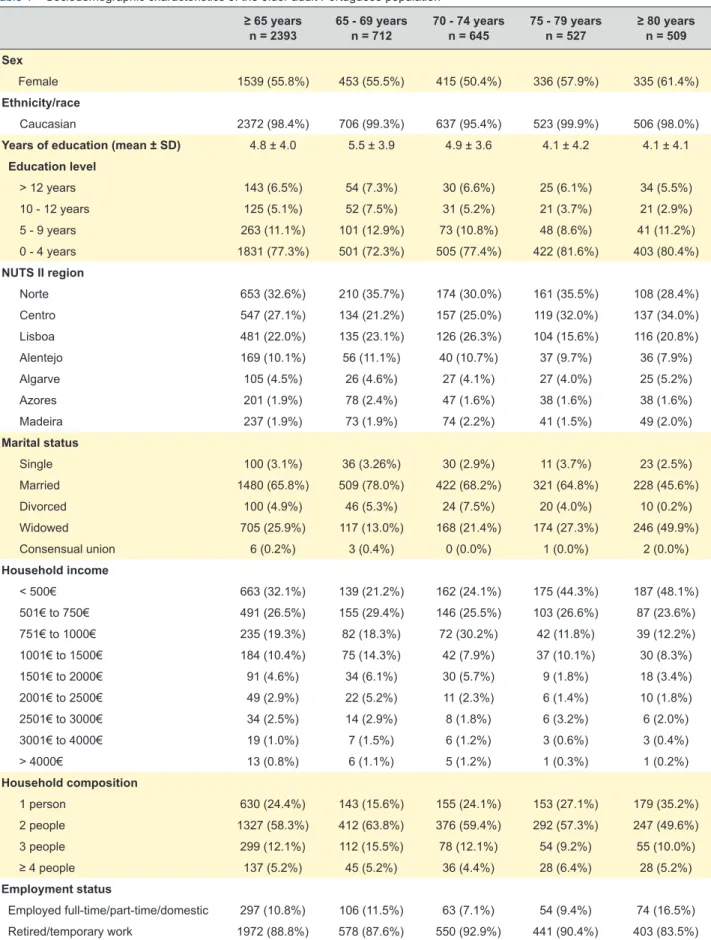
Sociodemographic characteristics of Portuguese seniors
Of the 7591 total participants in EpiDoC 2, we analysed 2393 older adults (≥ 65 years). They were representative of the Portuguese population (mainland and islands). Table 1 summarizes sociodemographic characteristics of participants according to different age groups. Of the 2393 older adults, 1539 (55.8%) were female, 2372 (98.4%) were Caucasian, 705 (25.9%) were widowed, and 1850 (77.3%) had four or fewer years of education. Lower levels of education were found among the oldest seniors: 81.6% and 80.4% of participants aged 75 to 79 years and 80 years or greater, respectively, had four or fewer years of education. Most older adults (77.9%) had a household income less than 1000 euros per month; in particular, 32.1% had an income less than 500 euros per month. Similar to education, incomes were worse among the oldest seniors, as 48.1% of individuals 80 years or older reported a household income less than 500 euros per month. A significant proportion of older adults lived in households with only one person (24.4%); the percentage was highest (35.2%) among the oldest age group. Most older adults were retired (88.6%), but 8.0% were working as domestic workers (Table 1).
Anthropometric data
The mean BMI of all older adults was 27.3 ± 5.2 kg/m2.
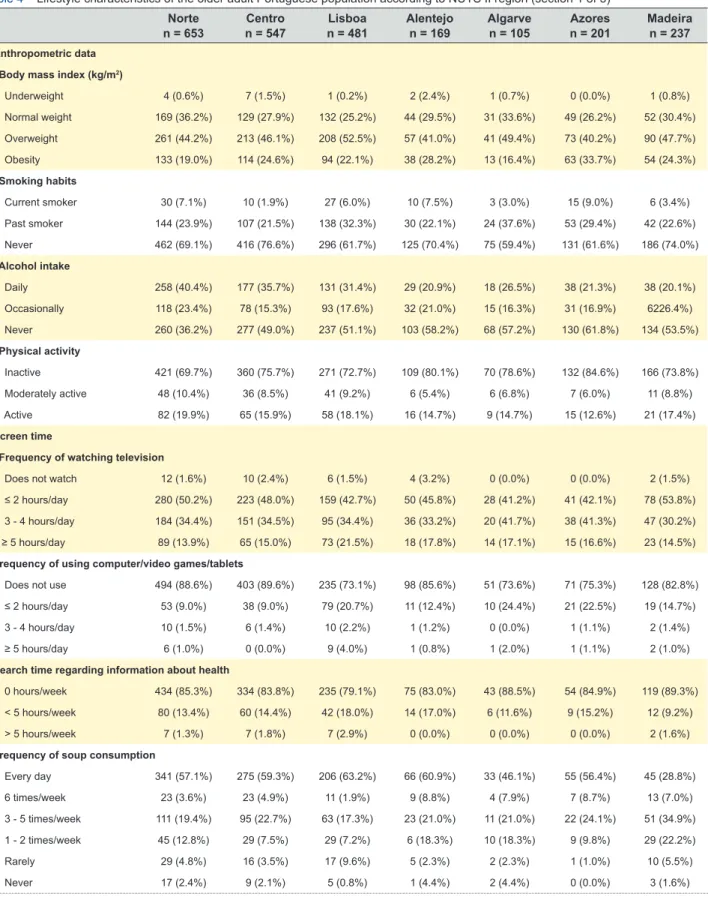
The prevalence of overweight or obesity was 68.8% (46.5% for overweight and 22.3% for obesity). The prevalence of overweight or obesity was less among the oldest seniors: 39.1% for overweight and 15.6% for obesity among seniors 80 years or older (Table 2). The Centro (74.6%), Azores (73.9%), and Madeira (72%) regions had the highest prevalence of overweight individuals. Obesity was most common among individuals in Azores (33%) (Table 4).
Lifestyle characteristics
Regarding lifestyle habits other than diet, 33.8% of individuals reported daily intake of alcohol beverages and 5.2% were current smokers. A total of 46.9% did not consume alcohol and almost 70% never smoked. Overall, 66.6% of individuals were inactive and 50.9% spent at least three hours per day watching television. A high proportion of subjects never used a computer, video games, or tablets (84.5%). Moreover, the proportion of individuals who were physically inactive increased as age increased (Table 2). The highest proportion of physical inactivity was found in Azores (84.6%) and Alentejo (80.1%).
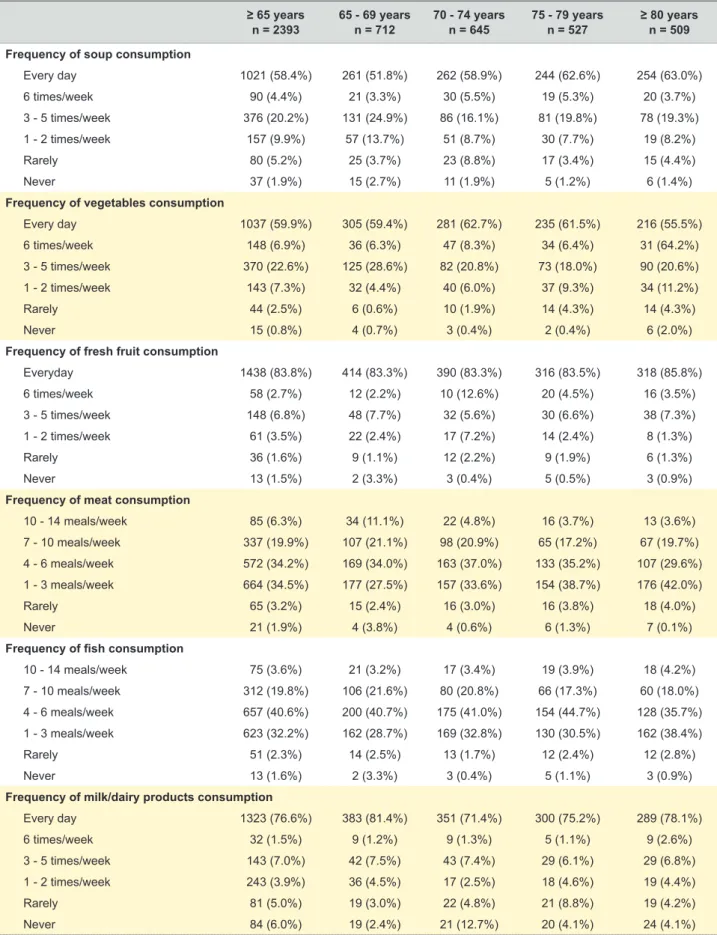
Dietary habits
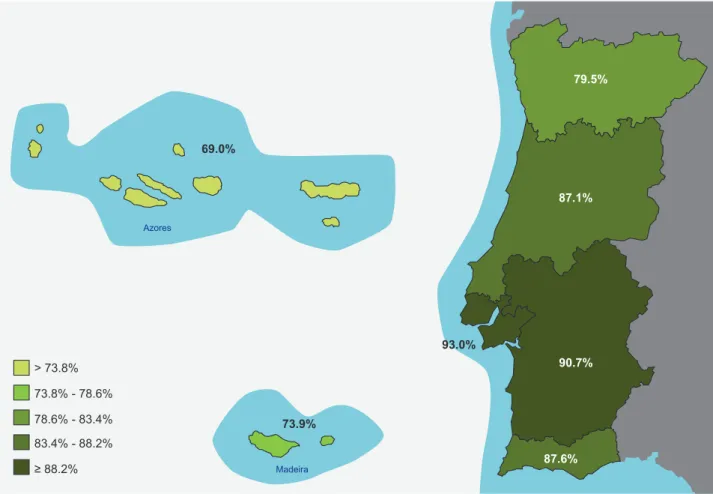
The percentage of individuals adopting a ‘healthy dietary pattern’ characterized by higher consumption of fruits and vegetables, was 85.4% of all older adults; this percentage remained stable across age strata (Table 2). However, lower adherence to this healthy dietary pattern (‘fruit and vegetables dietary pattern’) was found in Azores (69.0%) and Madeira (73.9%) (Fig. 2). Indeed, Azores, Madeira,
ARTIGO ORIGINAL
Table 1 – Sociodemographic characteristics of the older adult Portuguese population ≥ 65 years
n = 2393 65 - 69 yearsn = 712 70 - 74 yearsn = 645 75 - 79 yearsn = 527 ≥ 80 yearsn = 509 Sex
Female 1539 (55.8%) 453 (55.5%) 415 (50.4%) 336 (57.9%) 335 (61.4%)
Ethnicity/race
Caucasian 2372 (98.4%) 706 (99.3%) 637 (95.4%) 523 (99.9%) 506 (98.0%)
Years of education (mean ± SD) 4.8 ± 4.0 5.5 ± 3.9 4.9 ± 3.6 4.1 ± 4.2 4.1 ± 4.1
Education level > 12 years 143 (6.5%) 54 (7.3%) 30 (6.6%) 25 (6.1%) 34 (5.5%) 10 - 12 years 125 (5.1%) 52 (7.5%) 31 (5.2%) 21 (3.7%) 21 (2.9%) 5 - 9 years 263 (11.1%) 101 (12.9%) 73 (10.8%) 48 (8.6%) 41 (11.2%) 0 - 4 years 1831 (77.3%) 501 (72.3%) 505 (77.4%) 422 (81.6%) 403 (80.4%) NUTS II region Norte 653 (32.6%) 210 (35.7%) 174 (30.0%) 161 (35.5%) 108 (28.4%) Centro 547 (27.1%) 134 (21.2%) 157 (25.0%) 119 (32.0%) 137 (34.0%) Lisboa 481 (22.0%) 135 (23.1%) 126 (26.3%) 104 (15.6%) 116 (20.8%) Alentejo 169 (10.1%) 56 (11.1%) 40 (10.7%) 37 (9.7%) 36 (7.9%) Algarve 105 (4.5%) 26 (4.6%) 27 (4.1%) 27 (4.0%) 25 (5.2%) Azores 201 (1.9%) 78 (2.4%) 47 (1.6%) 38 (1.6%) 38 (1.6%) Madeira 237 (1.9%) 73 (1.9%) 74 (2.2%) 41 (1.5%) 49 (2.0%) Marital status Single 100 (3.1%) 36 (3.26%) 30 (2.9%) 11 (3.7%) 23 (2.5%) Married 1480 (65.8%) 509 (78.0%) 422 (68.2%) 321 (64.8%) 228 (45.6%) Divorced 100 (4.9%) 46 (5.3%) 24 (7.5%) 20 (4.0%) 10 (0.2%) Widowed 705 (25.9%) 117 (13.0%) 168 (21.4%) 174 (27.3%) 246 (49.9%) Consensual union 6 (0.2%) 3 (0.4%) 0 (0.0%) 1 (0.0%) 2 (0.0%) Household income < 500€ 663 (32.1%) 139 (21.2%) 162 (24.1%) 175 (44.3%) 187 (48.1%) 501€ to 750€ 491 (26.5%) 155 (29.4%) 146 (25.5%) 103 (26.6%) 87 (23.6%) 751€ to 1000€ 235 (19.3%) 82 (18.3%) 72 (30.2%) 42 (11.8%) 39 (12.2%) 1001€ to 1500€ 184 (10.4%) 75 (14.3%) 42 (7.9%) 37 (10.1%) 30 (8.3%) 1501€ to 2000€ 91 (4.6%) 34 (6.1%) 30 (5.7%) 9 (1.8%) 18 (3.4%) 2001€ to 2500€ 49 (2.9%) 22 (5.2%) 11 (2.3%) 6 (1.4%) 10 (1.8%) 2501€ to 3000€ 34 (2.5%) 14 (2.9%) 8 (1.8%) 6 (3.2%) 6 (2.0%) 3001€ to 4000€ 19 (1.0%) 7 (1.5%) 6 (1.2%) 3 (0.6%) 3 (0.4%) > 4000€ 13 (0.8%) 6 (1.1%) 5 (1.2%) 1 (0.3%) 1 (0.2%) Household composition 1 person 630 (24.4%) 143 (15.6%) 155 (24.1%) 153 (27.1%) 179 (35.2%) 2 people 1327 (58.3%) 412 (63.8%) 376 (59.4%) 292 (57.3%) 247 (49.6%) 3 people 299 (12.1%) 112 (15.5%) 78 (12.1%) 54 (9.2%) 55 (10.0%) ≥ 4 people 137 (5.2%) 45 (5.2%) 36 (4.4%) 28 (6.4%) 28 (5.2%) Employment status Employed full-time/part-time/domestic 297 (10.8%) 106 (11.5%) 63 (7.1%) 54 (9.4%) 74 (16.5%) Retired/temporary work 1972 (88.8%) 578 (87.6%) 550 (92.9%) 441 (90.4%) 403 (83.5%)
Sample sizes varied because of missing data: Sex (n = 2393), Ethnicity/race (n = 2389), NUTS II (n = 2393,) Years of education (n = 2384), Education level (n = 2362), Marital status (n = 2391), Household income (n = 1779), Household composition (n = 2393), and Employment status (n = 2276).
All percentages and means were weighted to correct for population representativeness. NUTS II: Nomenclature of Territorial Units for Statistics; SD: standard deviation
ARTIGO ORIGINAL
and Algarve were regions with a lower proportion of daily intake of soup and vegetables. In Azores, 56.4% of older adults reported daily intake of soup and 43.3% reported daily intake of vegetables; in Madeira, 28.8% reported
daily intake of soup and 36.0% reported daily intake of vegetables; and in Algarve, 46.1% reported daily intake of soup and 42.8% reported daily intake of vegetables. Azores and Madeira also had the lowest proportions for daily intake
Table 2 – Lifestyle characteristics and anthropometric data of the older adult Portuguese population (section 1 of 3) ≥ 65 years
n = 2393 65 - 69 yearsn = 712 70 - 74 yearsn = 645 75 - 79 yearsn = 527 ≥ 80 yearsn = 509 Anthropometric data
Body mass index
Underweight 16 (0.8%) 1 (0.2%) 4 (0.7%) 6 (1.5%) 5 (1.4%) Normal weight 606 (30.4%) 174 (29.0%) 143 (23.5%) 131 (30.7%) 158 (43.8%) Overweight 943 (46.5%) 315 (45.7%) 266 (50.8%) 200 (48.1%) 162 (39.1%) Obesity 509 (22.3%) 176 (25.1%) 166 (25.0%) 98 (19.7%) 69 (15.6%) Alcohol intake Daily 689 (33.8%) 226(35.8%) 180 (32.4%) 156 (33.5%) 127 (33.2%) Occasionally 429 (19.3%) 157 (21.0%) 108 (19.0%) 86 (20.3%) 78 (16.1%) Never 1209 (46.9%) 315 (43.3%) 337 (48.5%) 269 (46.2%) 288 (50.7%) Smoking habits Current smoker 101 (5.2%) 49 (9.9%) 32 (5.4%) 12 (1.7%) 8 (7.2%) Past smoker 538 (25.6%) 170 (29.2%) 139 (22.9%) 118 (23.5%) 111 (26.0%) Never 1691 (69.2%) 480 (60.9%) 456 (71.8%) 380 (74.8%) 375 (72.4%) Physical activity Inactive 1529 (66.6%) 406 (65.9%) 398 (74.4%) 356 (76.8%) 369 (81.7%) Moderately active 155 (7.9%) 63 (13.2%) 36 (7.6%) 35 (8.8%) 21 (4.0%) Active 452 (25.5%) 100 (20.9%) 78 (18.1%) 47 (14.4%) 41 (14.3%) Sleep habits < 6 hours/day 318 (29.6%) 181 (73.3%) 171 (77.1%) 125 (62.5%) 168 (66.7%) ≥ 6 hours/day 645 (70.4%) 75 (26.7%) 69 (22.9%) 89 (37.5%) 85 (33.3%) Screen time
Frequency of watching television
Does not watch 34 (1.9%) 8 (1.8%) 8 (1.5%) 6 (1.2%) 12 (3.1%)
≤ 2 hours/day 859 (47.2%) 265 (44.9%) 236 (52.8%) 180 (42.1%) 178 (48.5%)
3 - 4 hours/day 571 (34.6%) 154 (34.8%) 154 (33.1%) 139 (40.0%) 124 (30.9%)
≥ 5 hours/day 297 (16.3%) 83 (18.4%) 65 (12.6%) 74 (16.8%) 75 (17.5%)
Frequency of using computer/video games/tablets
Does not use 1480 (84.5%) 362 (73.4%) 390 (84.4%) 356 (89.9%) 372 (95.8%)
≤ 2 hours/day 231 (12.6%) 122 (22.6%) 58 (11.2%) 37 (9.0%) 14 (3.4%)
3 - 4 hours/day 30 (1.5%) 14 (2.4%) 10 (1.9%) 4 (1.0%) 2 (0.3%)
≥ 5 hours/day 20 (1.4%) 11 (1.7%) 6 (2.5%) 1 (0.2%) 2 (0.5%)
Search time regarding information about health
0 hours/week 1294 (83.6%) 326 (79.4%) 347 (81.0%) 309 (86.0%) 312 (90.3%) < 5 hours/week 223(14.8%) 85 (17.6%) 63 (18.5%) 45 (13.6%) 30 (7.3%) > 5 hours/week 23 (1.6%) 14 (3.0%) 3 (0.5%) 3 (0.4%) 3 (2.4%) Number of meals 2 meals/day 74 (4.8%) 26 (4.6%) 20 (7.6%) 13 (2.9%) 15 (3.3%) 3 meals/day 810 (45.3%) 236 (46.8%) 202 (41.1%) 188 (48.8%) 184 (45.1%) 4 meals/day 593 (33.1%) 149 (26.0%) 153 (32.7%) 143 (36.5%) 148 (40.7%) 5 or more meals/day 277 (16.8%) 98 (22.6%) 88 (18.5%) 49 (11.8%) 42 (10.9%)
ARTIGO ORIGINAL
of fruits: 67.8% in Azores and 73.2% in Madeira (Table 4). Overall, 26.2% of participants ate meat more than seven times per week and 40.6% consumed fish in 4 to 6 meals
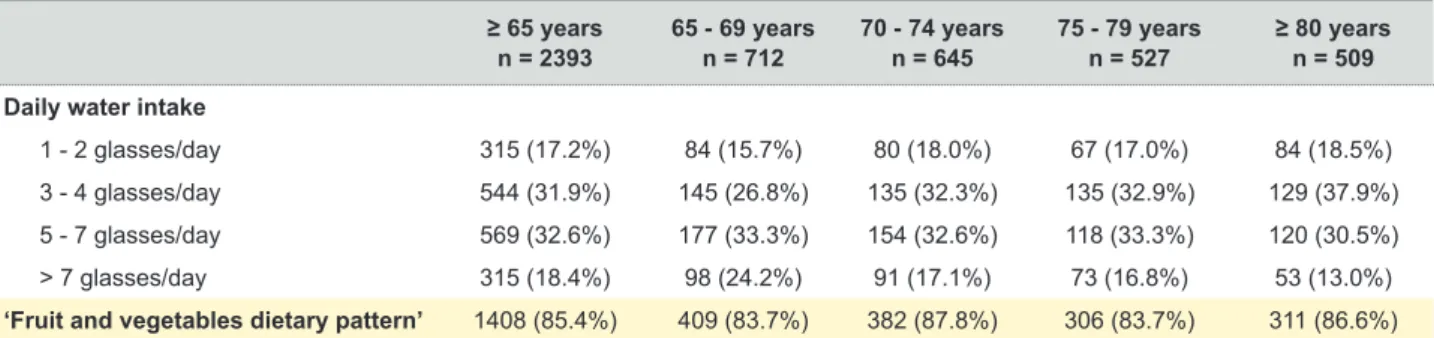
per week. Of note, only 18.4% of older adults drank more than seven glasses of water each day (Table 2).
Table 2 – Lifestyle characteristics and anthropometric data of the older adult Portuguese population (section 2 of 3) ≥ 65 years
n = 2393 65 - 69 yearsn = 712 70 - 74 yearsn = 645 75 - 79 yearsn = 527 ≥ 80 yearsn = 509 Frequency of soup consumption
Every day 1021 (58.4%) 261 (51.8%) 262 (58.9%) 244 (62.6%) 254 (63.0%) 6 times/week 90 (4.4%) 21 (3.3%) 30 (5.5%) 19 (5.3%) 20 (3.7%) 3 - 5 times/week 376 (20.2%) 131 (24.9%) 86 (16.1%) 81 (19.8%) 78 (19.3%) 1 - 2 times/week 157 (9.9%) 57 (13.7%) 51 (8.7%) 30 (7.7%) 19 (8.2%) Rarely 80 (5.2%) 25 (3.7%) 23 (8.8%) 17 (3.4%) 15 (4.4%) Never 37 (1.9%) 15 (2.7%) 11 (1.9%) 5 (1.2%) 6 (1.4%)
Frequency of vegetables consumption
Every day 1037 (59.9%) 305 (59.4%) 281 (62.7%) 235 (61.5%) 216 (55.5%) 6 times/week 148 (6.9%) 36 (6.3%) 47 (8.3%) 34 (6.4%) 31 (64.2%) 3 - 5 times/week 370 (22.6%) 125 (28.6%) 82 (20.8%) 73 (18.0%) 90 (20.6%) 1 - 2 times/week 143 (7.3%) 32 (4.4%) 40 (6.0%) 37 (9.3%) 34 (11.2%) Rarely 44 (2.5%) 6 (0.6%) 10 (1.9%) 14 (4.3%) 14 (4.3%) Never 15 (0.8%) 4 (0.7%) 3 (0.4%) 2 (0.4%) 6 (2.0%)
Frequency of fresh fruit consumption
Everyday 1438 (83.8%) 414 (83.3%) 390 (83.3%) 316 (83.5%) 318 (85.8%) 6 times/week 58 (2.7%) 12 (2.2%) 10 (12.6%) 20 (4.5%) 16 (3.5%) 3 - 5 times/week 148 (6.8%) 48 (7.7%) 32 (5.6%) 30 (6.6%) 38 (7.3%) 1 - 2 times/week 61 (3.5%) 22 (2.4%) 17 (7.2%) 14 (2.4%) 8 (1.3%) Rarely 36 (1.6%) 9 (1.1%) 12 (2.2%) 9 (1.9%) 6 (1.3%) Never 13 (1.5%) 2 (3.3%) 3 (0.4%) 5 (0.5%) 3 (0.9%)
Frequency of meat consumption
10 - 14 meals/week 85 (6.3%) 34 (11.1%) 22 (4.8%) 16 (3.7%) 13 (3.6%) 7 - 10 meals/week 337 (19.9%) 107 (21.1%) 98 (20.9%) 65 (17.2%) 67 (19.7%) 4 - 6 meals/week 572 (34.2%) 169 (34.0%) 163 (37.0%) 133 (35.2%) 107 (29.6%) 1 - 3 meals/week 664 (34.5%) 177 (27.5%) 157 (33.6%) 154 (38.7%) 176 (42.0%) Rarely 65 (3.2%) 15 (2.4%) 16 (3.0%) 16 (3.8%) 18 (4.0%) Never 21 (1.9%) 4 (3.8%) 4 (0.6%) 6 (1.3%) 7 (0.1%)
Frequency of fish consumption
10 - 14 meals/week 75 (3.6%) 21 (3.2%) 17 (3.4%) 19 (3.9%) 18 (4.2%) 7 - 10 meals/week 312 (19.8%) 106 (21.6%) 80 (20.8%) 66 (17.3%) 60 (18.0%) 4 - 6 meals/week 657 (40.6%) 200 (40.7%) 175 (41.0%) 154 (44.7%) 128 (35.7%) 1 - 3 meals/week 623 (32.2%) 162 (28.7%) 169 (32.8%) 130 (30.5%) 162 (38.4%) Rarely 51 (2.3%) 14 (2.5%) 13 (1.7%) 12 (2.4%) 12 (2.8%) Never 13 (1.6%) 2 (3.3%) 3 (0.4%) 5 (1.1%) 3 (0.9%)
Frequency of milk/dairy products consumption
Every day 1323 (76.6%) 383 (81.4%) 351 (71.4%) 300 (75.2%) 289 (78.1%) 6 times/week 32 (1.5%) 9 (1.2%) 9 (1.3%) 5 (1.1%) 9 (2.6%) 3 - 5 times/week 143 (7.0%) 42 (7.5%) 43 (7.4%) 29 (6.1%) 29 (6.8%) 1 - 2 times/week 243 (3.9%) 36 (4.5%) 17 (2.5%) 18 (4.6%) 19 (4.4%) Rarely 81 (5.0%) 19 (3.0%) 22 (4.8%) 21 (8.8%) 19 (4.2%) Never 84 (6.0%) 19 (2.4%) 21 (12.7%) 20 (4.1%) 24 (4.1%)
ARTIGO ORIGINAL
Table 2 – Lifestyle characteristics and anthropometric data of the older adult Portuguese population (section 3 of 3) ≥ 65 years
n = 2393 65 - 69 yearsn = 712 70 - 74 yearsn = 645 75 - 79 yearsn = 527 ≥ 80 yearsn = 509 Daily water intake
1 - 2 glasses/day 315 (17.2%) 84 (15.7%) 80 (18.0%) 67 (17.0%) 84 (18.5%)
3 - 4 glasses/day 544 (31.9%) 145 (26.8%) 135 (32.3%) 135 (32.9%) 129 (37.9%)
5 - 7 glasses/day 569 (32.6%) 177 (33.3%) 154 (32.6%) 118 (33.3%) 120 (30.5%)
> 7 glasses/day 315 (18.4%) 98 (24.2%) 91 (17.1%) 73 (16.8%) 53 (13.0%)
‘Fruit and vegetables dietary pattern’ 1408 (85.4%) 409 (83.7%) 382 (87.8%) 306 (83.7%) 311 (86.6%)
Sample sizes varied because of missing data: Body mass index (n = 2074), Alcohol intake (n = 2327), Smoking habits (n = 2330), Physical activity (n = 2136), Sleep habits (n = 963), Frequency of watching television (n = 1761), Frequency of using computer/video games/tablets (n = 1761), Time spent searching for information about health (n = 1540), Number of meals (n = 1754), Frequency of soup consumption (n = 1761), Frequency of vegetables consumption (n = 1757), Frequency of fresh fruit consumption (n = 1754), Frequency of meat consumption (n = 1744), Frequency of fish consumption (n = 1731), Frequency of milk/dairy products consumption (n = 1753), Daily water intake (n = 1743), and Fruit and vegetables dietary pattern (n = 1708).
All percentages and means were weighted to correct for population representativeness.
Table 3 – Health characteristics of the older adult Portuguese population ≥ 65 years
n = 2393 65 - 69 yearsn = 712 70 - 74 yearsn = 645 75 - 79 yearsn = 527 ≥ 80 yearsn = 509 Number of noncommunicable chronic
diseases (self-reported) (mean ± SD) 3.26 ± 2.53 2.92 ± 1.19 3.39 ± 1.51 3.49 ± 1.31 3.34 ± 1.49
Noncommunicable chronic diseases (self-reported)
Hypertension 1401 (57.3%) 385 (53.7%) 401 (62.0%) 314 (58.4%) 301 (55.2%) Diabetes 545 (22.7%) 147 (20.8%) 159 (25.1%) 116 (21.0%) 123 (24.2%) Hypercholesterolemia 1225 (49.4%) 362 (48.5%) 369 (50.3%) 270 (51.6%) 224 (46.9%) Pulmonary disease 255 (11.1%) 60 (10.6%) 76 (11.1%) 65 (11.6%) 54 (11.3%) Cardiac disease 651 (27.3%) 122 (17.3%) 169 (26.3%) 169 (34.7%) 191 (36.1%) Gastrointestinal disease 689 (30.3%) 175 (27.0%) 191 (31.9%) 178 (35.4%) 145 (27.9%) Neurologic disease 180 (7.3%) 48 (7.9%) 47 (6.4%) 50 (8.4%) 35 (6.5%) Allergy 568 (23.9%) 161 (25.8%) 161 (22.7%) 125 (23.5%) 121 (23.1%) Neoplastic disease 203 (7.8%) 57 (7.7%) 62 (8.3%) 50 (8.2%) 34 (6.7%)
Thyroid or parathyroid disease 321 (11.7%) 98 (11.0%) 105 (14.5%) 68 (11.8%) 50 (8.8%)
Hyperuricemia 295 (13.3%) 70 (10.2%) 94 (15.1%) 64 (12.4%) 67 (16.4%)
Rheumatic disease 1280 (51.9%) 346 (46.3%) 359 (50.2%) 299 (57.2%) 276 (57.2%)
Multimorbidity 1624 (78.3%) 472 (72.8%) 459 (78.2%) 360 (81.9%) 333 (83.4%)
Anxiety and depression symptoms
Anxiety symptoms (HADS score ≥ 11) 176 (9.6%) 52 (12.4%) 45 (7.9%) 47 (9.0%) 32 (8.5%)
Depression symptoms (HADS score ≥ 11) 241 (11.8%) 44 (7.3%) 65 (11.3%) 68 (15.2%) 64 (15.5%) Quality of life
EQ-5D-3L score (mean ± SD) 0.59 ± 0.38 0.64 ± 0.35 0.61 ± 0.37 0.54 ± 0.42 0.53 ± 0.39
Physical function
HAQ score (0 -3) (mean ± SD) 0.76 ± 0.87 0.55 ± 0.69 0.72 ± 0.83 0.89 ± 0.96 0.98 ± 0.98
Healthcare resources consumption
Hospitalized in previous 12 months 524 (25.8%) 127 (22.3%) 145 (28.1%) 127 (26.4%) 125 (27.4%)
Home care in previous 12 months 86 (7.5%) 8 (2.0%) 16 (4.2%) 24 (9.6%) 38 (14.7%)
Medical appointment in previous 12 months 1718 (96.0%) 489 (96.3%) 462 (98.1%) 393 (98.2%) 374 (90.4%) Number of medical appointments in
previous 12 months (mean ± SD) 8.11 ± 10.74 8.01 ± 10.86 7.82 ± 8.73 7.82 ± 7.94 9.04 ± 15.27 Sample sizes varied because of missing data: Hypertension (n = 2348), Diabetes (n = 2312), Hypercholesterolemia (n = 2334), Pulmonary disease (n = 2325), Cardiac disease (n = 2322), Gastrointestinal disease (n = 2334), Neurologic disease (n = 2322), Allergy (n = 2339), Mental disease (n = 2330), Neoplastic disease (n = 2333), Thyroid or parathyroid disease (n = 2328), Hypogonadism (n = 2268), Hyperuricemia (n = 2267), Rheumatic disease (n = 2278), EQ-5D-3L score (n = 2211), Physical function HAQ score (0 - 3) (n = 2236), HADS Anxiety score (n = 1680), HADS Depression score (n = 1680), Hospitalization (n = 2366), Home care (n = 1018), Medical appointment (n = 1783), and Number of medical appointments (n = 1545).
All percentages and means were weighted to correct for population representativeness.
EQ-5D-3L: European Quality of Life questionnaire with five dimensions and three levels; HADS: Hospital Anxiety and Depression scale; HAQ: Health Assessment questionnaire; SD: standard deviation.
ARTIGO ORIGINAL
Figure 2 – Distribution of ‘fruit and vegetables dietary pattern’ by region among Portuguese seniors according to NUTS II NUTS II: Nomenclature of Territorial Units for Statistics
69.0% ≥ 88.2% Azores Madeira 83.4% - 88.2% 78.6% - 83.4% 73.8% - 78.6% > 73.8% 73.9% 79.5% 87.1% 87.6% 90.7% 93.0%
participants reflected their health status. In the 12 months before the EpiDoC 2 interview, 1718 older adults (96%) attended at least one medical appointment, and the mean number of appointments was 8.11 ± 10.74. In the previous 12 months, 25.8% of older adults were hospitalized, and 86 (7.5%) received home care assistance. Home care utilization during the previous 12 months was particularly high among the oldest age group: 14.7% among individuals aged ≥ 80 years vs. 2.0% in those aged 65 to 70 years (Table 5). The percentages of patients hospitalized (31.4%) and attending at least one medical appointment (99.3%) during the previous 12 months were highest in Lisboa; however, the number of medical appointments in the previous 12 months were highest in Azores (16.57) and Madeira (14.88) (Table 4).
DISCUSSION
In the present study, we determined the prevalence of multimorbidity and analysed the prevalence of chronic diseases, lifestyle factors, quality of life, and health resources consumption among older adults, using data from a national cohort representative sample of the Portuguese population.
Despite positive results obtained for life expectancy in Portugal - which increased from 78.2 to 81.3 years between 2005 and 201525 - our data show that many individuals
65 years and older are living in poor health conditions.
Health characteristics
The overall prevalence of multimorbidity among older adults was high (78.3%), and it increased across age strata, ranging from 72.8% for individuals aged 65 to 69 years to 83.4% among adults ≥ 80 years (Table 3). Multimorbidity prevalence was higher in Azores (84.9%) and Alentejo (83.6%) (Table 4). The mean number of noncommunicable chronic diseases was 3.3 ± 2.5. The most frequently reported chronic diseases were hypertension (57.3%), rheumatic disease (51.9%), and hypercholesterolemia (49.4%). Depression symptoms were frequent among older adults (11.8%) and were most common in the oldest individuals, with a frequency of 15.5% in those ≥ 80 years old. Cardiac disease was more common in participants 80 years and older (36.1%) than in those aged 65 to 69 years (17.3%) (Table 3). Azores was the region with the highest prevalence of hypertension (61.2%) and cardiac disease (34.8%); hypercholesterolemia (53.0%) and gastrointestinal disease (34.9%) were most prevalent in the Norte region (Table 4).
The mean EQ-5D-3L was 0.59 ± 0.38 in all older adults; this quality of life score remained stable across age strata (Table 3). Regarding physical disability, the mean HAQ score was 0.76 ± 0.87 for all individuals and increased across age strata, with a score of 0.98 ± 0.98 among adults 80 years and older.
ARTIGO ORIGINAL
had incomes below 500 euros per month). Furthermore, approximately one-quarter lived alone. These data are consistent with the results of previous studies in our country26 suggesting that people 65 years and older had a
higher risk of poverty. Despite generally improving poverty rates among older adults in recent years, poverty rates Apart from the known health consequences of the ageing
process, we observed that older Portuguese adults are a vulnerable group in terms of poor socioeconomic conditions and unhealthy lifestyle behaviours. Indeed, the majority of individuals 65 years and older had four or fewer years of education and reported a low household income (32.1%
Table 4 – Lifestyle characteristics of the older adult Portuguese population according to NUTS II region (section 1 of 3) Norte
n = 653 n = 547Centro n = 481Lisboa Alentejon = 169 Algarven = 105 n = 201Azores Madeiran = 237 Anthropometric data
Body mass index (kg/m2)
Underweight 4 (0.6%) 7 (1.5%) 1 (0.2%) 2 (2.4%) 1 (0.7%) 0 (0.0%) 1 (0.8%) Normal weight 169 (36.2%) 129 (27.9%) 132 (25.2%) 44 (29.5%) 31 (33.6%) 49 (26.2%) 52 (30.4%) Overweight 261 (44.2%) 213 (46.1%) 208 (52.5%) 57 (41.0%) 41 (49.4%) 73 (40.2%) 90 (47.7%) Obesity 133 (19.0%) 114 (24.6%) 94 (22.1%) 38 (28.2%) 13 (16.4%) 63 (33.7%) 54 (24.3%) Smoking habits Current smoker 30 (7.1%) 10 (1.9%) 27 (6.0%) 10 (7.5%) 3 (3.0%) 15 (9.0%) 6 (3.4%) Past smoker 144 (23.9%) 107 (21.5%) 138 (32.3%) 30 (22.1%) 24 (37.6%) 53 (29.4%) 42 (22.6%) Never 462 (69.1%) 416 (76.6%) 296 (61.7%) 125 (70.4%) 75 (59.4%) 131 (61.6%) 186 (74.0%) Alcohol intake Daily 258 (40.4%) 177 (35.7%) 131 (31.4%) 29 (20.9%) 18 (26.5%) 38 (21.3%) 38 (20.1%) Occasionally 118 (23.4%) 78 (15.3%) 93 (17.6%) 32 (21.0%) 15 (16.3%) 31 (16.9%) 6226.4%) Never 260 (36.2%) 277 (49.0%) 237 (51.1%) 103 (58.2%) 68 (57.2%) 130 (61.8%) 134 (53.5%) Physical activity Inactive 421 (69.7%) 360 (75.7%) 271 (72.7%) 109 (80.1%) 70 (78.6%) 132 (84.6%) 166 (73.8%) Moderately active 48 (10.4%) 36 (8.5%) 41 (9.2%) 6 (5.4%) 6 (6.8%) 7 (6.0%) 11 (8.8%) Active 82 (19.9%) 65 (15.9%) 58 (18.1%) 16 (14.7%) 9 (14.7%) 15 (12.6%) 21 (17.4%) Screen time
Frequency of watching television
Does not watch 12 (1.6%) 10 (2.4%) 6 (1.5%) 4 (3.2%) 0 (0.0%) 0 (0.0%) 2 (1.5%) ≤ 2 hours/day 280 (50.2%) 223 (48.0%) 159 (42.7%) 50 (45.8%) 28 (41.2%) 41 (42.1%) 78 (53.8%) 3 - 4 hours/day 184 (34.4%) 151 (34.5%) 95 (34.4%) 36 (33.2%) 20 (41.7%) 38 (41.3%) 47 (30.2%) ≥ 5 hours/day 89 (13.9%) 65 (15.0%) 73 (21.5%) 18 (17.8%) 14 (17.1%) 15 (16.6%) 23 (14.5%)
Frequency of using computer/video games/tablets
Does not use 494 (88.6%) 403 (89.6%) 235 (73.1%) 98 (85.6%) 51 (73.6%) 71 (75.3%) 128 (82.8%) ≤ 2 hours/day 53 (9.0%) 38 (9.0%) 79 (20.7%) 11 (12.4%) 10 (24.4%) 21 (22.5%) 19 (14.7%) 3 - 4 hours/day 10 (1.5%) 6 (1.4%) 10 (2.2%) 1 (1.2%) 0 (0.0%) 1 (1.1%) 2 (1.4%) ≥ 5 hours/day 6 (1.0%) 0 (0.0%) 9 (4.0%) 1 (0.8%) 1 (2.0%) 1 (1.1%) 2 (1.0%)
Search time regarding information about health
0 hours/week 434 (85.3%) 334 (83.8%) 235 (79.1%) 75 (83.0%) 43 (88.5%) 54 (84.9%) 119 (89.3%) < 5 hours/week 80 (13.4%) 60 (14.4%) 42 (18.0%) 14 (17.0%) 6 (11.6%) 9 (15.2%) 12 (9.2%) > 5 hours/week 7 (1.3%) 7 (1.8%) 7 (2.9%) 0 (0.0%) 0 (0.0%) 0 (0.0%) 2 (1.6%)
Frequency of soup consumption
Every day 341 (57.1%) 275 (59.3%) 206 (63.2%) 66 (60.9%) 33 (46.1%) 55 (56.4%) 45 (28.8%) 6 times/week 23 (3.6%) 23 (4.9%) 11 (1.9%) 9 (8.8%) 4 (7.9%) 7 (8.7%) 13 (7.0%) 3 - 5 times/week 111 (19.4%) 95 (22.7%) 63 (17.3%) 23 (21.0%) 11 (21.0%) 22 (24.1%) 51 (34.9%) 1 - 2 times/week 45 (12.8%) 29 (7.5%) 29 (7.2%) 6 (18.3%) 10 (18.3%) 9 (9.8%) 29 (22.2%) Rarely 29 (4.8%) 16 (3.5%) 17 (9.6%) 5 (2.3%) 2 (2.3%) 1 (1.0%) 10 (5.5%) Never 17 (2.4%) 9 (2.1%) 5 (0.8%) 1 (4.4%) 2 (4.4%) 0 (0.0%) 3 (1.6%)
ARTIGO ORIGINAL
increased from 14.6% to 17% between 2013 and 2014.27
According to European Union statistics on income and living conditions (EU-SILC) for 2014, 31.4% of individuals aged 65 and over lived alone in EU-28, and 24.7% lived alone in Portugal, a percentage similar to ours.28 Several studies
have suggested that loneliness in older adults is associated
with adverse health outcomes, both in terms of physical and mental health.29 Poor socioeconomic conditions in later
life should receive particular attention, since it is one of the main determinants of poor health status.30 Furthermore,
deterioration in health status accompanying the ageing process is associated with additional needs in terms of
Table 4 – Lifestyle characteristics of the older adult Portuguese population according to NUTS II region (section 2 of 3) Norte
n = 653 n = 547Centro n = 481Lisboa Alentejon = 169 Algarven = 105 Azoresn = 201 Madeiran = 237 Frequency of vegetables consumption
Every day 353 (57.7%) 284 (63.8%) 219 (66.9%) 59 (54.6%) 28 (42.8%) 43 (43.3%) 51 (36.0%) 6 times/week 34 (4.7%) 44 (9.6%) 21 (4.4%) 8 (6.5%) 10 (17.9%) 9 (9.8%) 22 (13.5%) 3 - 5 times/week 109 (24.5%) 79 (17.5%) 59 (21.3%) 32 (27.4%) 17 (31.8%) 25 (29.0%) 49 (30.9%) 1 - 2 times/week 52 (9.9%) 24 (5.8%) 23 (4.7%) 5 (6.2%) 5 (5.3%) 12 (12.7%) 22 (15.3%) Rarely 11 (2.5%) 13 (3.0%) 4 (1.1%) 6 (4.8%) 1 (1.3%) 3 (2.8%) 6 (3.8%) Never 5 (0.7%) 2 (0.5%) 3 (1.6%) 1 (0.5%) 1 (0.9%) 2 (2.4%) 1 (0.6%)
Frequency of fresh fruit consumption
Every day 439 (79.5%) 381 (86.5%) 292 (86.5%) 98 (89.3%) 52 (87.6%) 67 (67.8%) 109 (73.2%) 6 times/week 17 (2.7%) 16 (3.4%) 8 (1.7%) 3 (2.9%) 1 (0.8%) 1 (1.5%) 12 (6.7%) 3 - 5 times/week 58 (8.2%) 31 (6.6%) 18 (3.5%) 8 (6.2%) 6 (9.7%) 11 (14.1%) 16 (12.4%) 1 - 2 times/week 25 (3.5%) 8 (1.6%) 6 (6.9%) 1 (0.8%) 2 (1.9%) 11 (11.9%) 8 (5.0%) Rarely 15 (2.2%) 7 (1.4%) 6 (1.4%) 1 (0.8%) 0 (0.0%) 3 (3.7%) 4 (2.3%) Never 9 (3.9%) 2 (0.4%) 0 (0.0%) 0 (0.0%) 0 (0.0%) 1 (1.1%) 1 (0.5%)
Frequency of meat consumption
10 - 14 meals/week 31 (9.4%) 14 (3.8%) 10 (2.5%) 8 (8.1%) 4 (10.2%) 9 (10.8%) 9 (6.5%) 7 - 10 meals/week 131 (22.4%) 72 (16.4%) 56 (19.6%) 25 (24.7%) 11 (15.9%) 19 (20.2%) 23 (15.2%) 4 - 6 meals/week 204 (37.0%) 155 (36.5%) 109 (30.0%) 31 (30.1%) 13 (25.1%) 17 (19.5%) 43 (32.9%) 1 - 3 meals/week 176 (28.6%) 178 (37.2%) 135 (39.2%) 39 (33.6%) 28 (43.7%) 45 (45.6%) 63 (39.3%) Rarely 16 (2.3%) 19 (4.8%) 11 (2.2%) 4 (3.5%) 3 (3.3%) 3 (2.9%) 9 (5.1%) Never 3 (0.4%) 7 (1.2%) 6 (6.5%) 0 (0.0%) 2 (1.9%) 1 (1.1%) 2 (1.0%)
Frequency of fish consumption
10 - 14 meals/week 8 (1.1%) 17 (3.8%) 13 (3.8%) 7 (6.2%) 7 (13.5%) 17 (16.2%) 6 (4.7%) 7 - 10 meals/week 102 (16.3%) 83 (18.0%) 60 (27.7%) 23 (23.1%) 15 (23.2%) 12 (12.5%) 17 (11.5%) 4 - 6 meals/week 187 (37.9%) 194 (46.0%) 161 (46.5%) 30 (29.6%) 18 (27.0%) 33 (35.5%) 34 (24.3%) 1 - 3 meals/week 231 (37.8%) 137 (29.3%) 89 (21.2%) 42 (38.6%) 20 (35.4%) 27 (30.7%) 77 (51.9%) Rarely 17 (2.9%) 10 (2.5%) 4 (0.8%) 3 (2.5%) 1 (0.9%) 4 (4.0%) 12 (7.2%) Never 9 (4.0%) 2 (0.4%) 0 (0.0%) 0 (0.0%) 0 (0.0%) 1 (1.1%) 1 (0.5%)
Frequency of milk/dairy products consumption
Every day 341 (71.8%) 275 (80.0%) 206 (78.9%) 66 (82.1%) 33 (79.5%) 55 (69.1%) 45 (76.6%) 6 times/week 23 (1.6%) 23 (2.6%) 11 (0.3%) 9 (0.0%) 4 (2.3%) 7 (1.2%) 13 (1.5%) 3 - 5 times/week 111 (7.8%) 95 (5.8%) 63 (5.5%) 23 (7.6%) 11 (13.3%) 22 (13.6%) 51 (8.6%) 1 - 2 times/week 45 (4.6%) 29 (5.0%) 29 (1.8%) 6 (2.6%) 10 (2.0%) 9 (7.1%) 29 (7.3%) Rarely 29 (5.9%) 16 (4.1%) 17 (4.9%) 5 (5.4%) 2 (0.9%) 1 (5.1%) 10 (7.3%) Never 17 (8.3%) 9 (2.6%) 5 (8.6%) 1 (2.3%) 2 (2.0%) 0 (4.0%) 3 (9.3%)
Daily water intake
1 - 2 glasses/day 116 (19.9%) 58 (13.2%) 44 (15.8%) 21 (19.7%) 10 (16.0%) 20 (22.1%) 46 (31.0%) 3 - 4 glasses/day 184 (36.6%) 137 (31.2%) 95 (26.0%) 31 (27.2%) 23 (35.3%) 30 (32.6%) 44 (29.0%) 5 - 7 glasses/day 165 (26.1%) 165 (38.0%) 114 (36.0%) 36 (33.1%) 21 (38.3%) 27 (27.6%) 41 (26.1%) > 7 glasses/day 96 (17.4%) 82 (17.7%) 75 (22.2%) 20 (20.0%) 7 (10.5%) 17 (17.7%) 18 (13.9%)
ARTIGO ORIGINAL
healthcare utilization, which may be difficult to obtain by older people with a poor socioeconomic situation. As Chen stressed, poor socioeconomic status is quite closely related to less capacity for health self-management in the older population.31
Multimorbidity is becoming more common as life expectancy increases. Our findings revealed the presence of multiple chronic health problems (mean number of 3.3 chronic diseases), with a high proportion (78.3%) of multimorbidity among Portuguese older adults. Moreover, our results suggested that multimorbidity increases with age among older adults. These results are consistent with the results of a systematic review by Salive, which found an overall prevalence of 67% for multimorbidity and a
prevalence of 81.5% for individuals ≥ 85 years old.32
The prevalence and patterns of multimorbidity differ across countries because of differences in population characteristics, socioeconomic, cultural factors, and social inequities.33 The most prevalent chronic diseases
in our study population were hypertension, rheumatic disease, hypercholesterolemia, gastrointestinal disease, cardiac disease, and diabetes, which are similar to the findings reported in other European and North American countries.5,34-36
Portuguese older adults reported lower levels of quality of life, as reflected by a mean EQ-5D-3L score of 0.59 ± 0.38, when compared with adults from other countries. In the Netherlands, quality of life expressed as the mean
Table 4 – Lifestyle characteristics of the older adult Portuguese population according to NUTS II region (section 3 of 3) Norte
n = 653 n = 547Centro n = 481Lisboa Alentejon = 169 Algarven = 105 n = 201Azores Madeiran = 237 Noncommunicable chronic diseases (self-reported)
Hypertension 394 (57.7%) 308 (58.5%) 280 (56.9%) 101 (58.8%) 50 (43.2%) 124 (61.2%) 144 (58.0%) Diabetes 152 (21.8%) 124 (22.7%) 92 (22.8%) 33 (21.3%) 27 (28.8%) 56 (19.9%) 61 (26.0%) Hypercholesterolemia 361 (53.0%) 274 (50.5%) 239 (45.0%) 85 (47.1%) 49 (43.3%) 98 (50.2%) 119 (47.0%) Pulmonary disease 89 (12.3%) 62 (11.6%) 48 (7.4%) 13 (8.0%) 8 (5.6%) 11 (5.8%) 24 (10.1%) Cardiac disease 189 (29.9%) 152 (30.2%) 114 (20.9%) 42 (24.3%) 24 (25.9%) 72 (34.8%) 58 (25.7%) Gastrointestinal disease 207 (34.9%) 150 (26.1%) 149 (32.7%) 143 (23.9%) 36 (30.8%) 60 (30.0%) 44 (18.1%) Neurologic disease 48 (6.3%) 31 (5.3%) 49 (11.1%) 17 (8.9%) 5 (3.7%) 17 (8.8%) 13 (6.3%) Allergy 135 (20.5%) 115 (23.0%) 150 (29.8%) 45 (27.5%) 25 (17.9%) 41 (21.2%) 57 (23.8%) Neoplastic disease 55 (7.0%) 38 (7.3%) 55 (9.5%) 13 (7.3%) 9 (9.1%) 15 (7.5%) 18 (6.9%) Thyroid or parathyroid disease 92 (13.0%) 78 (13.4%) 59 (7.9%) 26 (12.9%) 10 (8.2%) 28 (13.4%) 28 (10.3%) Hyperuricemia 88 (12.6%) 80 (15.8%) 66 (10.8%) 21 (14.1%) 16 (20.1%) 18 (8.6%) 6 (2.7%)
Rheumatic disease 342 (53.3%) 287 (53.0%) 254 (47.7%) 94 (54.3%) 56 (47.9%) 117 (58.9%) 130 (52.8%)
Multimorbidity 434 (77.2%) 355 (79.2%) 336 (76.1%) 123 (83.6%) 70 (79.3%) 149 (84.9%) 157 (74.6%)
Anxiety and depression symptoms
Anxiety symptoms
(HADS score ≥ 11) 67 (10.1%) 49 (10.1%) 23 (9.4%) 11 (7.9%) 3 (6.9%) 7 (7.0%) 16 (9.0%)
Depression symptoms
(HADS score ≥ 11) 80 (12.2%) 67 (14.6%) 33 (6.4%) 17 (12.8%) 10 (13.1%) 11 (12.2%) 23 (14.4%) Healthcare resources consumption
Hospitalized in previous 12
months 150 (23.7%) 131 (26.3%) 123 (31.4%) 39 (23.9%) 23 (26.5%) 24 (13.3%) 34 (14.7%) Home care in previous 12
months 27 (6.5%) 21 (8.3%) 14 (9.9%) 5 (5.5%) 2 (3.5%) 2 (5.9%) 15 (11.9%) Medical appointment in previous 12 months 548 (94.5%) 435 (96.8%) 348 (99.3%) 106 (93.1%) 62 (94.7%) 81 (92.2%) 138 (92.3%) Number of medical appointments in previous 12 months (mean ± SD) 6.69 ± 7.82 8.27 ± 10.88 10.88 ± 13.30 7.41 ± 5.38 6.32 ± 6.19 6.34 ± 16.57 6.68 ± 14.88
Sample sizes varied because of missing data: Body mass index (n = 2074), Alcohol intake (n = 2327), Smoking habits (n = 2330), Physical activity (n = 2136), Sleep habits (n = 963), Frequency of watching television (n = 1761), Frequency of using computer/video games/tablets (n = 1761), Time spent searching for information about health (n = 1540), Number of meals (n = 1754), Frequency of soup consumption (n = 1761), Frequency of vegetables consumption (n = 1757), Frequency of fresh fruit consumption (n = 1754), Frequency of meat consumption (n = 1744), Frequency of fish consumption (n = 1731), Frequency of milk/dairy products consumption (n = 1753), Daily water intake (n = 1743), Fruit and vegetables dietary pattern (n = 1708), Hypertension (n=2,348), Diabetes (n = 2312), Hypercholesterolemia (n = 2334), Pulmonary disease (n = 2325), Cardiac disease (n = 2322), Gastrointestinal disease (n = 2334), Neurologic disease (n = 2322), Allergy (n = 2339), Mental disease (n = 2330), Neoplastic disease (n = 2333), Thyroid or parathyroid disease (n = 2328), Hypogonadism (n = 2268), Hyperuricemia (n = 2267), Rheumatic disease (n = 2278), HADS Anxiety score (n = 1680), HADS Depression score (n = 1680), Hospitalized (n = 2366), Home care (n = 1018), Medical appointment (n = 1783), and Number of medical appointments (n = 1545).
All percentages and means were weighted to correct for population representativeness.
EQ-5D-3L: European Quality of Life questionnaire with five dimensions and three levels; HADS: Hospital Anxiety and Depression scale; HAQ: Health Assessment questionnaire; NUTS II: Nomenclature of Territorial Units for Statistics; SD: standard deviation.
ARTIGO ORIGINAL EQ-5D-3L score was 0.94 for adults 65 to 69 years old and 0.86 for individuals 85 years or older.37 These trends were
also observed for older Australians: the mean EQ-5D-3L score was 0.87 between 65 and 74 years of age and 0.83 at age 75 years or older).38 In our Portuguese older adults,
quality of life remained stable across age strata.
Our study suggests the need for lifestyle characterization of Portuguese older adults. Among individuals aged 65 and above, alcohol abstinence was high, but 33.8% reported daily alcohol intake. Additionally, the majority of individuals (69.2%) reported never smoking. The Survey in Europe on Nutrition and the Elderly: a Concerted Action (SENECA) study, which included participants from several European countries, showed that alcohol and smoking habits varied strongly across European countries, with highest daily alcohol consumption in France and Italy (58% and 78%, respectively).39
Regarding other lifestyle habits, a high proportion (66.6%) of Portuguese older adults was classified as inactive. These results are consistent with data from the Reasons for Geographic and Racial Differences in Stroke (REGARDS) study from the United States, in which middle-aged and older adults spend 77.4% of their time in sedentary behaviours.40 Other studies found similar
results.39 By contrast, older Norwegians have a more active
lifestyle, when compared with the Portuguese population. Indeed, among the Norwegian population, a high proportion of participants reported 30 minutes or more of daily physical activity, with women achieving this level of activity more commonly than men (38.7% of women vs 33% of men).41
The SENECA study showed significant variations in levels of physical activity among older adults across countries, ranging from 4% to 32%, with southern European countries having the lowest levels of activity.39
Regarding dietary habits, a high proportion of Portuguese older adults reported daily intake of fruit and vegetables; however, the majority had inadequate water intake. These findings are similar to those of other European countries.39,41
Our results showed that several unhealthy lifestyle behaviours appear to be more common in some regions of the Portugal (especially Azores and Madeira), suggesting that a combination of these modifiable risk factors might be present within specific groups of the population. Although we performed simple descriptive analysis in the current study, previous data including Portuguese adults of all ages suggested that some unhealthy lifestyle behaviours appear to be clustered in the same population groups.22
In a previous study based on EpiDoC 2 data but including all adult age groups, an ‘unhealthy’ dietary pattern was associated with other unhealthy behaviours, such as being sedentary, currently smoking, and consuming alcohol on a daily basis.22 Similar findings have been observed in other
countries as well.42
Furthermore, older individuals in Portugal have a high prevalence (69%) of overweight or obesity. This prevalence is consistent with findings of previous studies in Portugal,43
suggesting a much higher prevalence when compared with
the general adult population. However, when we analysed overweight prevalence across different age groups, there was a decreasing trend as age increased. This may be due to undernutrition, which is quite common in elderly individuals. Poor appetite, loss of taste and smell, dental deterioration, dysphagia, and limited access to food because of disease and disability are frequent among older individuals and lead to decreased food intake.44
The ageing process, in combination with unhealthy lifestyle behaviours and the presence of multiple chronic health problems, results in increased utilization of healthcare services and high costs for the health system. Our study showed high healthcare resources consumption among Portuguese older adults, which increased as age increased. Regional differences were also observed in healthcare resources consumption, with the regions of Lisboa, Azores, and Madeira exhibiting the highest healthcare utilization. Several factors can influence utilization, especially a person’s socioeconomic and health status and the healthcare system’s coverage and accessibility.45
Some limitations of our study should be considered. The sample used in this study did not include institutionalized older adults, so our results may not apply to this particularly susceptible group. Moreover, dietary intake was assessed with food frequency questions in EpiDoC 2, as there is no validated questionnaire for telephone use regarding dietary intake. In addition, data from noncommunicable diseases were based on self-reported data. Nonetheless, this study was performed in a national representative sample, with a robust study design and a high number of participants. In conclusion, Portuguese older adults represent a vulnerable group, with poor socioeconomic conditions, unhealthy lifestyle behaviours, and multimorbidity. Our results suggest that there is an urgent need to design and implement interventions to promote healthy lifestyle behaviours, improve health literacy, and control noncommunicable chronic diseases in later life.
PROTECTION OF HUMANS AND ANIMALS
The authors declare that the procedures were followed according to the regulations established by the Clinical Research and Ethics Committee and to the Helsinki Declaration of the World Medical Association.
DATA CONFIDENTIALITY
The authors declare having followed the protocols in use at their working center regarding patients’ data publication. Informed consent was duly obtained from the patient.
CONFLICTS OF INTEREST
All authors report no conflict of interest.
FUNDING SOURCES
The present project was granted by the Public Health Initiatives Programme (PT06), financed by EEA Grants Financial Mechanism 2009-2014.
ARTIGO ORIGINAL
REFERENCES
1. Instituto Nacional de Estatística. Envelhecimento da população residente em Portugal e na União Europeia. Lisboa: INE; 2015. 2. Lutz W, Sanderson W, Scherbov S. The coming acceleration of global
population ageing. Nature. 2008;451:716-9.
3. Lunenfeld B, Stratton P. The clinical consequences of an ageing world and preventive strategies. Best Pract Res Clin Obstet Gynaecol. 2013;27:643-59.
4. Avendano M, Glymour MM, Banks J, Mackenbach JP. Health disadvantage in US adults aged 50 to 74 years: a comparison of the health of rich and poor Americans with that of Europeans. Am J Public Health. 2009;99:540-8.
5. Prazeres F, Santiago L. Prevalence of multimorbidity in the adult population attending primary care in Portugal: a cross-sectional study. BMJ Open. 2015;5:e009287.
6. Shad BJ, Wallis G, van Loon LJ, Thompson JL. Exercise prescription for the older population: The interactions between physical activity, sedentary time, and adequate nutrition in maintaining musculoskeletal health. Maturitas. 2016;93:78-82.
7. Feinstein A. The pre-therapeutic classification of co-morbidity in chronic disease. J Chronic Dis. 1970;23:455–68.
8. Diederichs C, Berger K, Bartels D. The measurement of multiple chronic diseases - A systematic review on existing multimorbidity indices. Journals Gerontol - Ser A Biol Sci Med Sci. 2011;66A:301-11. 9. Feinstein AR. The pre-therapeutic classification of co-morbidity in
chronic disease. J Chronic Dis. 1970;23:455-68.
10. Wolff JL, Starfield B, Anderson G. Prevalence, expenditures, and complications of multiple chronic conditions in the elderly. Arch Intern Med. 2002;162:2269–76.
11. Rodrigues V, Mota-Pinto A, de Sousa B, Botelho A, Alves C, de Oliveira CR. The aging profile of the Portuguese population: a principal component analysis. J Community Health. 2014;39:747-52.
12. Mota-Pinto A, Rodrigues V, Botelho A, Verissimo MT, Morais A, Alves C, et al. A socio-demographic study of aging in the Portuguese population: the EPEPP study. Arch Gerontol Geriatr. 2011;52:304-8.
13. Börsch-Supan A, Kneip T, Litwin H, Myck M, Weber G. Ageing in Europe - Supporting policies for an inclusive society. 2015.
14. Rodrigues AM, Gouveia N, da Costa LP, Eusebio M, Ramiro S , Machado P, et al. EpiReumaPt - the study of rheumatic and musculoskeletal diseases in Portugal: a detailed view of the methodology. Acta Reumatol Port. 2015;40:110-24.
15. Branco JC, Rodrigues AM, Gouveia N, Eusebio M, Ramiro S, Machado PM, et al. Prevalence of rheumatic and musculoskeletal diseases and their impact on health-related quality of life, physical function and mental health in Portugal: results from EpiReumaPt- a national health survey. RMD Open. 2016;2:e000166.
16. World Health Organization. Physical status: the use and interpretation of anthropometry report of a WHO Expert Committee. WHO Technical Report Series 854. Geneve: WHO; 1995.
17. Diederichs C, Berger K, Bartels DB. The measurement of multiple chronic diseases – a systematic review on existing multimorbidity índices. J Gerontol. 2011;66A:301-11.
18. Ferreira LN, Ferreira PL, Pereira LN, Oppe M. EQ-5D Portuguese population norms. Qual Life Res. 2014;23:425-30.
19. Ferreira LN, Ferreira PL, Pereira LN, Oppe M. The valuation of the EQ-5D in Portugal. Qual Life Res. 2014;23:413-23.
20. Fries JF, Spitz P, Kraines RG, Holman HR. Measurement of patient outcome in arthritis. Arthritis Rheum. 1980;23:137-45.
21. Pais-Ribeiro J, Silva I, Ferreira T, Martins A, Meneses R, Baltar M. Validation study of a Portuguese version of the Hospital Anxiety and Depression Scale. Psychol Health Med. 2007;12:225-35.
22. Gregorio MJ, Rodrigues AM, Eusebio M, Sousa RD, Dias S, Andre B, et al. Dietary patterns characterized by high meat consumption are associated with other unhealthy life styles and depression symptoms. Front Nutr. 2017;4:25.
23. Gouveia N, Rodrigues AM, Ramiro S, Machado P, da Costa LP, Mourao AF, et al. EpiReumaPt: how to perform a national population based
study - a practical guide. Acta Reumatol Port. 2015;40:128-36. 24. World Medical Association. World medical association declaration
of Helsinki ethical principles for medical research involving human subjects. JAMA. 2013;310:2191–4.
25. PORDATA - Base de Dados Portugal Contemporrâneo. Esperança de vida à nascença: total e por sexo - Europa. [accessed 2017 Sep 20]. Available from: https://www.pordata.pt/Europa/ Esperança+de+vida+à+nascença+total+e+por+sexo-1260.
26. EUROSTAT. News release: Living conditions in 2008. Luxembourg: Eurostat Press Office; 2010.
27. Rodrigues CF, Andrade I. Ageing and poverty: how older Portuguese adults became less poor in the noughties. Eur J Ageing. 2014;11:285-92.
28. EUROSTAT. An ageing society — focus on the elderly “of the flagship publication“ people in the EU: who are we and how do we live?”. Luxembourg: Eurostat; 2015.
29. Luanaigh CO, Lawlor BA. Loneliness and the health of older people. Int J Geriatr Psychiatry. 2008;23:1213-21.
30. Tsunoda H, Min JW, Piwowarski M, Hong MY. Health status of a low socioeconomic elderly population that participates in a community senior meal program (1026.4). The FASEB Journal. 2014;28.
31. Chen CX, Feng LN, Li SX. The correlation between socioeconomic status and health self-management in the elderly. Int J Nurs Sci. 2014;1:410-5.
32. Salive ME. Multimordbidity in older adults. Epidemiol Rev. 2013;35:75-83.
33. Martín U, Esnaola S. Changes in social inequalities in disability-free life expectancy in Southern Europe: the case of the Basque Country. Int J Equity Health. 2014;13:74.
34. Booth JN, Li J, Zhang L, Chen L, Muntner P, Egan B. Trends in prehypertension and hypertension risk factors in US adults 1999–2012. Hypertension. 2017;70:275-84.
35. GBD 2016 Causes of Death Collaborators. Global, regional, and national age-sex specific mortality for 264 causes of death, 1980-2016: a systematic analysis for the Global Burden of Disease Study 2016. Lancet. 2017;390:1151-210.
36. Beard JR, Officer A, de Carvalho IA, Sadana R, Pot AM, Michel JP, et al. The World report on ageing and health: a policy framework for healthy ageing. Lancet. 2016;387:2145-54.
37. Mangen MJ, Bolkenbaas M, Huijts SM, Werkhoven CH, Bonten MJ, Wit GA. Quality of life in community-dwelling Dutch elderly measured by EQ-5D-3L. Health Qual Life Outcomes. 2017;15:3.
38. McCaffrey N, Kaambwa B, Currow DC, Ratcliffe J. Health-related quality of life measured using the EQ-5D–5L: South Australian population norms. Health Qual Life Outcomes. 2016;14:133.
39. de Groot LC, Verheijden MW, de Henauw S, Schroll M, van Staveren WA. Lifestyle, nutritional status, health, and mortality in elderly people across Europe: a review of the longitudinal results of the SENECA study. J Gerontol A Biol Sci Med Sci. 2004;59:1277-84.
40. Diaz KM, Howard VJ, Hutto B, Colabianchi N, Vena JE, Safford MM, et al. Patterns of sedentary behavior and mortality in U.S. middle-aged and older adults. A national cohort study. Ann Intern Med. 2017;167:465-75. 41. Andre B, Canhao H, Espnes GA, Ferreira Rodrigues AM, Gregorio MJ,
Nguyen C, et al. Is there an association between food patterns and life satisfaction among Norway’s inhabitants ages 65 years and older? Appetite. 2017;110:108-15.
42. Richter A, Heidemann C, Schulze MB, Roosen ST, Mensink GB. Dietary patterns of adolescents in Germany—associations with nutrient intake and other health related lifestyle characteristics. BMC Pediatr. 2012;12. 43. Lopes C, Torres D, Oliveira A, Severo M, Alarcão V, Guiomar S, et al.
Inquérito Alimentar Nacional e de Atividade Física (IAN-AF 2015-2016) - Relatório Parte II. Porto: Universidade do Porto; 2017.
44. Hickson M. Malnutrition and ageing. Postgrad Med J. 2006;82:2-8. 45. Andersen R, Newman JF. Societal and individual determinants of medical
care utilization in the United States. Milbank Q. 2005;83:10.1111/j.1468-0009.2005.00428.x.