Carina Marisa dos Santos Almeida
Licenciada em Bioquímica
Gold nanoparticle
-
DNA conjugates for
oligonucleotide vectorization towards
gene silencing
Dissertação para obtenção do Grau de Mestre em
Genética Molecular e Biomedicina
Orientador: Prof. Doutor Pedro V. Baptista, Prof. Auxiliar, FCT-UNL
Júri:
Presidente: Prof. Doutor José Paulo Nunes de Sousa Sampaio Arguente: Prof. Doutora Susana Isabel Rodrigues dos Santos
Vogal: Prof. Doutor Pedro Miguel Ribeiro Viana Baptista
Gold nanoparticle-DNA conjugates for oligonucleotide vectorization towards gene silencing
Copyright Carina Marisa dos Santos Almeida, FCT/UNL, UNL
I
Resumo
O principal objectivo do trabalho apresentado nesta tese foi desenvolver um sistema de silenciamento génico usufruindo da capacidade de nanovectorização e propriedades ópticas das nanopartículas de ouro. A ideia baseia-se na construção de uma estrutura de DNA que contém um oligonucleotídeo terapêutico com capacidade de formar ligações de hidrogénio Hoogsteen com uma cadeia dupla de DNA, produzindo uma hélice tripla de DNA, para além de silenciar o gene de interesse. As ligações Hoogsteen, mais instáveis que as Watson-Crick convencionais, permitem alcançar temperaturas de melting mais baixas. Esta característica, aliada à capacidade de gerar calor
através de irradiação com um laser nas nanopartículas de ouro utilizadas, vai permitir a libertação do oligonucleotídeo terapêutico e posterior silenciamento do gene de interesse sem aumento significativo da temperatura do meio. Assim, a tese apresenta três grandes secções: desenho e formação da estrutura de DNA, vectorização e silenciamento da expressão génica; as tarefas envolvidas nas diferentes secções foram efectuadas em paralelo.
O desenho da estrutura obtida teve em consideração a temperatura de melting desejável;
estabilidade a condições fisiológicas dos nucleótidos formadores da sequência, número de ligações Hoogsteen e condições iónicas. Para avaliar a formação desta estrutura foram principalmente utilizadas técnicas de espectroscopia: análise de FRET e curvas de melting no ultra-violeta. Ambas as
abordagens permitiram identificar interacções na presença do oligonucleotídeo terapêutico face à sua ausência, que poderão indicar a formação da estrutura. Para além disso, as curvas de melting
permitiram a determinação da temperatura de libertação deste oligonucleotídeo – 40ºC. A funcionalização de DNA em dupla cadeia às nanopartículas de ouro foi conseguida, mas não se observaram diferenças na migração electroforética quando os três oligonucleotídeos estavam presentes. Contudo, o oligonucleotídeo terapêutico demonstrou capacidade de inibição eficiente da expressão génica em ensaios de transcrição e tradução in vitro com uma eficiência até 95% e 60%,
respectivamente.
Palavras-chave: silenciamento génico; DNA antisense; nanopartículas de ouro; hélices triplas de
III
Abstract
The main objective of the work presented in this thesis was to develop a gene silencing system by taking advantage of the nanovectorization capability and optical properties of gold nanoparticles. The idea is based on the construction of a DNA structure containing a therapeutic oligonucleotide with the ability to form Hoogsteen hydrogen bonds with double-stranded DNA, producing a DNA triple helix, besides silencing the gene of interest. Hoogsteen bonds, more unstable than the conventional Watson-Crick bonds, permit the achievement of lower melting temperatures. This attribute, coupled with the ability to generate heat by laser irradiation of the gold nanoparticles used, will allow the release of the therapeutic oligonucleotide and subsequent gene silencing without significant increase in the medium’s temperature. Thus, the thesis comprises three major sections: structure design and formation, vectorization, and gene expression silencing; the tasks involved in each of these sections were conducted in parallel.
The design of the obtained structure took into account the desired melting temperature, stability at physiological conditions of the sequence-forming nucleotides, the number of Hoogsteen bonds and ionic conditions. To evaluate the formation of this structure, spectroscopic techniques were mainly used: FRET analysis and ultraviolet melting curves. Both approaches allowed the identification of interactions in the presence of therapeutic oligonucleotide compared with its absence, which may indicate structure formation. In addition, melting curves allowed the determination of the temperature of release of this oligonucleotide – 40ºC. The double-stranded DNA functionalization to gold nanoparticles has been achieved, but there was no difference in electrophoretic migration when the three oligonucleotides were present. However, the therapeutic oligonucleotide was able to efficiently inhibit gene expression in in vitro transcription and translation assays with efficiency up to 95% and
60% respectively.
V
Table of Contents
Resumo... I Abstract ... III Table of Contents ... V Figure Index ... VII Table Index ... IX Symbols and Notations ... XI
1. Introduction ... 1
1.1. Nanotheranostics ... 1
1.2. Nanotechnology ... 1
1.2.1. Optical properties ... 2
1.2.2. Therapy nanovectorization ... 3
1.3. Cancer therapy ... 4
1.4. Gene silencing ... 4
1.5. DNA triple helices ... 6
1.6. Objectives ... 8
2. Materials and Methods ... 11
2.1. General information ... 11
2.2. DNA structure formation and assessment ... 11
2.2.1. FRET analysis ... 11
2.2.2. Melting profile ... 12
2.3. Synthesis of colloidal AuNPs (adapted from Lee and Meisel, 1982) ... 12
2.4. Synthesis of dsDNA-AuNP conjugates ... 13
2.4.1. Incubation of AuNPs and dsDNA (adapted from Sato et al. 2003) ... 13
2.4.2. Salt-aging method (adapted from Hurst et al., 2006) ... 13
2.5. Determination of dsDNA-AuNPs hybridization efficiency (adapted from Demers et al., 2000) 14 2.6. Quantitation of thiol-modified oligonucleotides loaded on AuNPs (adapted from Sato et al., 2003) ... 14
2.7. T7-cMYC-fusion fragment amplification by Polymerase Chain Reaction (PCR) ... 14
2.8. Inhibition of in vitro transcription ... 15
2.9. Inhibition of in vitro translation ... 15
3. Results and Discussion ... 17
3.1. Structure design and formation ... 17
3.1.1. Structure design ... 17
3.1.2. Structure formation assessment ... 19
3.1.2.1. FRET analysis ... 19
3.1.2.2. Melting profiles ... 24
3.2. Vectorization ... 25
3.2.1. DNA-AuNP conjugates synthesis and characterization ... 25
3.2.2. Triple stranded DNA (tsDNA)-AuNPs formation assessment ... 31
3.2.3. Theoretical calculation of laser intensity to triple strand delivery from AuNPs ... 31
3.3. Silencing gene expression ... 32
3.3.1. Inhibition of in vitro transcription via antisense DNA ... 32
3.3.2. Inhibition of in vitro translation via antisense DNA ... 35
4. Conclusion ... 37
5. References ... 39
VII
Figure Index
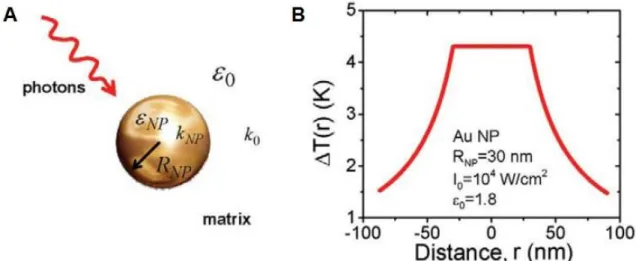
Figure 1.1 – A) Scheme of an optically driven spherical nanoparticle. B) Temperature increase for a
single AuNP as a function of the distance from its center and with water as surrounding medium. ... 2
Figure 1.2 – The siRNA pathway in mammalian cells (adapted from de Fougerolles et al., 2007). ... 5
Figure 1.3 – Motifs in triplex DNA formation and hydrogen bonding ... 7
Figure 1.4 – Schematic representation of the project ... 9
Figure 2.1 – Absorption and emission spectra of FAM and JOE. ... 12
Figure 3.1 – Triplex DNA structure with 17 nucleotides forming Hoogsteen hydrogen bonds (T17 structure)... 19
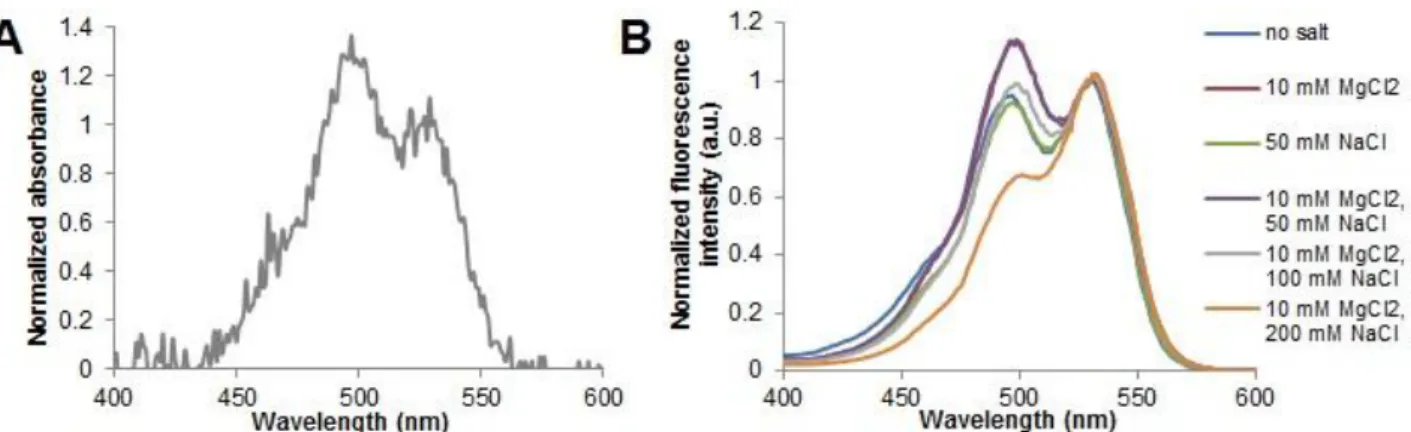
Figure 3.2 –Emission spectra (λexc = 490 nm) of structure T17 in 10 mM Tris-HCl (pH 7.6) and different concentration of MgCl2 and/or NaCl at 15ºC ... 21
Figure 3.3 – T17 structure formation assessment by comparison between A) absorption spectrum of the mixture and B) excitation spectra (λem = 640 nm) at different concentrations of MgCl2 and/or NaCl ... 22
Figure 3.4 –Emission spectra (λexc = 490 nm) of structure T17 in 10 mM Tris-HCl (pH 7.6) and different concentration of MnCl2 and/or NaCl at 15ºC ... 23
Figure 3.5 – Melting profiles followed by absorption at 260 nm in 10 mM Tris-HCl and 10 mM MgCl2 24 Figure 3.6 – Scheme of AuNP conjugates ... 25
Figure 3.7 – Emission spectrum of the dsDNA-AuNP conjugates measured at an excitation wavelength of 490 nm and at 20ºC ... 28
Figure 3.8 – Double helix of T17 structure conjugated to AuNPs melting temperature determination by the area of fluorescence intensity spectra of 2T17_5’JOE at increasing pH (grey dots) and by absorbance at 260 nm of the double helix (black line) in 10 mM sodium phosphate buffer (pH 8.0) ... 30
Figure 3.9 – Electrophoretic analysis of conjugates in 1% agarose ... 31
Figure 3.10 – Strategy for silencing gene expression using antisense oligonucleotides ... 32
Figure 3.11 – Inhibition of in vitro transcription via antisense oligonucleotides ... 33
Figure 3.12 – Inhibition of in vitro translation... 35
Figure A.1 – 12% non‐denaturing PAGE in 17.8 mM Tris-borate (pH 7.2) and 10 mM MgCl2 ... 47
Figure A.2 –Emission spectra (λexc = 490 nm) of double helix of T17 structure (1T17 and 2T17_5’FAM) and labeled non-TFO in 10 mM Tris-HCl (pH 7.6) and different ionic conditions. ... 49
Figure A.3 –Excitation spectra (λem = 640 nm) in 10 mM Tris-HCl (pH 7.6) and different concentrations of MgCl2 and/or NaCl. ... 49
Figure A.4 – Schematic representation of emission and excitation spectra ... 50
Figure A.5 – Gold nanoparticles ... 52
Figure A.6 – Visible spectra of AuNPs functionalized with different concentrations of PEG ... 53
Figure A.7 – Calibration curve for quantification of 2T17_5’JOE oligonucleotide. ... 54
Figure A.8 –Calibration curve for quantification of 1T17_5’thiol_3’FAM oligonucleotide. ... 55
Figure A.9 – Temperature increase according to the distance from the AuNP surface when a 532 nm laser wavelength with an intensity of 3x10⁵ W/cm2 is used ... 57
Figure A.10 – 2% agarose gel of inhibition of in vitro transcription without pre-hybridization of DNA template and inhibitory oligonucleotides (T7 antisense and 3T17_T7) ... 58
IX
Table Index
Table 2.1 – Unmodified and modified DNA oligonucleotides and their melting temperatures (Tm)
according to the nearest neighbor model. ... 11
Table 3.1 – Summary of the methods attempted for dsDNA functionalization to AuNPs. ... 26
Table 3.2 - Quantification of AuNPs’ surface functionalized oligonucleotides. ... 29
Table A.1 – Intensity measured at 550 nm upon excitation of the samples at 520 nm ... 54
Table A.2 – Intensity measured at 520 nm upon excitation of the samples at 490 nm ... 55
XI
Symbols and Notations
ε – extinction coefficient
λem– emission wavelength
λexc– excitation wavelength
Φf – fluorescence quantum yield
A – adenine
AuNP – gold nanoparticle C – cytosine
DNA – deoxyribonucleic acid DNase – deoxyribonuclease dsDNA – double strand DNA dsRNA – double strand RNA DTT – dithiothreitol
FAM – 6-carboxyfluorescein
FRET – Förster resonance energy transfer G – guanine
GFP – green fluorescent protein
JOE – 6-carboxy-4′,5′-dichloro-2′,7′-dimethoxyfluorescein LSPR – localized surface plasmon resonance
mRNA – messenger RNA
MYC – human v-myc myelocytomatosis viral oncogene homolog NP – nanoparticle
PAGE – polyacrylamide gel electrophoresis PCR – polymerase chain reaction
PEG – polyethylene glycol RBS – ribosome binding site
RISC – RNA-induced silencing complex RNA – ribonucleic acid
RNAi – RNA interference RNase – ribonuclease
siRNA – small interfering RNA SPR – surface plasmon resonance ssDNA – single strand DNA T – timine
TEM – transmission electron microscopy TFO – triplex-forming oligonucleotide Tm– melting temperature
1
1. Introduction
The work here presented, although solely focused on gene therapy, is a small part of a larger project whose central focus is on nanotheranostics.
1.1. Nanotheranostics
Theranostics is the combination of real-time diagnotics with delivery of medication (Prigodich et al.,
2009; Ho and Leong, 2010; Lukianova-Hleb et al., 2010; Xie et al., 2010) and aims to make a
treatment shorter, safer and more efficient through selective targeting of specific (diseased) tissues or cells. However, the initial phase of the development of theranostics has already revealed two main challenges: (i) lack of multifunctional methods and agents; and (ii) deficient selectivity and specificity of available agents (Lukianova-Hleb et al., 2010).
Over the last decade, several multifunctional approaches have been employed as theranostic agents, such as: fluorescent dyes, capsule-type sytems (liposomes, micelles, polyelectrolyte and polymer capsules) and nanotechnological materials (especially nanoparticles; NPs). Taking advantage of the potential of certain materials at the nanometer scale, and hence of nanotechnology, appears to be the most advantageous and effective approach for the combination of diagnosis and therapy in a single system. Several reports of the use of nanotechnology for application in theranostics (nanotheranostics or theranostic nanomedicine) have already been presented (Bagalkot et al., 2007;
Medarova et al., 2007; Park et al., 2008; Yezhelyev et al., 2008; Prigodich et al., 2009; Ho and Leong,
2010; Lukianova-Hleb et al., 2010).
1.2. Nanotechnology
Nanotechnology is a multidisciplinary scientific field that involves the study, creation and control of matter on the nanometer (one billionth of a meter) scale.
Since the discovery of their quantum size effects, biomedical applications and methods of manufacturing, NPs are one of the most explored and employed class of nanomaterials (Salata, 2004; Kotov and Stellacci, 2008). NPs can be composed of one or more inorganic compounds such as noble metals, heavy metals, iron, etc. (Niemeyer and Mirkin, 2004). In particular, noble metal NPs have been attracting much interest due to their simplicity, versatility, easily tunable physicochemical properties and high surface areas which make them suitable for many biological applications (Baptista et al.,
2008; Wilson, 2008). These properties are mainly dependent on their size, shape and composition (Su
et al., 2003).
Among noble metal NPs, gold nanoparticles (AuNPs) have been subject of extensive researchand, in the last years, led to the development of a myriad of techniques and methods for diagnostics, imaging, drug delivery and therapeutics (Hu et al., 2006; Baptista et al., 2008; Sperling et al., 2008;
2
1.2.1. Optical properties
One of the most studied properties of AuNPs is their interaction with light. The free surface electrons of the AuNP undergo a collective coherent oscillation on its surface when in the presence of the electromagnetic waves of the light. At a particular frequency of the light, this process is resonant and is termed the localized surface plasmon resonance (LSPR) oscillation (Eustis and El-Sayed, 2006). The LSPR frequency for spherical AuNPs with diameters between 10-100 nm lies in the visible region of the electromagnetic spectrum (Jain et al., 2007) due to the similar quantum confinement of
the nanoparticle for the oscillating electrons and the incident radiation wavelength (El-Sayed, 2001). The LSPR can be tuned by modification of the nanostructure size, shape, composition or the dielectric constant of the surrounding medium (Jain et al., 2006; P.K. Jain et al., 2008) in order to suit the
biomedical application.
Plasmon oscillations in a NP can either decay by radiating its energy resulting in light scattering, or non-radiatively as heat (P.K. Jain et al., 2008). Only the latter mechanism of dissipation is covered
under the scope of this work.
AuNPs are thought to generate heat by light activation and these heaters are useful for applications in biomedicine because temperatures above 37ºC lead to fever and temperatures higher than 42ºC are lethal to human cells. The increase in temperature in the vicinity of AuNPs’ surface can be
explained by the optical near-field effect and that increase is a function of the distance from AuNPs’
surface (Govorov et al., 2006; Govorov and Richardson, 2007) as shown in Figure 1.1.
Figure 1.1 – A) Scheme of an optically driven spherical nanoparticle. B) Temperature increase for a single AuNP as a function of the distance from its center and with water as surrounding medium. εNP and ε0 are the dielectric constants of the NP and surrounding medium, respectively; RNP is the NP radius; kNP and k0 are the thermal conductivity of the NP and surrounding medium, respectively; and I0 is the light intensity inside the matrix (Govorov and Richardson, 2007).
3
of frequency overlapping the LSPR absorption maximum, the absorbed light is rapidly converted into heat and there is a selective heating and destruction of cancer cells at much lower laser powers than those required to destroy healthy cells to which nanoparticles do not bind specifically (P.K. Jain et al.,
2008; Boisselier and Astruc, 2009).
Photothermal therapy using AuNPs requires much lower laser energies than conventional dyes due to AuNPs’ 5-fold higher absorption coefficients, which make them minimally invasive (Chen et al.,
2008; P.K. Jain et al., 2008). While the use of visible light resonant AuNPs can be useful for external
skin/surface cancer treatments (Huang and El-Sayed, 2010), for tumors within bodily tissue, it becomes necessary to use near-infrared light in the biological window (Hu et al., 2006; P.K. Jain et al.,
2008; Boisselier and Astruc, 2009).
Although photothermolysis is the most common application of nanotechnology for cancer therapy, one can use this property to achieve the displacement of therapeutic moieties functionalized to the
NPs’ surface and achieve a therapeutic action by means of gene silencing (Huschka et al., 2010;
Poon et al., 2010).
1.2.2. Therapy nanovectorization
Therapeutic vectors may carry drugs, genes and imaging agents into living cells and tissues. Over the years, several different vehicles for delivery have been designed based on different nanomaterials, such as polymers, dendrimers, liposomes, nanotubes, nanorods, etc (Ghosh et al., 2008). The use of
nanovectors allows the specific delivery of large amounts of therapeutic agents per targeting biorecognition event, constituting a major clinical advantage of this approach. Moreover, nanovectors are capable of reducing the clearance time of therapeutic agents and provide protection against enzymatic degradation (Ferrari, 2005). AuNPs provide excellent characteristics for nanovectorization of drug molecules or large biomolecules (e.g. proteins or nucleic acids) due to their high surface/volume ratio and ease of functionalization via conventional and/or simple processes. Also, gold is essentially inert and non-toxic (Murphy et al., 2008).
The delivery of therapeutic nucleic acids appears to be very promising. An ideal vector must possess the following properties: easy production; ability to express its genetic cargo over a sustained period; immunologically inert; tissue/cell-specific; ability to infect dividing and non-diving cells; no size limit to the genetic material it can deliver (Somia and Verma, 2000). Hitherto, most gene therapies have been based on viral vectors because viruses have the mechanisms to transfer their DNA into host cells, making them ideal for delivering external genetic material into tumor cells. However, the use of common viral vectors raises cytotoxicity and adverse immune responses in humans (Waehler
et al., 2007; Boisselier and Astruc, 2009).
AuNPs can be used as synthetic delivery vectors that have already proven successful in delivering large biomolecules such as peptides, proteins, and nucleic acids, and unlike viruses, AuNPs are inert to the organism, although less efficient than viral vectors (Ghosh et al., 2008).
Delivery of DNA by means of AuNPs has been developed first by Rotello’s group using cationic
4
transfection (Ghosh et al., 2008). Rosi et al. have conjugated AuNPs with negatively-charged
oligodeoxynucleotides using antisense oligonucleotides (Rosi et al., 2006) and AuNPs conjugated with
siRNA (Giljohann et al., 2009) for gene therapy. Rotello et al. also reported another approach to gene
delivery by means of AuNPs-directed photorelease of oligonucleotides where, upon ultraviolet (UV) irradiation within the cells, DNA is released from AuNPs resulting in a high level of DNA-transcription recovery in vitro, and with significant nuclear localization of the DNA in cells (Han et al., 2006).
In the last years, the use of NPs for photothermal therapy (see section 1.2.1) and/or as suitable vehicles to act as vectorization platforms (see section 1.2.2) has raised much interest in the treatment and/or prevention of cancer (Cheng et al., 2009; Bardhan et al., 2011; Gianella et al., 2011; Ke et al.,
2011; Melancon et al., 2011). This is due to the enhanced permeability of tumor vasculature and
cancer markers that facilitate retention of NPs within a tumor coupled with the increasing burden of this disease worldwide.
1.3. Cancer therapy
Cancer is among the major causes of mortality in the developed world, and the worldwide incidence continues to increase. The mainstay of treatment for cancer is surgery, radiation, chemotherapy, antibody-blocking therapy, or a combination of these therapies. These methods are invasive (e.g. surgery) and/or hazardous due to lack of selectivity to cancerous cells or tissue (e.g. chemotherapy, radiotherapy). Although cancer treatment is improving and extending survival rate for people with cancers at many sites, there is a need to reduce the impact of highly toxic agents to healthy tissue. Also, the poor bioavailability seriously compromises the therapeutic efficacy of many otherwise beneficial drugs (Chen et al., 2008). These treatments also inhibit growth and development
of blood cell lineages, ultimately leading to increased susceptibilities to secondary infections.
To surmount at least some of these challenges, alternative non-invasive and selective methods are being exploited and developed. In particular, gene therapy is receiving increasing attention and could represent an attractive approach for novel treatment and/or prevention of cancer by the controlled introduction of therapeutic nucleic acids into target cells in order to block the expression of specific genes. Gene expression can be regulated at either the transcriptional or post-transcriptional level. At the transcriptional stage, oligonucleotides must enter the nucleus of a cell and specifically bind to the RNA polymerase promoter of double-stranded genomic DNA to form triple helices that prevent transcription (Tamm et al., 2001; Patil et al., 2005; Rayburn and Zhang, 2008). At the
post-transcriptional level, antisense oligonucleotides and small interfering RNA (siRNA) are available for the sequence-specific gene silencing.
1.4. Gene silencing
5
RNAi machinery can be exploited to silence nearly any gene, giving it a broad therapeutic potential (Whitehead et al., 2009).
The general mechanism of RNAi is triggered by the presence of long pieces of dsRNA and involves the cleavage of these molecules into regulatory molecules of twenty-one to twenty-three bases with
short (two base) protruding 3’-ends by Dicer. In practice, siRNA can be synthetically produced and then directly introduced into the cell, thus circumventing Dicer mechanics.
Once siRNA is present in the cytoplasm of the cell, it is incorporated into a ribonuclear protein complex known as the RNA-induced silencing complex (RISC). Within the RISC complex exists a member of the Argonaute protein family (in mammalian cells, the protein is Ago2) which unwinds the siRNA. The activated RISC, which contains the antisense strand of the siRNA as a template (the sense strand is cleaved), selectively degrades mRNA that is complementary to the antisense strand (Hammond et al., 2001; Hannon and Rossi, 2004; Meister and Tuschl, 2004; De Paula et al., 2007;
Whitehead et al., 2009; Kim et al., 2005). The homologous mRNA, upon binding to RISC, is cleaved
between bases 10 and 11 relative to the 5′-end. The activated RISC complex can then undergo numerous cycles of mRNA cleavage, which further propagates gene silencing (De Paula et al., 2007;
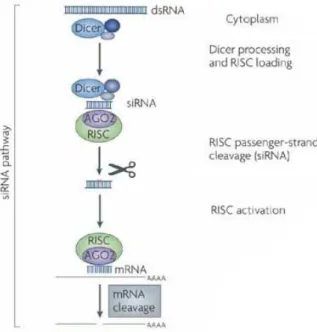
Whitehead et al., 2009). A schematic representation of the siRNA pathway is depicted in Figure 1.2.
Figure 1.2 – The siRNA pathway in mammalian cells (adapted from de Fougerolles et al., 2007). dsRNA is
cleaved into siRNAs by Dicer. These fragments are then incorporated in RISC, which becomes activated by the presence of the antisense strand of the siRNA. This complex is capable of mRNA degradation complementary to the antisense strand of siRNA.
Antisense silencing is based on single-stranded oligonucleotide sequences that are specifically designed to hybridize to corresponding mRNA and inhibit its function by modulation of splicing or disruption of ribosome assembly (Tamm et al., 2001; Patil et al., 2005). Therefore, there is a potential
6
Antisense oligonucleotides and siRNA show significant potential in new molecular approaches to down-regulate specific gene expression in cancer. However, there are still significant obstacles to be overcome before their use as anticancer agents in clinical applications. Naked oligonucleotides show extremely short half-lives (seconds to minutes) when delivered into the bloodstream due to renal clearance (because of their small size) and to RNase and DNase action. Also, the cellular uptake of naked oligonucleotides is limited (Oliveira et al., 2006; Pirollo and Chang, 2008). Therefore, the
efficiency of these approaches for cancer therapy relies on finding suitable delivery vectors that can be systemically administered to reach both primary and metastatic tumor cells. Several different vectorization approaches have been developed based on nonviral lipids or protein carriers, including cholesterol, liposomes, antibody protomer fusions, cyclodextrin nanoparticles, fusogenic peptides, aptamers, biodegradable polylactide copolymers, and polymers (Pirollo and Chang, 2008). Positively charged cationic liposomes and polymers, such as polyethyleneimine, are currently the two major carriers used to complex with negatively charged oligonucleotides for systemic delivery (Oliveira et al.,
2006; De Paula et al., 2007).
1.5. DNA triple helices
The DNA double strand is formed by two complementary strands, where an adenine (A) pairs with
thymine (T) and guanine (G) with cytosine (C) forming A•T and G•C base pairs through Watson-Crick hydrogen bonds. However, in the DNA major groove, acceptor and donor groups are spatially available to form hydrogen bond interactions with a third external strand. The hydrogen bond interactions involved in triple-helix formation are a less stable hydrogen-bonding pattern, referred to as Hoogsteen hydrogen bonds (Chan and Glazer, 1997; Duca et al., 2008).
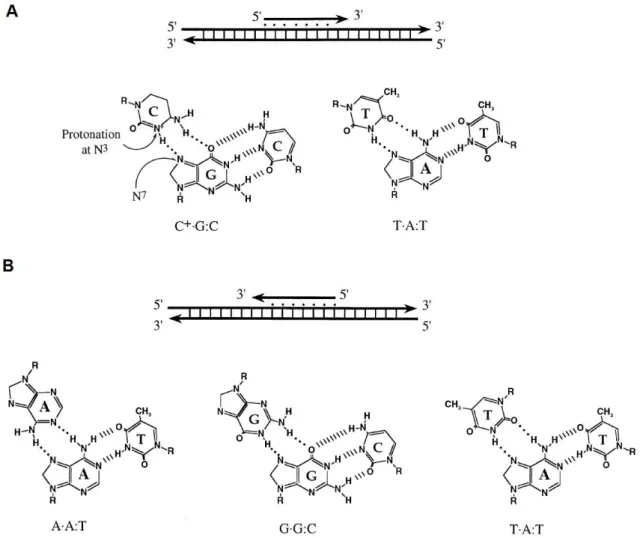
There are several requisites for triplex formation – it occurs when a DNA or RNA oligonucleotide binds specifically to the major groove of a homopurine region of DNA. A triplex-forming oligonucleotide (TFO) can be categorized in either the pyrimidine or purine motif, depending on its base composition and binding orientation relative to its DNA target site.
A TFO formed by C and T binds parallel to the purine-rich strand of DNA via Hoogsteen bonds in a pyrimidine motif. Ts belonging to the third strand bind to A in A:T basepairs and protonated Cs (C+) bind to G in G:C+ basepairs. Because the protonation at N3 of C is required for proper Hoogsteen bonding with N7 of G, the pyrimidine motifs occur only under acidic conditions (pH < 6). This imposes a limitation to the use of pyrimidine oligonucleotides at physiologic pH without further modification (Chan and Glazer, 1997; Duca et al., 2008).
In the purine motif, the TFO consists of As and Gs which bind to the purine-rich strand of DNA by A:T, G:C and A:A Hoogsteen hydrogen basepairs. These TFOs bind antiparallel to the purine-rich strand in DNA and unlike the pyrimidine motif, the purine motif requires no base protonation and exhibits pH independent binding (Chan and Glazer, 1997; Duca et al., 2008). Figure 1.3 shows these
7
Figure 1.3 – Motifs in triplex DNA formation and hydrogen bonding. A) Pyrimidine binding motif. Above:
binding of a TFO in a parallel orientation to a polypurine strand of DNA; Below: the two canonical base triplets of this motif. B) Purine binding motif. Above: binding of a TFO to the polypurine strand of DNA in an antiparallel
orientation; Below: three canonical base triplets in this motif. · represent Hoogsteen hydrogen bonds; | represent
Watson-Crick hydrogen bonds (adapted from Chan and Glazer, 1997).
The affinity to which a TFO binds to a polypurine site depends on the TFO sequence: purine motifs must generally be G-rich (>65%) to form stable triplexes; for the pyrimidine motif, a high percentage of Cs appears to be destabilizing. The presence of divalent cations such as Mg2+, Ca2+ and Zn2+ stabilize both purine and pyrimidine motifs (Chan and Glazer, 1997; Wu et al., 2002). Spermine, spermidine
and putrescine are naturally occurring polyamines that also improve the stability of triple helices. These agents reduce the electrostatic repulsive forces between the negatively charged phosphate backbones of the three strands, allowing triplex DNA to form more readily (Chan and Glazer, 1997).
To overcome the lack of stability, base analogs can be introduced, the sugar moiety modified, as well as the backbone or chemical substances, known to enhance the formation of triplex DNA (Knauert and Glazer, 2001; Duca et al., 2008; A. Jain et al., 2008), can be used.
8
1.6. Objectives
The work here presented focus on the use of AuNPs as nanovectors for gene silencing. In order to achieve the silencing, suitable single-stranded oligonucleotides (ssDNA) and/or siRNA are aimed to be entrapped in specifically designed tertiary nucleic acid structures that are further functionalized to the AuNPs’ surface. The entrapment will be accomplished by Hoogsteen hydrogen bonds between a
trapping double helix DNA structure and part of the effector ssDNA and/or siRNA, forming a triple helix of DNA.
The use of a DNA triplex structure will allow for the use of lower laser energies to achieve the melting of the effector strand when compared to simple double stranded constructs. The melting temperature of the third strand from the entrapment oligonucleotide will be designed in such a way to be released at temperatures just above physiological temperature, i.e., the triplex structure should be stable enough until laser irradiation, and the laser energy will be low enough to prevent damage in the surrounding cells.
In the present work, the delivery of oligonucleotides might be achieved via the release from the trapping molecule through spectral interaction (e.g. near-field effect, thermal effect) with/and between the AuNPs. The AuNPs conjugated with the triplex structure will be irradiated by a laser, increasing the temperature on the surface of the AuNPs. This increase will lead to thermal denaturation of the triplex structures conjugated with the AuNP, releasing the entrapped oligonucleotide within the cell. The naked oligonucleotide will thereafter achieve the silencing of its target (see Figure 1.4 for a schematic representation).
Towards the completion of the referred objectives, the work was planned in the following consecutive tasks:
Design of triplex DNA structures in which a domain of the double-stranded DNA (dsDNA) chain is capable of entrapping a third-strand effector oligonucleotide. The length of the triple helix section will be designed to satisfy the thermal denaturation profiles attained via the near-field effect of AuNPs;
in vitro temperature effect assessment on the release of entrapped oligonucleotides via
Förster resonance energy transfer (FRET) analysis and UV melting profiles; Optimization of silencing conditions for antisense and siRNA approach;
Synthesis of AuNPs and functionalization of the triplex structure onto the AuNPs’ surface;
9
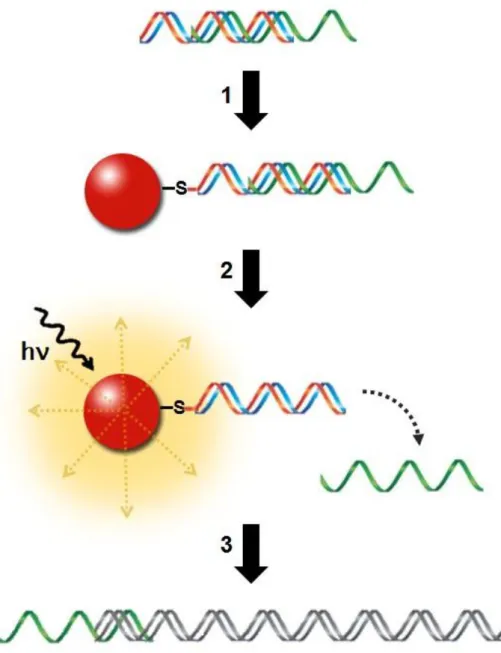
Figure 1.4 – Schematic representation of the project. 1) Functionalization of the triplex DNA structure to
AuNPs via thiol group after previous assessment of triplex structure formation entrapping the therapeutic oligonucleotide (represented in green); 2) Release of the therapeutic oligonucleotide – laser irradiation of AuNPs and consequent thermal denaturation of the third strand; 3) Gene silencing by the released therapeutic
11
2. Materials and Methods
2.1. General information
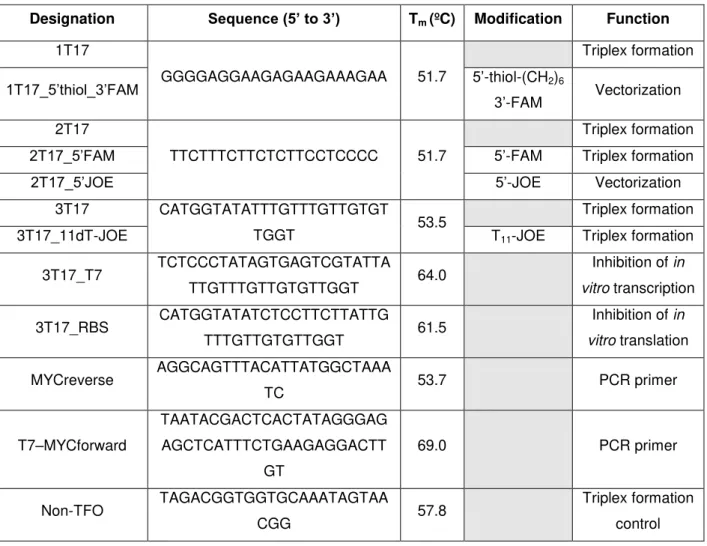
All chemicals were purchased from Sigma-Aldrich in the highest purity available and used without further purification. All synthetic oligonucleotides were purchased from STAB Vida, Lda. (Portugal) and their sequences are shown in Table 2.1.
Table 2.1 – Unmodified and modified DNA oligonucleotides and their melting temperatures (Tm) according
to the nearest neighbor model.
Designation Sequence (5’ to 3’) Tm (ºC) Modification Function
1T17
GGGGAGGAAGAGAAGAAAGAA 51.7
Triplex formation
1T17_5’thiol_3’FAM 5’-thiol-(CH2)6
3’-FAM Vectorization
2T17
TTCTTTCTTCTCTTCCTCCCC 51.7
Triplex formation
2T17_5’FAM 5’-FAM Triplex formation
2T17_5’JOE 5’-JOE Vectorization
3T17 CATGGTATATTTGTTTGTTGTGT
TGGT 53.5
Triplex formation
3T17_11dT-JOE T11-JOE Triplex formation
3T17_T7 TCTCCCTATAGTGAGTCGTATTA
TTGTTTGTTGTGTTGGT 64.0
Inhibition of in vitro transcription
3T17_RBS CATGGTATATCTCCTTCTTATTG
TTTGTTGTGTTGGT 61.5
Inhibition of in vitro translation
MYCreverse AGGCAGTTTACATTATGGCTAAA
TC 53.7 PCR primer
T7–MYCforward
TAATACGACTCACTATAGGGAG AGCTCATTTCTGAAGAGGACTT
GT
69.0 PCR primer
Non-TFO TAGACGGTGGTGCAAATAGTAA
CGG 57.8
Triplex formation control
2.2. DNA structure formation and assessment
2.2.1. FRET analysis
T17 structure (vide Figure 3.1) formation was attempted in a binding buffer (10 mM Tris-HCl, pH
7.6; TE 1x, pH 7.0; or 10 mM sodium phosphate, pH 7.4) with certain concentrations of MgCl2 or
MnCl2 and/or NaCl and the concentration of each oligonucleotide (1T17, 2T17_5’FAM and
-12
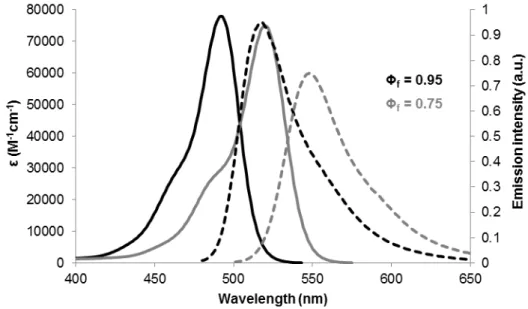
JOE) are labeled with one fluorophore each: FAM and JOE, respectively, whose emission and absorption spectra and quantum yields are shown in Figure 2.1.
Figure 2.1 – Absorption and emission spectra of FAM and JOE. Black lines correspond to FAM and grey lines
to JOE. Absorption spectra are represented by solid lines normalized to the extinction coefficients (ε) and emission spectra are represented by the dashed lines normalized to the fluorescence quantum yields (Φf).
Oligonucleotides were denatured for 10 min at 80ºC followed by gradual cooling to 4ºC at a rate of 0.1ºC/min. The experiments were performed at 15ºC in order to guarantee that a triplex can be formed if the necessary requirements are met. Emission and excitation spectra were measured using a fluorescence spectrophotometer Cary Eclipse with Peltier thermostat accessory (Varian, USA). The
excitation wavelength (λexc) of FAM was set to 490 nm and the emission intensity was scanned
between 500 and 700 nm. To record the excitation spectra, the emission wavelength (λem) was set to
640 nm and the intensity between 400 and 650 nm was recorded. The absorption spectra were measured using a UV-Vis spectrophotometer Evolution 300 with Peltier thermostat accessory (Thermo Scientific, USA).
2.2.2. Melting profile
UV melting curves for T17 structure were recorded in 10 mM Tris-HCl and 10 mM MgCl2 where the
concentration of each oligonucleotide (1T17, 2T17 and 3T17) was set to 2 μM. The melting curve was
recorded at 260 nm from 25 to 85ºC at a scan rate of 1ºC/min using a UV-Vis spectrophotometer Evolution 300 with Peltier thermostat accessory (Thermo Scientific, USA).
2.3. Synthesis of colloidal AuNPs (adapted from Lee and Meisel, 1982)
13
of 38.8 mM sodium citrate was quickly added and the mixture was kept refluxing for 15 min with continuous stirring. The colloidal solution was left to cool to room temperature and stored in the dark until use. AuNPs concentration was determined by the Lambert–Beer law assuming a calculated molar absorptivity for the plasmon resonance band maximum of 2.33×10⁸ M−1cm−1. The average size and morphology of the particles were obtained by analysis of transmission electron microscopy (TEM) images.
2.4. Synthesis of dsDNA-AuNP conjugates
After resuspension of the thiol-modified oligonucleotide (1T17_5’thiol_3’FAM) in 0.1 M dithiothreitol (DTT), one volume was extracted with two volumes of ethyl acetate and the organic phase was discarded after centrifuging for 5 minutes at 21,460 g. This procedure was repeated two more times. The aqueous phase was further purified through a desalting NAP-5 column (GE Healthcare, USA)
according to manufacturer’s instructions, using 10 mM phosphate buffer as eluent. The purified
oligonucleotide was then quantified by UV-visible spectroscopy using the extinction coefficient at 260 nm provided by the manufacturer and subsequently mixed with its complementary sequence
(2T17_5’JOE). The mixture was denatured at 70ºC for 10 min and then allowed to hybridize for 15 min at room temperature.
After these steps, several methods of dsDNA conjugation to AuNPs were employed as described below.
2.4.1. Incubation of AuNPs and dsDNA (adapted from Sato et al. 2003)
The pre-hybridized dsDNA was mixed with a 15 nM AuNPs solution in a 1:100 (AuNP:dsDNA) ratio. After a minimum of 48 hours at room temperature, the functionalized AuNPs were centrifuged at 21,460 g for 20 min. The supernatant was discarded and the resulting oily pellet was washed twice with 10 mM phosphate buffer (pH 8.0) and finally redispersed with the same solution. The final concentration of dsDNA-AuNPs conjugates was determined by the Lambert–Beer law assuming a calculated molar absorptivity for the plasmon resonance band maximum of 2.33×10⁸ M−1cm−1. The
dsDNA-AuNPs conjugates were stored in the dark at 4ºC until further use.
2.4.2. Salt-aging method (adapted from Hurst et al., 2006)
14
and 0.1 M NaCl. The final concentration of dsDNA-AuNPs conjugates was determined by the Lambert–Beer law assuming a calculated molar absorptivity for the plasmon resonance band maximum of 2.33×10⁸ M−1cm−1. The dsDNA-AuNPs conjugates were stored in the dark at 4ºC until further use.
2.5. Determination of dsDNA-AuNPs hybridization efficiency (adapted from Demers et al., 2000)
The dsDNA-AuNPs conjugates (final concentration 5 nM) was denatured using sodium hydroxide
(final concentration of 0.1 M; final pH of 13) in a total volume of 100 μL of 10 mM phosphate buffer (pH
8.0) and let to incubate for 2 h at room temperature. The calibration curve was generated by preparing a sequential dilution of the JOE-modified oligonucleotide (2T17_5’JOE; concentration range: 0.01 –
0.5 μM) under the same conditions as the samples.
The samples were then centrifuged at 21,460 g for 20 min and the supernatant was removed to measure the fluorescence emission of the sample in a Cary Eclipse with Peltier thermostat accessory (Varian, USA). Sample’s fluorescence emission was converted to molar concentrations by
interpolation from the standard linear calibration curve.
2.6. Quantitation of thiol-modified oligonucleotides loaded on AuNPs (adapted from Sato et al., 2003)
Thiol- and FAM-modified oligonucleotides (1T17_5’thiol_3’FAM) were displaced from the AuNPs’ surface via addition of DTT (final concentration of 100 mM) or β-mercaptoethanol (final concentration of 12 mM) to 5 nM dsDNA-AuNPs conjugates (pellet obtain in the assay described in 2.5) in a total
volume of 100 μL. Standard solutions were prepared by sequentially diluting (concentration range:
0.01 – 0.5 μM) the thiol- and FAM-modified oligonucleotide (1T17_5’thiol_3’FAM) under the same
conditions as the samples. After 48 hours at room temperature, samples were centrifuged at 21,460 g for 20 minutes and then, the supernatant was used to quantify the thiol-modified oligonucleotides in
solution by measuring the fluorescence intensity. Sample’s fluorescence emission was converted to molar concentrations by interpolation from the standard linear calibration curve.
2.7. T7-cMYC-fusion fragment amplification by Polymerase Chain Reaction (PCR)
A 252 bp fragment harboring the 23 bp T7 promoter sequence and a 229 bp fragment of the human v-myc myelocytomatosis viral oncogene homolog (MYC) gene was PCR amplified from pJET1.2 cloning vector (originally with 2974 bp; Fermentas, Vilnius, Lithuania) using the primers T7-MYCforward and MYCreverse (see Table 2.1 for sequences).
PCR amplification was performed on a MyCycler Thermocycler (Biorad) in 25 μL using 0.2 μM of
15
72ºC for 30 s, and a final elongation at 72ºC for 5 min. Purification of the PCR products was performed by 1% agarose gel electrophoresis followed by excision of the respective gel band.
2.8. Inhibition of in vitro transcription
Standard in vitro transcription was performed in a volume of 50 µL containing in vitro transcription
buffer, 10 mM of each NTP, 400 ng of the 252 bp DNA template and with 30 U of T7 RNA polymerase
(Fermentas, Vilnius, Lithuania) according to the manufacturer’s protocol. Reactions were incubated for
2 h at 37ºC, followed by heat inactivation of enzyme for 15 min at 75ºC.
To assess the level of inhibition by the naked oligonucleotides (T7 primer and 3T17_T7), different concentrations of each nucleotide were added to the transcription mixture. All transcription reactions were then evaluated on a 2% agarose gel electrophoresis with GelRed™ (Biotium, USA) incorporation.
Product quantity determination was performed by pixel counting using ImageJ™ imaging software.
Determination of the degree of inhibition was performed after normalizing to the intensity of the positive control (100%) of the in vitro transcription reaction.
2.9. Inhibition of in vitro translation
The pGFP (4235 bp; 5Prime, GmbH, VWR International) encodes the green fluorescent protein (GFP) protein used as template for in vitro protein synthesis reactions. The coupled in vitro
transcription/translation reactions were performed in a Rapid Translation System RTS 100 E. coli HY
Kit (5Prime, GmbH, VWR International). GFP protein was synthesized for 6 h at 30ºC followed by incubation at 4ºC for 24 h for GFP maturation. GFP protein levels were measured using fluorescence spectroscopy (λexc = 395 nm, λem = 510 nm). Assessment of 3T17_RBS olignucleotide influence in
17
3. Results and Discussion
The project comprises three major sections – Structure Design and Formation, Vectorization, and Gene Expression Silencing. Due to their modular nature in the early stages, the three sections were developed in parallel in order to avoid possible bottlenecks. The workflow assumed would also allow for the assessment of strategies initially adopted for each section and input the information gathered in the other sections, for a more efficient integration of acquired knowledge.
3.1. Structure design and formation
3.1.1. Structure design
Several criteria had to be taken into account when designing the aimed DNA structure: - desired melting temperature
- ability of efficient gene silencing
- stability at physiologic pH and ionic conditions
To release a therapeutic DNA strand in vivo through thermal triggering, it is desirable that the
structure’s melting temperature is just above physiologic temperature. Considering that the physiologic
temperature is around 37ºC, the desirable Tm range lays in the 40 to 45ºC interval. Additionally, for an
efficient gene silencing, oligonucleotide strands typically with 18-25 nucleotides (Dallas and Vlassov, 2006) are employed. This would limit the sequence to adenines and timines in Watson and Crick base pairing since, for instance, a polyA of 25 nucleotides has a Tm of approximately 43ºC at low salt
conditions (according to the nearest neighbor model). The use of Hoogsteen hydrogen bonds, and hence the formation of DNA triple helices, overcomes this issue as these bonds present decreased stability when compared with Watson-Crick hydrogen bonds, decreasing release temperature of the therapeutic strand. Triplex formation occurs when an oligonucleotide binds specifically to the major groove of a homopurine region of DNA. Consequently, one of the dsDNA strands has to be homopurinic so Hoogsteen bonds can be formed (Frank-Kamenetskii and Mirkin, 1995; Chan and Glazer, 1997; Duca et al., 2008; Rusling et al., 2009; Fox and Brown, 2011).
To achieve gene silencing in vivo, the structure needs to be stable at physiologic conditions prior to
the therapeutic strand release. Due to their pH-independent binding to DNA, purine motifs of triplex DNA are thought to present significant stability under neutral pH (Chan and Glazer, 1997; A. Jain et al., 2008). In this case, the TFO will bind in an antiparallel manner to a purine-rich strand of DNA. The
use of a pyrimidine motif would require the protonation of cytosines at N3 for proper Hoogsteen bonding to N7 of guanines and therefore an acidic pH (Chan and Glazer, 1997; Duca et al., 2008),
non-compatible with physiologic conditions.
Previous studies suggest that the presence of divalent cations in the medium potentiate the formation of DNA triple helices due to a stability increase (Malkov et al., 1993; Sugimoto et al., 2001;
18
dependent on the valence of the countercations, but also on their ionic radii: in the series of Mg2+, Mn2+, Ca2+ and Ba2+, the stability increases from left to right, which is in agreement with their radii (rMg2 = 0.66 Å, rMn2 = 0.80 Å; rCa2 = 0.99 Å, rBa2 = 1.34 Å), suggesting that a smaller radius may
increase the stability of these structures (Sugimoto et al., 2001). However, Wan et al. concluded that
transition-metal ions Co2+ and Ni2+, compared to alkaline-earth metal ions, show superiority in the boosting of triplex DNA formation (Wan et al., 2009). They propose that this is the result of the higher
affinity of transition-metal ions for purine N7 than alkaline-earth metal ions, enhancing the formation of Hoogsteen hydrogen bonds. Nonetheless, the use of free transition metals in solution is not compatible with physiologic conditions, and thus their use was discarded.
The interaction of Mg2+ and/or Na+ and triplex DNA has been thoroughly investigated (Debin et al.,
1999; Wan et al., 2009; Lee et al., 2010; Chiou et al., 2011). Mg2+ is generally considered an enhancer
of triplex formation and its main mechanism of stabilization is charge neutralization: triplex DNA has a higher charge density than that of either duplex or single stranded DNA and Mg2+ binds to the phosphate group, reducing the repulsion between the three phosphate frameworks. Mg2+ may also coordinate with N and O of bases, contributing to triplex conformation (Wan et al., 2009). It has also
been determined that concentrations above 10 mM do not appear to increase the stability further (Sugimoto et al., 2001). Contrary to the Mg2+ effect, Na+ has been appointed as an inhibitor of the
triple helix formation. The hindering effect of Na+ against forming triple helix DNA can be explained by
polyelectrolyte effect: a high concentration of Na+ lowers the population of Mg2+ in the vicinity of DNA,
lowering the population of triplex DNA (Debin et al., 1999; Lee et al., 2010). Na+ also has the ability to
form undesirable dimers and tetramers, decreasing the efficiency of triplex formation even in the absence of Mg2+ (Lee
et al., 2010). Thus, on one hand, it is known that higher salt concentrations
increases Tm’s; on the other hand, in order to potentiate the formation of triple helices, the TFO must
have a length of at least 12-14 nucleotides (Chan and Glazer, 1997), thus a balance between structure stability and desired strand release temperature must be found.
Additionally, the sequence required to form a triplex DNA structure is limited to nucleotides able to form Hoogsteen bonds, so a domain of the triplex-forming strand part has to carry the sequence that will perform the silencing. In a first stage, and to attempt to confer increased stability, this triplex-forming strand will only have 10 therapeutic nucleotides (and not the 18-25 required by literature for an efficient gene silencing).
Considering the referred limitations, the design chosen for this work is presented in Figure 3.1and further on referred as T17, due to the 17 nucleotides forming Hoogsteen bonds present. These 17 nucleotides were chosen by taking into consideration the work of Lee and colleagues, where a similar sequence was used as the TFO (Lee et al., 2010). The minor differences in sequence only diminish
19
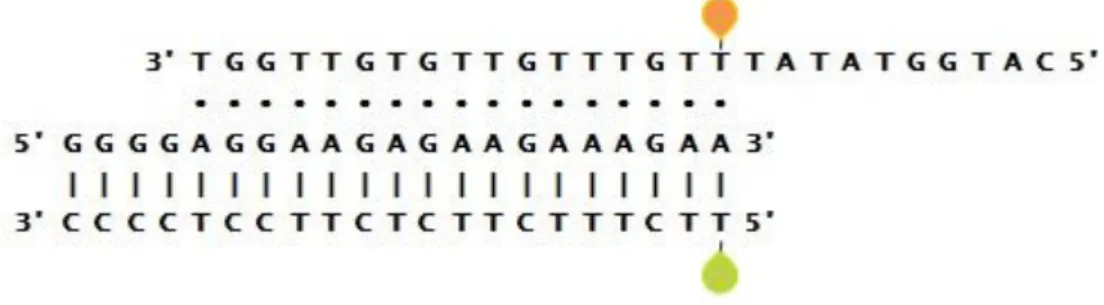
Figure 3.1 – Triplex DNA structure with 17 nucleotides forming Hoogsteen hydrogen bonds (T17 structure). Oligonucleotide designation from the top to bottom: 3T17 (or TFO); 1T17; 2T17. | represents
Watson-Crick hydrogen bonds; • represents Hoogsteen hydrogen bonds;
•
represents JOE and•
represents FAM. The fluorophores were only used for FRET assays and in this case the oligonucleotides labeled with JOE and FAM are referred as 3T17_11dT-JOE and 2T17_5’FAM, respectively. Every other experiment was carried out without fluorophores but the oligonucleotide sequence remained the same.The structure presented was designed to minimize the formation of other secondary structures that might lead to malformed or unpredicted structures that could lead to incorrect analysis.
3.1.2. Structure formation assessment
Various techniques were used in order to identify and characterize the triplex DNA structure assembly. Following the characterization methods employed by others in the study of triple helix structures (Plum et al., 1990; Scaria and Shafer, 1996; Lee et al., 2010; Schneider et al., 2010; Chiou et al., 2011; Reither and Jeltsch, 2011), fluorescence and UV spectroscopy were the mainly selected
techniques for the study of the T17 construct.
The formation of the T17 structure was also characterized by polyacrylamide gel electrophoresis (PAGE). However, PAGE results were not conclusive and further optimizations to this method have yet to be performed (Appendix I).
3.1.2.1. FRET analysis
FRET analysis was chosen as the main technique to assess the formation of the DNA tertiary structure and release of the TFO (the therapeutic oligonucleotide) from the double strand core.
20
fluorophores (FAM as donor and JOE as acceptor) is approximately 95.8% (see Appendix II) for the distance predicted between the two fluorophores upon triple helix formation (Figure 2.1 and Figure 3.1). Upon melting, the triple helix is disrupted and the TFO is released from the entrapment with
concomitant alteration of the spectral signal which will transduce into the increase of the donor’s
fluorescent emission. Control experiments employing a labeled strand with a closely related sequence, but incapable of forming a triple helix structure, were performed in order to assess the formation of unspecific secondary structures.
Taking the previously described influence of divalent and monovalent cations into account (see section 3.1.1), T17 structure formation was attempted in different binding buffers: 10 mM Tris-HCl, pH 7.6; TE 1x, pH 7.0; 10 mM sodium phosphate, pH 7.4, and discrete concentrations of MgCl2 or MnCl2
and/or NaCl, and the best conditions were then chosen according to the results. These experiments were carried out at 15ºC in order to maximize thermal stability for structure formation, given that the ionic requirements are met. Despite the successfulness of the referred buffers in triple helix formation in diverse studies, the above ionic conditions were all screened to determine their effect on T17 structure formation, due to its higher complexity. Sodium phosphate buffer was then excluded as a potential binding buffer after some experiments due to formation of a white precipitate at high temperature. This precipitate is likely to be magnesium phosphate, which is insoluble in water.
The experiments run in HCl (pH 7.6) and TE (pH 7) had comparable results. However, Tris-HCl was used as the binding buffer of choice for two reasons: its pH is closer to physiological pH and also, the presence of EDTA (a powerful chelating agent that binds Mg2+ ions with high association constant) in TE competes with the triple helix for the magnesium in solution introducing solution equilibrium considerations that unnecessarily complicates the analysis.
21
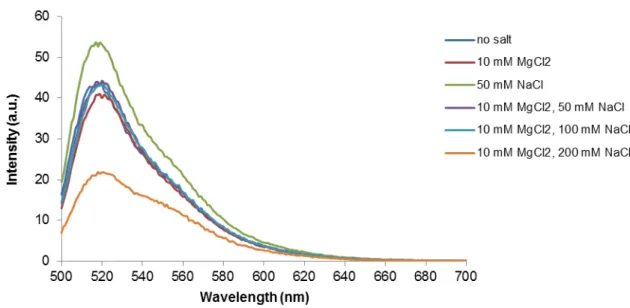
Figure 3.2 –Emission spectra (λexc = 490 nm) of structure T17 in 10 mM Tris-HCl (pH 7.6) and different
concentration of MgCl2 and/or NaCl at 15ºC. Besides a peak at 520 nm, JOE emission at 550 nm is visible in
every ionic condition tested; this is a result of JOE direct excitation at 490 nm.
Results show the donor emission peak at 520 nm and the emission of JOE (with maximum at 550 nm), even in the absence of Mg2+ and Na+. The presence of JOE emission in all the saline conditions
assayed does not directly indicate triple helix formation, since a strong JOE direct excitation component is present when the solution is excited at 490 nm (see Figure 2.1). In the absence of stabilizing ions (Mg2+) or when JOE is functionalized to a non-TFO oligonucleotide, emission of the acceptor is systematically present in the measured emission spectra (see Appendix III, Figure A.2), corroborating that the presence of JOE emission does not unequivocally indicate T17 structure formation. The decrease of both donor and acceptor emission for the highest salt concentration, when compared to the other samples, is due to the quenching effect of chloride, the counterion used for both sodium and magnesium salts.
FAM and JOE are both fluorescein derivatives which present strong spectral overlap. On one hand, the high overlap between FAM emission and JOE absorption allows for very efficient energy transfer yields; on the other hand, the overlapping absorption of both fluorophores (at 490 nm, the absorption by FAM is 78000 M-1cm-1 and by JOE is approximately 28630 M-1cm-1; Figure 2.1), makes this FRET pair a less-than-ideal choice. However, this pair was selected as a consequence of two intrinsic limitations of the system:
1) The triplex structure is to be functionalized onto the AuNPs’ surface in a posterior phase,
where the melting of the triple helix has to be followed by FRET analysis, in a parallel approach as free-DNA studies. Previous results in our group succeeded to demonstrate that
rhodamine derivative compounds interact irreversibly with the AuNPs’ surface through the
22
2) The AuNPs chosen have a plasmon resonance absorption in the 520 nm region, so in order to prevent possible intern filter effects due to the nanoparticle presence, the fluorophore choice was further limited to fluorescein derivatives.
Additionally, due to budget constraints it was necessary to choose a FRET pair that suited both the free DNA analysis and its posterior utilization in the presence of AuNPs.
The considerable contribution of direct excitation of JOE rendered challenging the splitting of the contribution of FRET and direct excitation to the overall measured emission. To overcome this problem, excitation spectra were measured instead. An excitation spectrum measures the fluorescence intensity at a single emission wavelength, upon scanning of the excitation wavelengths. In practical terms, it will give the relative weight of energy transfer and direct excitation at 550 nm when compared to the absorption spectrum of the sample. The emission wavelength has to be carefully chosen to minimize donor’s emission. It should be noted that due to the strong spectral overlap of the two dyes, a complete splitting of both processes is not possible using steady-state fluorescence techniques. For a better understanding of the analysis performed and the relevance of excitation spectra to this situation refer to Appendix IV, which shows the different outcomes when measuring the excitation spectra of samples with different combinations of fluorophores.
Here, the emission wavelength was set at 640 nm where FAM emission is considerably smaller
than JOE’s (Figure 2.1). Figure 3.3 shows the comparison between the absorption spectrum of the T17 structure-forming oligonucleotides in 10 mM Tris-HCl and excitation spectra at different concentrations of MgCl2 and/or NaCl.
Figure 3.3 – T17 structure formation assessment by comparison between A) absorption spectrum of the
mixture and B) excitation spectra (λem = 640 nm) at different concentrations of MgCl2 and/or NaCl. In the excitation spectra, there is a clear inversion of the peaks in 10 mM MgCl2 and 10 mM MgCl2, 50 mM NaCl which might indicate the T17 structure formation.
23
oligonucleotide that is unable to form triple helices is used yield similar results (Appendix III, Figure A.3). For the other salt conditions tested, they all present increased emission at 490 nm excitation. This increase is due to energy transfer from FAM present in the double helix motif to the JOE located in the TFO strand, indicating the presence of a triple helix structure. Higher yields of triple helix formation were attained when 10 mM MgCl2 and 10 mM MgCl2 plus 50 mM NaCl were used. These
observations are in accordance with previous reports (Lee et al., 2010). Curiously, the presence of 50
mM NaCl when 10 mM MgCl2 is also present in solutiondoes not evidence destabilization of the
structure, even though it was expected that this Na+ concentration would decrease T17 structure yield.
Due to the considerable contribution of direct FAM emission in the excitation spectra, only qualitative results can be given, and no accurate yields on the T17 structure formation can be obtained.
The condition chosen to perform further characterization of the T17 structure was 10 mM MgCl2.
Similar ionic conditions were used with MnCl2 as an enhancer for the formation of the construct and
results comparable to those using MgCl2 were obtained (Figure 3.4). It can be observed that FAM’s
emission peak diminishes when in the presence of Mn2+. However, that decrease in the donor’s
fluorescence intensity is not accompanied by an increase in the acceptor’s intensity, which would
demonstrate an energy transfer process. In can also be observed that the emission peak of FAM is more intense when NaCl is present in solution and that intensity increases with the increase of NaCl
concentration. The donor’s intensity peak reaches its maximum intensity in this assay when the
divalent cation is not present in solution. This is in agreement with the literature (Lee et al., 2010) as
Na+ is an inhibitor of triple helix formation. Due to time constrains, the work with this salt was discontinued.
Figure 3.4 –Emission spectra (λexc = 490 nm) of structure T17 in 10 mM Tris-HCl (pH 7.6) and different
concentration of MnCl2 and/or NaCl at 15ºC. Besides a peak at 520 nm, JOE emission at 550 nm is visible in
24
3.1.2.2. Melting profiles
In order to compare the results obtained by FRET to a standard technique in the analysis of the nucleic acids structure, UV melting curves were measured. Figure 3.5 shows the melting curves of the T17 structure-forming oligonucleotides, the double helix without the TFO, and the double helix oligonucleotides with a non-TFO control of triplex formation.
Figure 3.5 – Melting profiles followed by absorption at 260 nm in 10 mM Tris-HCl and 10 mM MgCl2. Black
solid line: T17 structure-forming oligonucleotides (1T17, 2T17 and 3T17); black dotted line: T17 double helix (1T17 and 2T17); grey dashed line: T17 double helix (1T17 and 2T17) and non-TFO. The inset highlights the transition from triplex structure to double helix and 3T17 oligonucleotide that occurs around 40ºC.
Results show that when the T17 double helix is present, only one sharp transition at approximately 75ºC is observed. This value is in agreement with the predicted temperature according to the nearest neighbor model (circa 81ºC) for this saline condition. When the triple-helix forming oligonucleotide is present, a second transition is observed at around 40ºC, indicating the dissociation of a less stable structure. Assuming the presence of the triple helix construct, and according to DNA hyperchromicity theory, one would expect Hoogsteen hydrogen bonds to be less stable than typical Watson-Crick ones, although triple helix formation induces further tighter stacking within the tertiary structure domain, decreasing structure absorbance. Moreover, by design only 17 bases forming Hoogsteen bonds are predicted versus 21 bases forming Watson-Crick bonds present forming the double-stranded component. Seventeen bases forming Hoogsteen bonds correspond to 34 hydrogen bonds (see Figure 1.3) that are less stable than their Watson-Crick counterparts. These Watson-Crick hydrogen bonds are also present in higher number – 52 in total. The overall result should be a more subtle transition than the one found in simple double helix dissociation, and at lower temperatures. These results are thus in agreement with the dissociation profile expected from a triple-helix structure. At the ionic strength used in this assay, the Tm of the triplex transition is around 40ºC which would
25
lower energies than required to melt a double strand, resulting in less healthy tissue damage. Temperature is a function of the distance from the center of the nanoparticle and is related to the incident energy of irradiation (Govorov et al., 2006; Govorov and Richardson, 2007). Therefore,
although the triplex fraction of the structure is more distant from the center of the nanoparticle, the temperature increase needed to melt is lower and consequently, the energy and/or time of irradiation should be lower than to melt the double strand fraction.
Also represented in Figure 3.5 is the melting curve of the double helix in T17 structure and a non-TFO. This control melting curve permits to identify artifacts in the triplex transition due to the possible presence of non-specific secondary/tertiary structures. This oligonucleotide is not able in principle to form neither triplex nor duplex structures with any of the other two oligonucleotides. The melting curve shows, however, from 0 to 45ºC, a profile that coincides with T17 melting curve. But the absorbance continues to increase linearly until it reaches roughly 65ºC and after that, a clear sigmoidal fraction of the curve appears, regarding dsDNA to ssDNA transition. Control melting curves of each oligonucleotide used alone show that the increase in the absorbance until 65ºC is due to intramolecular interactions, that are only formed in the absence of more thermodynamically stable structures. In the presence of 1T17 and 2T17, 3T17 yields a different melting profile than compared when it is the only oligonucleotide in solution. The transition at 40ºC is only observed when all three T17 forming oligonucleotides are present. This taken together with the FRET experiment results corroborates that, indeed, the transition obtained is due to the release of the TFO strand from its duplex scaffold.
3.2.
Vectorization
AuNPs were used as vectors to the DNA delivery, as shown in Figure 3.6A. Unfortunately, due to time constrains, the first step of the conjugates characterization and development involved exclusively the double helix of the T17 structure conjugated with AuNPs as depicted in Figure 3.6B.
Figure 3.6 – Scheme of AuNP conjugates. A) AuNP conjugated with the complete T17 structure; B) AuNP
conjugated with the double strand of T17 structure. For oligonucleotide sequences refer to Figure 3.1. AuNPs are functionalized via thiol group of one of the oligonucleotides. For clarity, one structure is represented per AuNP but note that AuNPs will be functionalized with more than one DNA structure.
3.2.1. DNA-AuNP conjugates synthesis and characterization