Pedro Filipe dos Santos Anjos
Licenciado em Ciências da Engenharia Biomédica
Development of a fundus camera for
analysis of photoreceptor directionality in
the healthy retina
Dissertação para obtenção do Grau de Mestre em Engenharia Biomédica
Orientador: Brian Vohnsen, Senior Lecturer, University College
Dublin, School of Physics
Co-orientador: Pedro Vieira, Professor Auxiliar, FCT-UNL
iii
Development of a fundus camera for analysis of photoreceptor directionality in the healthy retina Copyright © Pedro Filipe dos Santos Anjos, Faculdade de Ciências e Tecnologia, Universidade Nova de Lisboa.
v
This project was developed at University College Dublin within the Advanced
vii
Dedico esta dissertação aos meus avós: Elisabeth Santos, Camilo Luiz dos Santos, Maria
José dos Anjos e Carlos Batista dos Anjos.
ix
Acknowledgements
I would like to express my appreciation and gratitude to my supervisor Brian Vohnsen for accepting me into his research group, providing me with an amazing opportunity and experience, and for his guidance throughout the project. I would also like to thank PhD student Denise Valente for her support and for the valuable advice at certain key moments. I offer a very special thanks to Salihah Qaysi, just starting her PhD, the person without who the completion of this project would not have been possible. Thank you for your availability and contagious perseverance. Finally, I would like to thank the rest of the Advanced Optical Imaging group: PhD student Rebecca McQuaid, Doctor Atikur Jewel and Doctor Jia Jun Li, for their support and companionship.
xi
Abstract
The Stiles-Crawford effect (SCE) is the well-known phenomenon in which the brightness of light perceived by the human eye depends upon its entrance point in the pupil. This physiological characteristic is due to the directional sensitivity of the cone photoreceptors in the retina and it displays an approximately Gaussian dependency which is altered in a number of pathologies. Retinal imaging, a widely spread clinical practice, may be used to evaluate the SCE and thus serve as diagnostic tool. Nonetheless, its use for such a purpose is still underdeveloped and far from the clinical reality.
In this project a fundus camera was built and used to assess the cone photoreceptor directionality by reflective imaging of the retina in healthy individuals. The physical and physiological implications of its development are addressed in detail in the text: the optical properties of the human eye, illumination issues, acquiring a retinal image formed by the eye, among others. A full description of the developmental process that led to the final measuring method and results is also given.
The developed setup was successfully used to obtain high quality images of the eye fundus and in particular the parafoveal cone photoreceptors. The SCE was successfully observed and characterized. Even though considerable improvements could be done to the measurement method, the project showed the feasibility of using retinal imaging to evaluate the SCE thus motivating its usage in a clinical environment.
xiii
Resumo
O efeito de Stiles-Crawford (ESC) é um fenómeno bem conhecido no qual o brilho da luz percepcionado pelo olho humano depende do ponto de entrada da mesma na pupila. Esta característica fisiológica deve-se à sensibilidade direccional dos fotorreceptores na retina, nomeadamente os cones, e apresenta uma dependência aproximadamente Gaussiana que se encontra alterada numa série de patologias. A imagiologia da retina, uma prática clínica comum, pode ser usada para avaliar o ESC e portanto servir como ferramenta de diagnóstico. No entanto, o seu uso para este fim encontra-se ainda sub-desenvolvido e distante da realidade clínica.
Neste projecto, uma câmara de fundo ocular foi criada e usada para aferir a direcionalidade dos cones na retina de indivíduos saudáveis por imagiologia de reflexão. As implicaçoes físicas e fisiológicas do seu desenvolvimento são abordadas em detalhe no texto: as propriedades ópticas do olho humano, questões de iluminação, adquirir uma imagem da retina formada pelo olho, entre outras. Uma descrição completa do processo de desenvolvimento que levou ao método de medição e resultados finais é também feita.
O sistema desenvolvido foi usado com sucesso para obter imagens de alta qualidade do fundo ocular e em particular dos cones na parafóvea. O ESC foi observado e caracterizado com sucesso. Apesar do facto de que melhorias consideráveis pudessem ser feitas ao método de medição, o projecto mostrou a viabilidade do uso de imagiologia da retina para avaliar o ESC e assim motivar o seu uso em ambiente clínico.
xv
Table of Contents
Acknowledgements ... ix
Abstract ... xi
Resumo ... xiii
Table of Contents ... xv
Table of Figures ... xvii
Table of Tables ... xix
1. Introduction ...1
2. Theoretical Background ...3
2.1 The Stiles-Crawford Effect ...3
2.2 The Waveguide Theory...5
2.3 The SCE of the Second Kind ...6
2.4 Biological Function ...7
2.5 The Optical SCE...7
2.6 The Fundus Camera ...9
3. State of the art ...13
3.1 Adaptive optics and retinal imaging ...13
3.2 Ultra-small spot size scanning laser ophthalmoscopy ...16
3.3 A layered scattering model of outer-segment photoreceptor pigments ...18
4. Work plan ...21
5. Camera Design Considerations ...23
5.1 Optical Properties of the Eye ...23
5.1.1 Refractive elements ...23
5.1.2 Aperture ...24
5.1.3 Sensitive Surface ...25
5.2 Eye motion ...26
5.3 Illumination ...26
5.3.1 Maxwellian Illumination ...27
5.3.2 Illuminated Region ...27
5.3.3 Illuminance ...28
5.3.4 Eye Focus ...28
5.3.5 Positioning the Subject ...28
5.4 Acquiring an Image ...29
xvi
5.4.2 Changing the focusing plane and magnification ...32
5.5 Shielding ...32
5.6 Health and Safety ...33
6. Optical Elements and Other Tools ...35
7. System Development and Experimenting...39
8. Final Setup and Directionality Measurements ...49
9. Results ...53
9.1 Retinal Images ...53
9.1.1 Optic Disc...53
9.1.2 Blood Vessels ...54
9.1.4 Capillaries and Cone Photoreceptors ...55
9.1.5 Digitally Enhanced Images ...55
9.2 Directionality Results and Analysis ...57
10. Discussion and Conclusion ...61
11. Future Research Directions ...65
References ...67
Appendices ...71
A.1 Health and Safety ...71
A.2 Sensor Specifications ...73
A.3 System Development Photographs ...74
A.4 Photographs of the Final System...76
xvii
Table of Figures
1.1 The Stiles-Crawford Effect ...1
2.1 The Stiles-Crawford Curve ...4
2.2 Cone Photoreceptor Model for the Waveguide Theory ...5
2.3 Optical SCE Curve ...8
2.4 Direct Illumination and Observation of the Eye ...9
2.5 Annular Illumination of the Eye in a Commercial Fundus Camera ...10
2.6 Illuminated Area of the Retina in Annular Illumination ...10
2.7 System Diagram of a Commercial Fundus Camera ...11
2.8 Prim System in a Commercial Fundus Camera ...11
3.1 Diagram of an Adaptive Optics Imaging System ...14
3.2 Diagram of a Wavefront Sensor and Deformable Mirror ...15
3.3 Retinal Image with Individual Cone Photoreceptor Directionality ...16
3.4 Normal and Annular Beam PSF Comparison ...17
3.5 Retinal Image with Average and Individual Cone Photoreceptor Directionality ...18
3.6 Cone Outer-Segments Numerical Models ...19
5.1 Diffraction vs Aberrations Effects in the Eye ...25
5.2 Spectral Reflectance of the Eye Fundus ...26
5.3 Maxwellian View System ...27
5.4 Field of View Depending on Lens Distance and Diameter ...29
5.5 Magnification and Field of View ...31
5.6 Total Field of View ...31
6.1 sCMOS Rolling Shutter Mode ...37
6.2 sCMOS Global Shutter Mode ...37
7.1 Image of the Graphite Arrow Obtained with the System ...40
7.2 Image of the Black Target Obtained Using the Thin Optical Fibre ...41
7.3 First Visualization of Blood Vessels ...43
7.4 First Visualization of Possible Cone Photoreceptors ...44
7.5 Retinal Image Obtained Using Polarizer Filters ...45
7.6 First Visualization of Parafoveal Cone Photoreceptors ...46
8.1 Diagram of the Final System ...50
9.1 11.5 and 12 Times Magnified Images of the Optic Disc ...54
9.2 Set of Images of Large Blood Vessels ...54
xviii
9.4 Digitally Enhanced Images of the Optic Disc ...56
9.5 Digitally Enhanced Images of the Cone Mosaic and Capillaries ...56
9.6 Digitally Enhanced Image of the Cone Mosaic ...57
9.7 to 9.9 Directionality Measurements Results ...58
A.1 Photograph of the System with the Telescope Configuration ...74
A.2 Photographs of the System Under Developement ...74
A.3 Photograph of the Experimental Setup Using the Thin Optical Fibre ...75
A.4 Setup Which Produced the First Images of Cones at Large Eccentricities ...75
A.5 to A.7 Photographs of the Final System ...76
xix
Table of Tables
8.1 Distance From Each Element in the System to the Previous One ...51
A.1 Maximum Permissible Radiant Power ...71
A.2 Parameters to be Used in Table A.1 ...71
1
1.
Introduction
The human eye exhibits directional sensitivity, in which light rays entering the pupil near its centre appear much brighter than those entering closer to the rim of the pupil, this means that the perception of brightness in the eye does not increase linearly with pupil aperture. The effect has been known since 1933 and was named after its discoverers (W. S. Stiles and B. H. Crawford) as the Stiles-Crawford effect (SCE) [1]. Figure 1.1 illustrates the phenomenom.
0.1.1 Stiles-Crawford Effect
This effect has long been attributed to the photoreceptors in the retina, especially the cones [3]. Cone photoreceptors display waveguide properties, which have come to play a significant role in the explanation of the effect [4]. These optical-fibre like elements, display a high order of parallel orientation towards the centre of the pupil and possess an angle of acceptance which limits the entrance of light to a relatively narrow angle, reducing the amount of obliquely incident light that is absorbed by the photopigments.
The SCE is therefore regarded as a valuable feature of the eye to assess photoreceptor orientation in the retina, which was shown to be disturbed in clinical conditions such as retinitis pigmentosa, central serous choroidopathy, gyrate atrophy, fibrous scars, trauma and age-related macular changes [5].
Nonetheless, its clinical application has seen very limited use, due mainly to the time-consuming psychophysical methods that have been the standard procedures since the discovery of the phenomenon. In such methods, subjects are required to match the brightness of a beam impinging the eye on a distance from the pupil centre, to that of a beam entering the pupil at its centre. Such methods require great concentration and co-operation from the subject, limiting greatly its widespread clinical use [5].
Faster and more practical techniques are therefore demanded. One possible candidate to solve the presented limitations is the manifestation of the related phenomenon of light reflected from the retina. Just like photoreceptors accept light coming from the centre of the
2
pupil more efficiently, they also reflect it more intensely towards the centre of the pupil [6]; this is called the optical Stiles-Crawford effect (OSCE).
By taking advantage of this optical effect, several techniques have been developed in the last few years; such techniques form what is now termed as fundus reflectometry. Among these methods one may highlight a few: scanning laser ophthalmoscopy [7], imaging spectography [8], optical coherence tomography [9] and retinal photography. The last of these makes use of a fundus camera, which in essence is an ophthalmoscope that redirects the observation light to the film or electronic sensor of a camera.
3
2.
Theoretical Background
The eye is the image forming device of the human body. It conveys a comprehensive visual perception of the outer world. Information from exterior objects comes in the form of millions of light rays (or photons) with no particular direction or orientation, the eye gathers those rays through its aperture, the pupil, and bends them with resort to strong lenses, the cornea and crystalline lens, focusing a previously disorganized bundle in one single point on the image sensing layer of the eye, the retina.
The retina is a neuronal tissue layer that covers the posterior wall of the eye, the fundus. It is formed of several intricate intra-layers, one of which is light sensitive, just like the film or electronic sensor of a camera. This layer is formed by tube like photoreceptors which are neurons very generically made up of an inner and an outer segment. Light enters the photoreceptors on the inner segment and is directed towards the outer segment, where it interacts with the photopigments initiating the phototransduction process.
Two types of photoreceptors may be distinguished: cones and rods. Their names come from their outer segments shape, but their differences apart from shape are responsible respectively for: daylight or photopic vision and low light or scotopic vision.
2.1 The Stiles-Crawford Effect
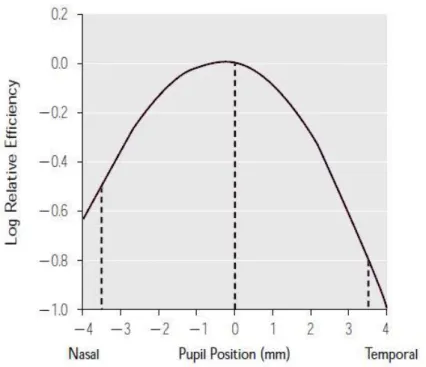
The directional sensitivity of the eye, or SCE, was shown to be retinal in origin [3]. The peak of this sensitivity to light entering the pupil is typically located at approximately 0.2 mm superior and 0.5 mm nasal to its centre (𝑑𝑚𝑎𝑥) [10] and is traditionally measured in terms of:
𝜂(𝑑, 𝜆) =𝑎𝑚𝑜𝑢𝑛𝑡 𝑜𝑓 𝑙𝑖𝑔ℎ𝑡 𝑒𝑛𝑡𝑒𝑟𝑖𝑛𝑔 𝑎𝑡 𝑎 𝑑𝑖𝑠𝑡𝑎𝑛𝑐𝑒 𝑑 ≠ 0 𝑡ℎ𝑎𝑡 𝑝𝑟𝑜𝑑𝑢𝑐𝑒𝑠 𝑡ℎ𝑒 𝑠𝑎𝑚𝑒 𝑠𝑡𝑖𝑚𝑢𝑙𝑢𝑠𝑎𝑚𝑜𝑢𝑛𝑡 𝑜𝑓 𝑙𝑖𝑔ℎ𝑡 𝑒𝑛𝑡𝑒𝑟𝑖𝑛𝑔 𝑎𝑡 𝑡ℎ𝑒 𝑐𝑒𝑛𝑡𝑒𝑟 𝑜𝑓 𝑡ℎ𝑒 𝑝𝑢𝑝𝑖𝑙 (𝑑 = 0)
With a Gaussian fit of the form:
𝜂(𝑟) = 𝜂𝑚𝑎𝑥10𝑝(𝜆)(𝑟−𝑟max)2
Or a parabola fit by taking its logarithm and normalizing:
log(𝜂(𝑟)) = log(𝜂𝑚𝑎𝑥) − 𝑝(𝜆)(𝑟 − 𝑟max)2
log(𝜂(𝑟))
log(𝜂𝑚𝑎𝑥) = −𝑝(𝜆)(𝑟 − 𝑟max) 2
Where 𝑝, the width of the parabola, is a measure of the directional sensitivity (larger 𝑝 values correspond to narrower parabolas and greater directional sensitivity) and on average equals 0.05 mm−2; 𝑟 is the distance to the centre of the pupil.
4
0.1.1 THe Stiles-Crawford Curve
Despite the wide utilization of this representation, it is actually not the most accurate model. The representation based on the Gaussian fit is also widely accepted and shown to provide a more faithful description of the effect [11], especially for pupil locations greater than ±3 mm.
For the Gaussian model the 𝑝 parameter may be expressed in terms of the half-width at half-height (HWHH) of the Gaussian using the following equation [12]:
𝐻𝑊𝐻𝐻 = (0.3 𝑝⁄ )0.5
The directional sensitivity of the eye depends on several parameters, among which luminance and wavelength. When light conditions enable photopic vision, the directional sensitivity remains fairly constant, but when luminous conditions are dim and scotopic/rod vision begins to be predominant, it is greatly reduced. This fact excludes the refractive elements of the eye as the origin of directional sensitivity, suggesting that it must be retinal and manifest itself mainly in cones [3].
The dependence of this phenomenon on wavelength is also highly pronounced [13], being greatest at the extremes of the visible spectrum and least at medium values, between 500 and 600 nm. This feature of the SCE along with the knowledge that the cytoplasm of photoreceptors has a higher index of refraction than the membrane [14], suggest that photoreceptors work as waveguides, or optical fibres, pointing to the centre of the pupil. This also implies an angular acceptance of light by the photoreceptors, which is congruent with the SCE. This is at the present time the basis of the most well established theories to explain the directional sensitivity of the human eye.
5
2.2 The Waveguide Theory
A waveguide is a structure which confines light by means of total internal reflection, allowing its almost lossless propagation across distances. One such example are optical fibres. To allow for total internal reflection, optical fibres are made up of a core with a high refractive index and a cladding of lower refractive index. Light propagates in the core by being reflected at the cladding at an angle greater than the critical angle required for total internal reflection.
The most widely accepted theories to explain the directional sensitivity of the eye, model the cone photoreceptors as microscopical optical fibres made up of a larger inner segment connected to a thinner outer segment by a tapering region, the ellipsoid [4]. In such model, the cytoplasm of the photoreceptor is regarded as the core and the cell membrane and extracellular fluid as the cladding. Figure 2.2 represents this model:
0.1 Cone Photoreceptor Model
In the described model, cones are considered as perfect cylindrical structures (apart from the tapering region) with smooth surfaces, which accept light only from one transverse aperture. In addition, all tissue involved is considered to be homogeneous and isotropic.
Since the wavelength of light is in the order of magnitude of the cone aperture, light entering the cone suffers diffraction, originating an ever changing distribution of light propagation angles. Geometrical ray tracing optics is therefore inadequate. Nonetheless, patterns of light distribution that stay constant across the waveguide length are observed, this patterns are characterized by standing waves produced by light bouncing off of the membrane walls that constructively and destructively interfere in this confined region of space [15]. These standing wave patterns are the optical counterpart of the acoustic vibrating string and are likewise called modes.
This wave optics view predicts the existence of several modes in a waveguide, and the number of possible modes and other features of a waveguide are dictated by the important V parameter:
6
𝑉 = 𝜋𝑑/𝜆(𝑛12− 𝑛22)0.5
Where 𝑑 is the diameter of the waveguide, 𝜆 the wavelength of light, and 𝑛1 and 𝑛2 are the indices of refraction of the core and cladding respectively.
The energy propagating in a mode exists both inside and outside the photoreceptors. While lower order modes possess more energy inside than outside, higher order modes have a lower percentage of their energy within the photoreceptors. Of this energy, only the one contained within the interior of the photoreceptors will be able to interact with the photopigments. Since higher order modes are more efficiently excited by greater angles of incidence, as these angles increase less energy from the trapped light will be interacting with the photopigments and contributing to the brightness sensation.
Although the described approach seems to provide a satisfactory explanation to the phenomenon, one must bear in mind that those are rather simplistic abstract models that make a series of compromises, yielding a formulation that is quite far from the real biological situation [16]. As a consequence, no definitive model of the SCE has yet been established.
The V parameter of the waveguide model is the main factor contributing to the wavelength dependence of the SCE, i.e. the SCE parameter 𝑝. An additional effect related to the wavelength of light is the shift in perceived hue and saturation of a monochromatic beam of light when it enters the pupil towards its rim. Such observation has been named chromatic SCE or SCE of the second kind (SCE-2).
2.3 The SCE of the Second Kind
As observed by W. S. Stiles in 1937, light entering the eye pupil at a distance from its centre will not only seem less bright, it will also change its apparent color [17].
This phenomenon is characterized by a shift of the hue of short and long wavelengths to the hue of longer wavelengths, whereas medium wavelengths shift their perceived hue to those of shorter wavelengths. Moreover, supersaturation occurs in wavelengths greater than about 515 nm and desaturation in wavelengths between 515 and 480 nm [18]. The magnitude of the shift and the point at which it reverses direction differ greatly between individuals.
The perception of a specific color hue by the human eye is obtained from the relative amount of photopigment stimuli between each cone type (short, medium and long wavelength cones) [19]. Therefore, changes in relative photopigment photon absorption numbers must be the basis for the phenomenon.
7
will differ as well, resulting in different numbers of photon absorptions between cone types for varying incident angles.
2.4 Biological Function
The SCE can be regarded as a reduction of the effective diameter of the pupil – an apodization –, a gradual reduction in opposition to a sharp cutoff provided by the iris. This effect has the consequence of reducing off-axis rays entering the eye, thus reducing the amount of aberrated rays contributing to form an image. Although this effect is thought to give little contribution to image quality in eyes with normal focusing ability, it was shown to provide greater image quality in accommodation lag situations or in ametropic eyes [21].
The several elements of the eye, from the cornea to the fundus itself, are known to produce scatter phenomena. These events contribute to the glare we see around luminous points of light. By being able to select light that comes from the centre of the pupil, the retina filters out to some extent the scattered photons that deteriorate image quality.
A further advantage of this pupil apodization comes from the fact that it manifests mainly in cone photoreceptors. Since rods require large pupil diameters to maximally absorb larger amounts of light whereas cones provide more acute images with non-aberrated, non-scattered light, the SCE provides a clever means to allow optimum rod and cone simultaneous functioning in medium light conditions (mesoscopic vision), by reducing the pupil effective diameter for cones while maintaining the real pupil dimensions for rods [12].
An additional possible purpose of waveguiding in the retina, is that it might be advantageous to have the photopigments packed in a smaller region of space, this way photopigment production and maintenance may be more cost efficient while simultaneously allowing for an equivalent photon absorption of a larger area.
2.5 The Optical SCE
Most of the light reaching the retina is absorbed either by the photopigments, contributing to forming an image, or by other elements in the fundus such as the retinal pigment epithelium (RPE) or the choroid. Nonetheless, a very small percentage of the light reaching the retina is always reflected back to the pupil [6].
The reflectivity of the retina is explained by two main processes: backscattering and photoreceptor waveguiding [22]. The first happens as a result of those photons that reach the extracellular space in between photoreceptors and are scattered back, resulting in a relatively uniform distribution of reflected light at the pupil plane with no considerable directional component which produces a constant background in the reflectance profile. The second, is due to the recapture of light that is reflected at the RPE after fully traversing the photoreceptors without being absorbed by the photopigments, being posteriorly redirected towards the pupil centre and producing a reflectance profile similar to that of the SCE.
8
by bleaching the photopigments with a relatively strong light source, thus reducing the amount of absorptions of the incident beam by the photopigments.
The intensity distribution of the optical SCE is usually fitted to a Gaussian, like the psychophysical SCE, with the additional sum of a constant background component, the scattering component:
𝐼 = 𝐵 + 𝐼𝑚𝑎𝑥10−𝑝(𝜆)(𝑟−𝑟max)2
Where 𝐵is the constant background.
Figure 2.3 shows a graph of a measurement and respective fit:
0.1 Optical SCE curve
The speckle effect present in the data is thought to be due to the coherent interference between wavelets with different phases, produced by neighbor photoreceptors which possess slight differences in their lengths.
Another important feature of the optical SCE is the value of the 𝑝 parameter, which is always at least twofold that of the psychophysical SCE. A possible explanation comes from the fact that a redistribution of the energy inside the cones takes place when light is recaptured after being reflected at the RPE [23]. This recaptured light, travelling backwards inside the cones, is thought to excite less efficiently higher order modes. Just like light entering the cones at larger angles excites more efficiently these modes, light coming out from these modes is also emitted with wider angles. Thus, a reduced propagation of light in higher order modes, results in a narrower emission of light from cones.
The optical SCE is the motivational principle for the development and use of a wide range of reflectometric systems that gauge the SCE by means of a fast optical measurement. The fundus camera, with its wide range of applications in retinal diagnosis, may as well be regarded as a tool for such measurements.
9
2.6 The Fundus Camera
As the name indicates, a fundus camera is a device designed with the purpose of acquiring images of the eye fundus and recording them in some way. In order to accomplish this, light must be projected on the fundus and regathered after bouncing off of its surface, just like in any photograph. Such endeavor has however a few particularities in the case of the fundus of the eye: light must enter and leave the “place” where the subject of interest is, by the same relatively small “hole”, the pupil; the eye has its own refractive system which bends light entering and leaving the “hole”; finally, the subject of interest, the retina, reflects very little light when compared with the other optical elements present in the process, either those from the camera system or from the eye itself [24].
A very simple way to photograph the eye fundus is to take a portrait photograph with a normal camera using a flash, the famous red eye effect is no more than the choroid reflection from the eye fundus. But when trying to do the same at a closer, more useful distance, all we get is a black round hole. This happens because the flash is imaged in a certain region of the fundus, instead of illuminating the whole fundus (due to the refraction of the eye), while what the observer sees through the patient’s pupil is the image of another region of the patient’s fundus [25]. Figure 2.4 illustrates the situation.
0.1 Direct Illumination of the Eye
In order to solve this issue, the light source must be made collinear or near collinear with the observer, this way the observer will be seeing the illuminated area of the patient’s eye. On the other hand, the illumination beam and the observation (imaging) beam must be separated on the cornea surfaces and on the crystalline lens anterior surface, in order to prevent light of the illumination beam from being reflected at those surfaces and interfere with the imaging beam [26].
These two apparent incompatible requirements may be met by the use of an annulus mirror and a convex lens, or objective lens. The two elements are placed such that the annulus mirror lies in the pupil conjugate plane, in which the patient’s pupil is magnified. The light source is then shaped into an annulus by a diaphragm, imaged by another set of lens at the annulus mirror and reimaged at the pupil plane [24]. Light will thus enter the eye through the periphery of the pupil and exit at its centre, as shown in figure 2.5, this way both illumination and observation beams will be separated, while maintaining collinearity.
10
0.2 Annular Illumination of the Eye
Therefore, the inner circle of the annulus delimits the observation region at the pupil plane, the area from which the observation beam comes out with the visual information of the fundus. This region is also called the total entrance pupil (TEP), because it encloses the total area of each individual entrance pupil, each of which is determined by the eccentricity angle of the fundus region under study and the parameters of the lens system: refractive indices, thicknesses and curvatures [27].
The annulus inner circle also determines how much of the peripheral zone of the fundus is illuminated: with smaller diameters, larger eccentric angles become illuminated. However, by reducing this diameter we are concomitantly reducing the total entrance pupil. The size of the eye pupil on the other hand, dictates how much of the central region of the fundus gets to be illuminated: with larger pupil diameters, smaller eccentric angles become illuminated. Figure 2.6 clarifies these issues.
After leaving the eye, the observation beam reenters the objective lens which forms an aerial image of the retina at its focal plane, behind the annulus mirror, with the imaging beam
Figure 2.5 Diagram showing light entering the eye at the periphery of the pupil and leaving at its center [28].
11
passing through its hole. If the fundus camera allows for wide angle imaging, a lens or set of lenses named field lens may follow the objective lens to help bring the aerial image to focus in a linear plane by choice of appropriate individual entrance pupils. Finally, a zoom lens which the observer operates focuses on the aerial image of the retina, creating an image on the film of the camera. An additional astigmatism correction lens is also commonly present. Figure 2.7 shows a diagram of such a system.
To allow the camera operator to focus the retinal image on the camera film, a mirror and a prism are used [28]. The mirror stands in front of the film making a 45º angle with it, deviating the image upwards in a 90º angle. The prism is placed above the mirror such that the image is once again redirected in a 90º angle towards the observer eye. The base of the prism is placed precisely at the same distance from the mirror and making the same angle with it, as the film does. The operator should therefore focus the image of the retina in the base of the prism. In order to prevent the operator’s eye from accommodating on an image formed in a plane which is not in the base of the prism, etched black lines are printed in a glass which lies in this plan. This lines form the focusing reticle. The operator must focus his eyes on this reticle before focusing the retinal image with the zoom lens. When both the focusing reticle and the retinal image are seen in focus, the operator presses the camera shutter and the mirror is raised allowing the image to fall on the film of the camera, like in an SLR camera. Figure 2.8 exemplifies the process.
Figure 2.8 Illustration of the mirror and prism system used in the camera. [28]
13
3.
State of the art
A variety of techniques have been employed by several authors to measure the directionality of the photoreceptors in the human retina. Gao et al. [9] explored the directionality of different layers in the retina through the use of optical coherence tomography (OCT), Gorrand & Delori [32] developed a reflectometric technique that measures photoreceptor alignment by gauging the reflected intensity at the pupil, Zagers et al. [8] measured foveal spectral reflectance and cone directionality using an imaging spectrograph.
Although part of the content of the previous section may already be regarded as state of the art, in this section three specific works with major relevance to the project are briefly analyzed. The first of those, borrows a technique from astronomy to obtain high-resolution images with a fundus camera; the other two were developed within the same research group as this project was developed: a scanning laser ophthalmoscope technique and a numerical analysis approach.
3.1 Adaptive optics and retinal imaging
J. Liang, D. R. Williams, and D. T. Miller have successfully used adaptive optics to obtain high-resolution images of the in-vivo human retina to an extent that was only possible to date in ex-vivo samples [29]. By using this technology, A. Roorda and D. R. Williams have studied the optical fibre properties of individual human cones [30].
The concept behind adaptive optics is to correct the natural aberrations of the human eye allowing for higher resolution images of the retina. The human eye is not a perfect focusing device, even with the most acute of visions it presents a host of higher order aberrations that blur vision and reduce the quality of images of the retina. When in bright light conditions, the eye can afford to reduce pupil size allowing a reduction of these aberrations; nonetheless, a smaller pupil size also results in less spatial resolution due to diffraction effects. Thus, by reducing aberrations of the eye while keeping large pupil sizes, high resolution images of the retina may be obtained and vision acuity may be further enhanced.
14
The first phase comprises a Hartmann–Shack wave-front sensor, which consists of an array of 217 small lenses (lenslets) conjugate to the pupil plane, each lenslet with a diameter of 0.5 mm, a centre-to-centre distance of 0.4 mm and a focal length of 97 mm. Behind the lenslet array lies a scientific-grade CCD with 512×512 pixels. A laser beam is focused by the eye onto the retina, which in turn reflects some of the light towards the pupil; this light is then gathered by the lenslet array with each lenslet forming an image of the wave-front on the CCD that lies behind. The displacement of each image gives the local wave-front slope, which is then used to construct the total wave-front slope using a least squares fit.
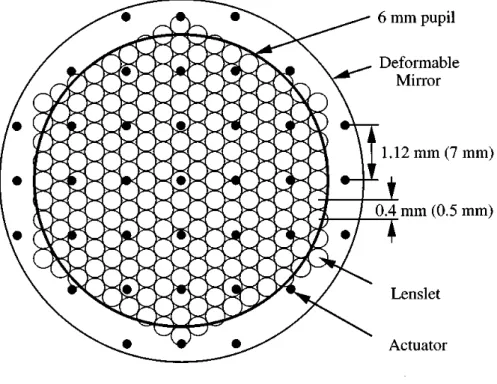
The second phase of the wave-front correction module comprises one deformable mirror with 37 actuators, each actuator 7 mm apart and producing a local deformation of ±2 µm in 4096 steps (12 bits). The mirror lies on the conjugate plane of the pupil, which is magnified 6.25 times on the mirror plane, translating the actuator spacing to 1.12 mm in the pupil plane. Light coming from the eye is reflected by the mirror in its flat configuration towards the sensor, which is also in the conjugate plane of the mirror, the sensor and computer measure the wave-front aberration and compute the required mirror deformation. This information is then sent to the mirror actuators completing a closed-loop circuit. After corrected by the proper mirror deformation, a high resolution image of the retina is captured. Figure 3.2 shows a superimposed diagram of both wave-front sensor and deformable mirror.
15
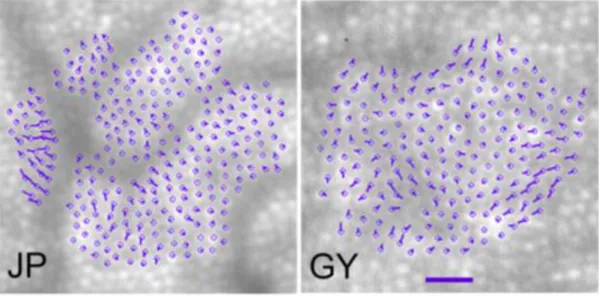
A. Roorda and D. R. Williams were able to show that the amount of disarray in human cones is locally correlated and that it is not enough to account for the spread of the total angular tuning function of the retina.
In this experiment, the same patch of cones 1º nasal from the fovea was imaged with seven different illumination angles. A pair of images was randomly taken for each incidence angle. After seven pairs of images were taken, the wave-front aberrations were corrected and the random process was repeated again until 20 images of each incidence angle were obtained. From those 20 images, the ten 10 best were chosen, added together and aligned with sub-pixel accuracy.
The locations of a series of adjacent cones within a 3×3 pixel region was identified and the average reflected intensity of each cone was measured and fitted using a least-mean square method. Figure 3.3 shows the location of each identified cone and respective orientation and orientation magnitude in relation to the cone group considered. The amount of disarray and how it is locally correlated can be easily observed.
16
Although cone disarray is observable, the measured disarray accounts for about only 5% of the total angular tuning spread, which concludes that measurements of the tuning function of a group of cones, independently of its size, should be almost identical to the effective tuning function of a single cone.
3.2 Ultra-small spot size scanning laser ophthalmoscopy
D. Rativa and B. Vohnsen developed a scanning laser ophthalmoscope (SLO), capable of resolving single cones with resort to beam spot sizes of ultra-small dimensions [31] and showed that individual cone directionality is more pronounced than the average directionality of an ensemble of cones [7].
In order to resolve single cones in the retina with an SLO, beam spot sizes must be of the order of magnitude of individual cone diameters and incident along their respective axis, optimizing radiative transfer and light-coupling efficiency to the propagation modes of cones. A small confocal pinhole is also essential to avoid unwanted scattered light.
Smaller beam sizes may be accomplished by the use of smaller wavelengths, larger pupil sizes (with increased aberrations) or resorting to annular beams. In this work the last option was explored. By applying a circular stop to the beam centre, an annulus beam was produced. Adding this stop to the beam reduces the full width at half maximum (FWHM) of the point spread function (PSF) of the beam on the retina, as shown in figure 3.4, allowing for smaller beam spot sizes and consequently enhancing mode coupling in smaller cones.
17
The images are acquired at a rate of 47 fps by two scanners (one vertical and another horizontal) located at conjugated planes of the pupil. The eyes of the subjects were fixated at angles of 2.5º, 5º, 10º, 15º and 20º using a distant LED as a fixation target, and the directionality values obtained by acquiring the intensity values in steps of 0.35 mm along the pupil scan.
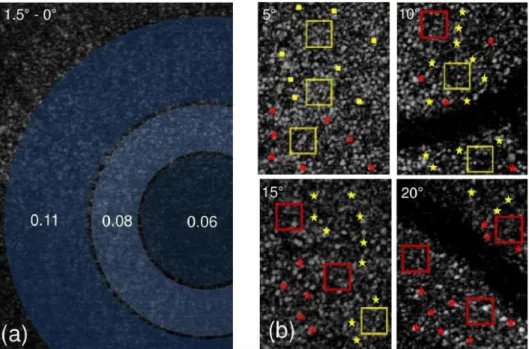
Due to the considerably small size of the cones at the fovea, individual cone directionality values cannot be reliably obtained for this region; therefore, average values were obtained for regions from 0º to 1.5º. For eccentricities larger than 2º, the assessment of individual directionalities becomes available. Directionality values ranging from 0.08 to 0.12 𝑚𝑚−2 were found at an eccentricity of 2.5º, increasing approximately threefold at eccentricities around 20º. However, when averaged across a small group of cones (boxes in Figure 3.5), the directionality obtained was around 0.14 mm−2, and if averaged across the whole image, the values fall to approximately 0.12 mm−2 at any of the measured eccentricities.
18
0.2
Retinal Images With Average and Individual Photoreceptor Directionality3.3 A layered scattering model of outer-segment
photoreceptor pigments
B. Vohnsen developed a model of the photoreceptor outer-segments based on stacked layers of photoreceptor pigments to study the electromagnetic interactions of pigments with light, showing the versatility of such models to study several properties of the retina, including its directionality [33].
OCT techniques have revealed that different directionality parameters may be found in different photoreceptor pigment cells along the photoreceptors axis, even without a directional filtering from waveguiding [9]. Such findings incite a more thorough study of the photopigment cell layers in photoreceptors and especially the electromagnetic interactions they undergo with light.
Although a variety of techniques allow photoreceptor visualization, this is made possible mainly due to the reflection of light on the high index mitochondria present in the inner-to-outer segments junction of the photoreceptors, therefore, no technique developed to date is actually able to image photopigment cells and give insight into its interactions with light.
In this work, two different models of the photoreceptors are presented, one macroscopic and another microscopic, those are illustrated in figure 3.6. Both models are based on a stack of photopigment layers where waveguiding is excluded allowing for diffraction beyond the
Figure 3.5 Retinal images and directionality values obtained for one of the subjects. a) Average directionalities for circular regions at 0.65º, 1º and 1.5º from the fovea. b) Individual directionalities for four different eccentricities – yellow box and yellow square: p = 0.10 - 0.15 mm−2; red box and red square: p = 0.15 - 0.20
19
photoreceptor walls, and optical reciprocity is assumed, which implies that the radiative properties of the model are proportional to its light gathering properties.
The macroscopic model is based on the fact that photopigment molecular density is very high and it may therefore be regarded as constant across each layer for far-field measurements. The photoreceptor is thus modeled has a stacked array of equidistant, parallel discs that are actually circular apertures, allowing for simpler calculations based on diffraction and paraxial light propagation.
The microscopic model takes into consideration single photopigment cells and the nanometric space they occupy. In this model, each molecule is considered as a light-induced point-dipole antenna that coherently emits and receives electromagnetic radiation. A full treatment of the electromagnetic interaction is therefore obtained, allowing for calculations in the vicinity of the photoreceptors and offering a greater insight into the electromagnetic role of individual photopigments in the process of vision.
Both models yield similar results at the pupil plane and show a good concordance with experimental data for photoreceptor directionality, revealing that the developed method may have important applications in the modelling of relevant questions regarding light-photoreceptor interactions, even though waveguiding is excluded. The obtained Stiles-Crawford functions further reveal a dependence on outer-segment diameter, length and on the wavelength of light.
21
4.
Work plan
This project builds up from the work of two Master’s students who developed a fundus camera with the purpose of imaging the vessels in the human retina.
In a first phase, the previously conceived setup was reassembled and modified with the aim of reducing the exposed area of the retina, obtaining a greater magnification and allowing the visualization of the cone mosaic in the parafovea with reasonable resolution.
Once an acceptable setup has been achieved, preliminary tests of the system were conducted in order to obtain optimum illumination and focus conditions with a minimal impact of aberrations and system reflections. High quality retinal images were obtained at this point.
23
5.
Camera Design Considerations
Some considerations must be taken into account when designing a fundus camera, some of those have already been introduced in a previous section of this dissertation in the context of a commercial fundus camera. In this section, such considerations are extended and analyzed in greater detail in the context of the present problem. These concerns became relevant as the project unfolded.
5.1 Optical Properties of the Eye
The human eye, already introduced in chapters 1 and 2, may be regarded as an intricate optical system comprising several optical elements: lenses, apertures, a light sensitive device and its own propagation media which forms a structure to hold everything in place.
Just like in any optical system, a myriad of different variables and characteristics of these optical elements influence the passage of light through the system and consequently its performance. This performance affects not only the image formation of the outer world inside of the eye, but also the opposite process of forming an image of its interior that is captured by an external imaging device.
5.1.1 Refractive elements
Two main elements form the refractive machinery of the eye: the cornea and the crystalline lens. When imaging the retina, one must take into consideration the fact that the object under study is not within direct reach, it lies instead behind these refractive elements that change the way light reaches it and is reflected from it. The total refractive power of the unaccommodated eye sums to approximately 60 D which translates to a focal distance of approximately 16.7 mm [34].
The cornea constitutes two thirds of the refracting power of the eye. It is an aspheric surface, flattening away from the vertex, made up of several layers with an average refractive index of 1.376 and a refractive power of approximately 42.2 D. The stroma, the main layer, constitutes 90% of the cornea and is composed of collagen lamellae disposed in regular arrays providing transparency and structure. The outer layer of the cornea, the tear film, forms an oily and aqueous coating that moistens and smoothens the rough surface of the cornea, maintaining its transparency; due to its considerably fast drying, frequent blinking is essential to maintain high image quality.
24
The second lens of the eye, the crystalline lens or simply lens, is responsible for the rest of the refracting work of the eye. Unlike the cornea, the lens is able to change its refracting power in order to focus on close objects. For the emmetropic eye, this power change ranges from 19 D, in an eye focused for infinity, to 30 D, if the eye focuses in an object 10 cm away from the cornea. This process is called accommodation, and it holds a major influence in the formation of an image of the retina outside the eye: the distance at which the eye is focusing is also the distance where an image of the retina will be formed.
The effect of the eye lenses may nonetheless be changed in some individuals. When this occurs, an eye is said to be ametropic or to have refractive error. This condition influences retinal image formation depending on the kind of refractive error: if an eye is myopic, either the fundus is elongated or the refractive power of the eye is abnormally increased, as a result a retinal image will always be formed closer to the eye instead of at infinity; on the other hand, if the eye is hypermetropic either its fundus is shortened or the refractive power of the eye is abnormally reduced and it will be required that the test subject accommodates in order to produce an image of the retina at infinity; finally, when an eye exhibits astigmatism, the refractive power of the eye lenses is different depending on its axis, forming a retinal image which displays a gradual blurring along one of the axis. Refractive errors may be corrected by the use of lenses that compensate the abnormal power of the eye, and they may be inserted in the experimental setup or used by the test subject as spectacles.
Another property of the cornea and lens that may be used advantageously in retinal imaging is the fact that the propagation of light inside them is dependent on the polarization, this property takes by the name of birefringence and it is due to the regular structures of these tissues. Thus, linearly polarized light entering the eye will exhibit a change in polarization when leaving it. This property may be exploited to reduce corneal reflections through the use of simple polarizer filters; this approach is explored in greater detail later in the text.
5.1.2 Aperture
The aperture stop of the eye is formed by the iris, it lies between the cornea and the crystalline lens; both the image of its aperture as formed by the cornea and the aperture itself are commonly called the eye pupil, nonetheless, the former is the one usually measured. As in other optical systems, the eye pupil controls the amount of light entering the eye: in response to high intensity levels the pupil constricts to a minimum of less than 2 mm in diameter and extends up to 8 mm in low light levels [34].
Just like for any other aperture, light passing through the eye pupil is diffracted, this means that the ability to resolve two points in an image is affected by the size of the pupil. Reducing the size of the pupil smears out the image of a single point, resulting in poorer resolution; on the other hand, increased pupil sizes reduce the effects of diffraction, relaying a less smeared out image of each point in the object resulting in improved resolution [35].
25
dependence, as the angle of the entrance of light into the eye increases the higher orders of the sine expansion in Snell’s Law start to have an effect and not all the light coming from a single point of the object will converge onto the same point in the image space, resulting in a blurred image. This is what is called optical aberration [36].
Diffraction and aberrations are a major source of image deterioration in retinal imaging. Figure 5.1 shows the effect of diffraction on the Airy disc in comparison with the effect of aberrations. The optimal diameter range that produces the best balance between diffraction and aberration effects is estimated between 2.5 and 3 mm, which occurs in bright light conditions [34].
Pupil diameter also influences the depth-of-field of the formed image. When an image is formed it shows only a plane of the object space in perfect focus, points of the object space in other planes are reproduced as defocused circles of confusion, causing blur. The range of distances in the object space which produce circles of confusion smaller than the sensor detecting units is called the depth-of-field. Larger pupil diameters result in faster increases of the circle of confusion with increasing distance from the optimal focus plane, which translates to a narrower depth-of-field; conversely, a smaller pupil diameter produces smaller circles of confusion and therefore greater depth-of-field. When imaging the retina, a small pupil will contribute to have several planes of the retina being in good focus, whereas a larger pupil will produce an image with good focus in fewer planes of the retina.
5.1.3 Sensitive Surface
The sensitive surface of the eye, the retina, has in the present problem the role of the object under study, constituting the object space. Composed of several physiological layers that absorb and reflect light in different ways, the retina exhibits a complex reflective response which depends mainly on the wavelength of light. Generally speaking, shorter wavelengths of light will penetrate less before experiencing reflexion, a reflexion which is also more specular in nature; whereas longer wavelengths of light will tend to go deeper into the layers of the retina and reflect more diffusely [35].
26
In the overall, the retina has greater reflectance for longer wavelengths, which may be partly explained by the fact that the cornea and lens absorb a considerable amount of the shorter wavelength light and in addition the most reflective layer of the retina, the retinal pigment epithelium, reflects mainly in the longer wavelength light provided that the visual pigments are bleached [34]. Figure 5.2 shows the reflectivity of the retina at different wavelengths as presented by several authors.
Reflectance around the wavelength of green light is also of particular interest in the present problem since two of the three types of cones have a greater sensitivity to green light (550 nm). Once bleached, those cones will show greater reflectance when using such wavelength of light, allowing for a cone selective reflectance of the fundus [38].
5.2 Eye motion
Eye motion is another major source of image degradation when imaging the retina. While imaging the retina, the subject is asked to keep his/her eye still, however, miniature eye movements are always present, these involuntary movements of the eye are necessary to overcome natural optical defects of the normal human eye and to correct the drifting from the target under fixation [39]. Two possible methods may help reduce the effect of these movements when imaging: devising a complex optical arrangement that counteracts these movements [39] or using very short acquisition times.
5.3 Illumination
When illuminating the retina, it is desirable to keep the illumination elements off axis, so that the retinal image formed in front of the eye may be captured. Nonetheless, the illumination and imaging beams must be made collinear as was already discussed. The illumination beam is therefore produced out of the line of sight of the subject and directed towards the eye afterwards. To do so, three different approaches were attempted during the
27
development of the camera, each differing on the optical element used to deviate the light towards the eye: a beam splitter, a mirror and a very thin optical fibre.
Other illumination concerns include the size, illuminance and uniformity of the illuminated region of the retina, the focusing of the eye, the existence of corneal reflections and the fact that it should be possible to choose a specific entrance point within the pupil to allow the required measurements of the Stiles-Crawford apodization curve.
5.3.1 Maxwellian Illumination
These aspects may be addressed by the use of Maxwellian view, an eye illumination method in which the light source is imaged onto the pupil plane, as shown in figure 5.3 [35].
By using a positive lens, a small image of the source may be produced in the pupil plane, which translates to a rather minute illumination spot on the pupil, ideal to undertake directionality measures by moving the source sideways and changing its entrance point across the pupil. In addition, corneal reflections are reduced and illumination conditions are independent of the eye's pupil size.
The fact that the source is imaged on the pupil plane and then spreads out uniformly, also allows the production of a bright and uniform illumination field on the retinal plane whose size, illuminance and focus can be independently controlled.
5.3.2 Illuminated Region
The size of the illuminated region of the retina may be specified in two ways: its area or its angular subtense at the pupil. The knowledge of the area is necessary to understand the relation between the size of the eye, focal lengths and the intensity of light used. On the other hand, angular subtense is independent of the optical properties of the eye, depending solely in external measurable parameters; such characteristic makes it the most widely used [35].
In Maxwellian view, the illuminated area, 𝑆𝑟, is determined by the areal magnification provided by the system eye/lens, scaled by an aperture stop placed at the retinal conjugal plane:
𝑆𝑟 = (𝑓𝑒/𝑓1)2 × 𝑆𝐴
28
Where 𝑓𝑒 is the focal of the eye, 𝑓1is the focal length of the Maxwellian lens and 𝑆𝐴 is the area of the aperture stop.
The angular subtense, 𝛼, may be computed by considering figure 5.3. The tangent of the half angular tense is equal to the ratio of the radius of the illuminated area and the focal length of the eye. By measuring the diameter of the aperture stop placed at a conjugal plane of the retina (it is impossible to directly measure the radius of the illuminated area of the retina), the angular subtense may be obtained:
𝑡𝑎𝑛(𝛼/2) = (𝑑/2)𝑓
𝑒
𝛼 = 2 × 𝑡𝑎𝑛−1(𝑑/2𝑓 𝑒)
Where 𝑑 is the diameter of the illuminated area on the retina or the diameter of the aperture stop.
The illuminated region of the retina is therefore mainly determined by aperture stops.
5.3.3 Illuminance
The light available in the system (the luminous flux 𝜙) is determined by the area of the source, its luminance, the aperture of the system and the focal length of the lens used [35]:
𝜙 = 𝑆𝑆𝐿𝑆𝑆𝐴/𝑓12
By dividing luminous flux by the illuminated area, the illuminance of the retina is obtained:
𝐸𝑅=𝑆𝜙
𝑅 = 𝑆𝑆𝐿𝑆/𝑓𝑒 2
As it can be seen, the illuminance of the retina depends only on the area of the source and its luminance, being independent from the aperture stops. By changing its area, both luminous flux and illuminated area change, canceling each other.
5.3.4 Eye Focus
The Maxwellian view method allows control of the focus of the eye. By placing a target after the light source one focal length away from the lens, at the retinal conjugate plane, the image of the target will be at infinity and a real image is produced at the retina of a non-accommodated emmetropic eye. On the other hand, by placing the target closer to the lens, a virtual image is produced and the subject will be required to accomodate in order to focus on this image. The focus of the eye may thus be changed according to necessity [35].
An alternative illumination method using a very thin optical fibre was briefly explored in this project. This is exposed in greater detail in another point of this dissertation.
5.3.5 Positioning the Subject
29
of a chin rest, a wax impression of the subject’s teeth (bite bar) or any other device that may help stabilize the movements of the head. This device should then be attached to a mechanism which allows accurate displacements in order to position the subject’s eye [35].
Once the subject’s head is stabilized, the centre of the eye pupil must be precisely positioned at the focal point of the source image, in order to establish the viewing system previously described. The first step is to position the eye at the right distance from the Maxwellian lens; to do so, the subject’s head is moved sideways at several distances close to the focal point, this will occlude the source image if the eye is in the wrong plane. When the correct plane is achieved, the image of the source will be seen by the subject as uniformly dimming, instead of being occluded on the sides. A second person, or the experimenter, may also help on locating this distance by observing the image of the source on the eye pupil while moving the person’s head closer or farther from the lens.
Following this process, the image of the source, or illumination spot, must be centered in the eye pupil. By displacing the head sideways such that the spot becomes occluded by the iris as seen by the subject, first to one side then the other, the horizontal centre of the pupil may be obtained as the centre between these two positions. By repeating the process vertically, the pupil may be centered.
5.4 Acquiring an Image
Once the retina is illuminated, its image will be formed by the lenses of the eye at the infinite outside the eye. One or more lenses are then required to focus this image onto an image sensor. A few concerns regard the development of this part of the system, these are discussed here.
5.4.1 Field of View and Magnification
How much of the image formed outside the eye is captured by the system is determined by the size of the lens following the eye and the distance between both. Figure 5.4 helps understand the concept.
30
The farther the lens is from the eye or the smaller its diameter, the smaller the angle of view will be. In order to more accurately quantify the dimension of this angle a similar expression to the angle of the illuminated region may be used:
𝛼 = 2 × 𝑡𝑎𝑛−1(𝑑/2𝑠)
Where now 𝑑 is the diameter of the lens, and 𝑠 the distance between the pupil and the lens.
An image will be formed at the focal distance of the lens. The magnification of this image may be approximated through the thin lens combination equation [36]:
𝑀 =𝑑(𝑠 𝑓1𝑠𝑖2
𝑜1− 𝑓1) − 𝑠𝑜1𝑓1
Where 𝑓1 is the focal length of the first lens (counting from the object towards the final image), 𝑠𝑖2 is the distance from the second lens to the image formed by it, 𝑑 is the distance between both lenses and 𝑠𝑜1 the distance from the object to the first lens.
In the present situation the first lens may be considered to be the lenses of the eye, the final image is formed by the second lens at its focal length and the distance from the object to the first lens is the focal length of the eye, therefore:
𝑓1= 𝑓𝑒 ; 𝑠𝑖2= 𝑓𝑙 ; 𝑠𝑜1= 𝑓𝑒
The magnification of the system ‘eye plus lens’ may thus be obtained by the ratio between the focal length of the lens used and the focal length of the eye:
𝑀 =𝑓𝑓𝑙
𝑒
Following this lens, a second lens may be desirable to increase magnification, to help changing the plane of focus in the retina or simply to refocus the retinal image enhancing its quality and allowing to view the whole image formed by the first lens.
This second lens will focus on the aerial image formed by the first and produce a new image whose magnification will depend on its distance from the aerial image, 𝑠𝑜 [36]:
𝑀2=𝑠 𝑓2 𝑜− 𝑓2
The total magnification is given by the product of both steps of magnification:
𝑀𝑇 = 𝑀1× 𝑀2
31
If the magnification is small enough so that the whole aerial image stays within the field of view of the second lens plus sensor, then the field of view of the system is given by the field of view of the first lens. This will not only allow to see the whole image formed by the first lens (which otherwise could prove impossible depending on sensor size) but also improve the quality (if the magnification is less than 1) since the same amount of light will be focused in a smaller area.
On the other hand, if the aerial image is not completely captured, then the new field of view must be calculated. Consider figure 5.6.
The angle 𝛽 may be obtained through an expression identical to angle 𝛼 with no second lens:
𝛽 = 2 × 𝑡𝑎𝑛−1(𝑑
𝑠/2𝑠𝑖2)
Once angle 𝛽 is known, 𝑑′ may be obtained:
𝑑′= 2. 𝑠
𝑜2. tan (𝛽/2)
This new diameter 𝑑′may now be used to compute the field of view:
Figure 5.5 Influence of magnification on the field of view. In the first case a smaller magnification is obtained and a greater one in the second
case. The vertical dashes represent the aerial image.
32
𝛼 = 2 × 𝑡𝑎𝑛−1( 𝑑′
2(𝑠𝑒+ 𝑠𝑖1))
5.4.2 Changing the focusing plane and magnification
The different layers of the retina lie within slightly different distances from the pupil, as a result, these layers are simultaneously imaged by the first lens at slightly different planes. By moving both the sensor and second lens back and forth, the second lens will be focusing on different aerial images, so that different planes of the retina will be focused by the system and different layers will be imaged, while keeping the magnification unchanged. If no second lens is used the same may be accomplished by moving the sensor alone.
If only the sensor is moved (considering two lenses are being used), the magnification will be modified with only a minor change of the plane under focus. This happens because when a lens is close to an object, the magnification will be increased by bringing it closer to the object; however, the displacement of the magnified image will be considerably larger than the displacement of the lens towards the object. This means that by moving the sensor alone away from the second lens for example, a magnified image of an aerial image slightly closer to the second lens will be acquired, and therefore a slightly more superficial layer of the retina will be imaged. Nonetheless, this change in the plane under focus is so small when compared with the increase in magnification, that it may be neglected.
We may in this case more easily obtain the magnification provided by the second lens by measuring the distance between the sensor and the second lens and applying the following expression [36]:
𝑀2=𝑠𝑖2𝑓− 𝑓2 2
5.5 Shielding
As previously mentioned the amount of light reflected from the retina is extremely small, therefore a sensor with a considerably high sensitivity is required in order to capture the image. This also means that any other source of light other than the retina will add background noise to the final image occluding the real retinal image.
33
5.6 Health and Safety
When working with light and real human eyes one must take into consideration the possible hazards to the health of the individuals being submitted to the experiment. These hazards may be divided into two main types depending on the underlying mechanism: thermal and photochemical [35].
Thermal damage to the eye basically means overheating or burning of the tissue due to absorption of light and its conversion to heat. Although it is predominant at longer wavelengths, it takes place over a wide range of the visible and IR spectrum regions, and is mainly dependent on the exposure duration being therefore a rate process with dependence upon the time-temperature absorption history of a volume of tissue as a whole. It also means longer exposure times will require a lower critical temperature to induce damage.
Photochemical damage is the loss of electrons by the molecular constituents of cells due to the absorption of light [40], resulting in the production of reactive radicals and free electrons with harmful consequences for the eye tissue. Unlike the thermal reactions, this kind of reaction is highly dependent on the wavelength of light and displays action spectra in the shorter wavelength and UV regions of the electromagnetic spectrum, which usually have a Gaussian-like shape with a full width at half height of less than 100 nm. An action spectrum is a curve describing the effectiveness of light in causing biological damage photochemically, depending on its wavelength. This process exhibits as well a characteristic reciprocity between the irradiance 𝐸 (W cm⁄ 2) and exposure duration 𝑡 (𝑠): 𝐻 = 𝐸. 𝑡; this value, 𝐻, the radiant exposure (J cm⁄ 2) may be used to express the injury threshold.
![Figure 2.2 Model of a cone photoreceptor used in waveguide theory computations [4].](https://thumb-eu.123doks.com/thumbv2/123dok_br/16539191.736656/25.893.279.656.415.649/figure-model-cone-photoreceptor-used-waveguide-theory-computations.webp)
![Figure 2.4 The region that the observer is able to see stays dark, while the light from the illuminated region is reflected towards the source [25]](https://thumb-eu.123doks.com/thumbv2/123dok_br/16539191.736656/29.893.215.708.569.752/figure-region-observer-stays-illuminated-region-reflected-source.webp)
![Figure 2.5 Diagram showing light entering the eye at the periphery of the pupil and leaving at its center [28]](https://thumb-eu.123doks.com/thumbv2/123dok_br/16539191.736656/30.893.284.635.107.330/figure-diagram-showing-light-entering-periphery-leaving-center.webp)
![Figure 3.1 Diagram of the optical system used. [29]](https://thumb-eu.123doks.com/thumbv2/123dok_br/16539191.736656/34.893.271.643.107.527/figure-diagram-optical-used.webp)
![Figure 3.6 Macroscopic and microscopic outer-segment models. [33]](https://thumb-eu.123doks.com/thumbv2/123dok_br/16539191.736656/39.893.164.770.452.712/figure-macroscopic-and-microscopic-outer-segment-models.webp)
![Figure 5.2 Spectral reflectance of the fundus from three different groups of authors [34]](https://thumb-eu.123doks.com/thumbv2/123dok_br/16539191.736656/46.893.304.616.263.576/figure-spectral-reflectance-fundus-different-groups-authors.webp)
