1
Universidade Federal de Ouro Preto, Centro Desportivo, Laboratório de Fisiologia do Exercício, Biomecânica e Desempenho Humano. R. Dois, 110, Ginásio Poliesportivo, Campus Universitário, 35400-000, Ouro Preto, MG, Brasil. Correspondência para/Correspondence to: EC OLIVEIRA. E-mail: <[email protected]>.
2
Universidade Federal de Ouro Preto, Escola de Nutrição, Departamento de Alimentos. Ouro Preto, MG, Brasil. 3
Universidade Federal de Ouro Preto, Instituto de Ciências Exatas e Biológicas, Departamento de Ciências Biológicas. Ouro Preto, MG, Brasil.
Support: Fundação de Amparo à Pesquisa do Estado de Minas Gerais (Process nºAPQ-01353-11) and Conselho Nacional de Desenvolvimento Científi co e Tecnológico (Process nºAPQ-474227/2011-1).
Article based on the thesis of EC OLIVEIRA, entitled “Estudo da expressão gênica de enzimas antioxidantes de animais em processo de recuperação nutricional e dos efeitos do exercício físico sobre o estresse oxidativo de animais desnutridos”. Universidade Federal de Ouro Preto; 2011.
Como citar este artigo/How to cite this article
Oliveira EC, Santos RC, Becker LK, Coelho DB, Pedrosa ML, Silva ME. Physical exercise improves body weight gain and liver function in malnourished rats without disturbing the redox balance. Rev Nutr. 2018;31(5):443-53. http://dx.doi. org/10.1590/1678-98652018000500002
Physical exercise improves body weight
gain and liver function in malnourished
rats without disturbing the redox balance
O exercício físico melhora o ganho de peso
corporal e a função hepática em ratos desnutridos
sem perturbar o balanço de redox
Emerson Cruz de OLIVEIRA1 0000-0002-8982-4705
Rinaldo Cardoso dos SANTOS2 0000-0002-5113-1962
Lenice Kappes BECKER1 0000-0002-9462-5719
Daniel Barbosa COELHO1 0000-0003-0346-492X
Maria Lúcia PEDROSA3 0000-0002-6128-1745
Marcelo Eustáquio SILVA2 0000-0001-5807-6778
A B S T R A C T
Objective
Methods
Thirty-two female Fischer rats were equally divided into Sedentary Control, Trained Control, Sedentary Malnourished and Trained Malnourished groups. The training protocol consisted of swimming for 30 minutes continuously for 5 days/week for 8 weeks.
Results
It was demonstrated that aspartate aminotransferase and alanine aminotransferase activities increased in malnourished rats, but physical training reversed these effects by lowering the raised levels. The glutathione level was diminished by malnourishment whereas physical training increased the levels of liver carbonyl protein and increased the levels of thiobarbituric acid reactive substances that were diminished by malnourishment. In addition, Trained Malnourished rats had a higher average body weight than Sedentary Malnourished ones (62.77g vs. 55.08g, respectively).
Conclusion
The data show that exercise was able to reverse or reduce damage caused by malnourishment, such as weight loss and liver dysfunction by a pathway independent of the participation of enzymes involved in antioxidant defense and that there is no interaction between exercise and malnutrition.
Keywords: Liver function. Malnourishment. Oxidative stress. Physical training.
R E S U M O
Objetivo
Estudar a relação entre exercício e desnutrição, pois evidências recentes sugerem que o exercício físico pode causar a adaptação benéfica de sistemas antioxidantes, enquanto a desnutrição pode causar adaptação prejudicial a esses sistemas.
Métodos
Trinta e duas ratas Fischer foram igualmente divididas nos grupos Controle Sedentário, Controle Treinado, Desnutrido Sedentário e Desnutrido Treinado. O protocolo de treinamento consistiu em nadar por 30 minutos continuamente por 5 dias/semana por 8 semanas.
Resultados
Demonstramos que as atividades de aspartato aminotransferase e alanina aminotransferase aumentaram em ratos desnutridos, mas o treinamento físico reverteu esses efeitos. O nível de glutationa foi diminuído pela desnutrição, enquanto o treinamento físico aumentou os níveis de proteína carbonilada do fígado e aumentou os níveis de substâncias reativas ao ácido tiobarbitúrico que foram diminuídas pela desnutrição. Além disso, os ratos desnutridos treinados tiveram um peso corporal médio maior que os desnutridos sedentários (62,77g vs 55,08g, respectivamente).
Conclusão
Os dados mostram que o exercício foi capaz de reverter ou reduzir os danos causados pela desnutrição, como perda de peso e a disfunção hepática por uma via independente da participação de enzimas envolvidas na defesa antioxidante e que não há interação entre exercício e desnutrição.
Palavras-chave: Função hepática. Desnutrição. Estresse oxidativo. Treinamento físico.
I N T R O D U C T I O N
Malnourishment in children immediately affects the dynamics of growth and development [1], a phenomenon also described in animal models [2]. As soon as food protein sources do not meet structural and functional needs, a
succession of adaptive mechanisms is triggered to preserve homeostasis. However, the persistence of malnourishment may be of such magnitude as to nullify the adaptation [1].
vitamin A and carotene are severely reduced [3]. Vitamins E and A were shown to be specifically related to the prognosis for and useful in the classification of malnourished children [4]. So, it is believed that antioxidant defense mechanisms suffer during periods of malnourishment.
Studying early life malnourishment is as important because the effects may be irreversible, as demonstrated in animal models [5,6] and as discussed for humans [7]. A reliable animal model of early life malnourishment would be an invaluable tool for understanding the potential mechanisms that result in growth and development retardation.
The benefits of physical activity practice for healthy subjects have been described over time and it is currently a major challenge to determine the minimum amount of exercise that can bring benefits to the ill ones.
We have used a model of malnourishment at birth, which can impair the growth and development of the animals, to examine, in animal model, how the minimum amount of exercise can influence the redox balance. We chose an easy training protocol to simulate a feasible exercise program for individuals suffering from malnourishment.
M E T H O D S
Diets and malnourishment protocol
Sixteen female Fischer rats weighing 175.56±29.05g (mean±Standard Deviation [SD]) were mated and monitored during pregnancy. On the day of parturition, the rats were divided into two groups. The first group (malnourished, n=12) received a low protein diet while the second group (control, n=4) received the AIN-93M diet [8]. Mothers and pups of both groups could feed ad libitum for 28 days, at which point weaning occurred and mothers were euthanized. Each group of pups was then subdivided into a trained group and a sedentary group.
The low protein diet was formulated by modifying the protein and cornstarch content of the AIN-93M diet. In each 1000g of diet, the control diet contained 142g of casein and 620.5g of cornstarch, whereas the low protein diet contained 60g of casein and 702.5g of cornstarch. These modifications maintain an equivalent protein concentration between the control diet and the standard AIN-93M formula while allowing ready adjustment of the casein content to obtain a low protein diet.
Food intake was measured by recording, in the last two weeks of experiment and for each cage, the amount of food offered to the animal, the food left in the feeder and the food that was wasted, which was carefully collected.
Groups and exercise training protocol
Thirty-two female pups were equally divided into four groups: Sedentary Control (SC; n=8), Trained Control (TC; n=8), Sedentary Malnourished (SM; n=8) and Trained malnourished (TM; n=8). The animals received filtered water and food ad libitum and were kept in a room with a 12/12h dark/light cycle and a temperature of 25±1ºC.
The pups started the training protocol in the beginning of the first week after weaning. The exercised animals were initially adapted to water at a temperature of 31±1ºC over a period of five days. On the first and second days, the animals were placed in a shallow pool for 30 min. On the third and fourth days, the animals swam for two 15-min intervals separated by a rest interval of 5 min in a pool 50cm deep. On the fifth day, they swam continuously for 30 min at the same depth. Following the adaptation period, the exercised animals swam continuously for 30 minutes in the 50-cm deep pool for 5 days per week for 8 weeks.
Euthanasia and sample preparation
Approximately 72 hours after the last training session and following 8 hours of fasting, the animals were weighed, pre-anesthetized with isoflurane and quickly euthanized by exsanguination. The skin of the animals next to a front limb was cut to allow localization of the brachial plexus. Animal procedures were approved by the Ethical Committee (opinion number 0036).
Blood was removed and centrifuged at 112G for 15 minutes to obtain serum and plasma, both of which were kept under refrigeration (-4ºC). All assays were performed within four days after euthanasia; the hemoglobin content was measured immediately after blood collection using 10µL of blood. Biochemical assays were performed according to the manufacturer’s instructions using kits obtained from Labtest Diagnóstica S.A. (Lagoa Santa, Minas Gerais, Brazil).
A small portion of the liver was cut, weighed, identified, flash frozen and kept at -80ºC prior to homogenization.
Serum assay methods
Labtest Diagnóstica S.A. kits were used to measure serum concentrations of total protein, albumin, hemoglobin and glucose (kit reference numbers 99, 19, 43 and 84, respectively). Labtest Diagnóstica S.A. kits were also used to determine Aspartate Aminotransferase (AST) and Alanine Aminotransferase (ALT) activities (kit reference numbers 52 and 53, respectively). The serum superoxide dismutase activity was assayed using Fluka kit 19160 (Buchs, St. Gallen, Switzerland). The concentration of Sulfhydryl groups (SH) was estimated using Ellman’s reagent [9].
Tissue assay methods
Total glutathione concentration (reduced glutathione + oxidized glutathione) in tissue homogenates was determined using Sigma Kit
CS0260 (Saint Louis, Missouri, United States). Catalase activity was determined according to reference [10]. Carbonyl proteins were measured according to the reference [11]. Thiobarbituric Acid Reactive Substances (TBARS) were measured according to the reference [12]. The total protein content of all tissues was determined according to the reference [13].
Statistical analysis
Data were analyzed by the D’Agostino & Pearson omnibus normality test and all parameters followed a normal distribution. Therefore, the comparison between groups was done using two-way Analysis of Variance (ANOVA), and differences were considered statistically significant for p≤0.05. Classification factors for ANOVA were malnourishment and physical training. If an interaction between the two classification factors was found, the mean value of each group was compared with all others by the Bonferroni post hoc multiple comparison test (p≤0.05). Unpaired t-test was applied to compare growth, weight gain and food intake. Analyses were performed using GraphPad Prism version 5.00 (Trial) for Windows, GraphPad Software (San Diego, California, United States). Results are expressed as means±Standard Error of the Mean (SEM).
R E S U L T S
Growth curve, body weights gain and food intake
and TC=58.44±8.62g with p=0.9668; SM=22.00±3.27g and T=21.20±2.88g with p=0.4834; unpaired t-test). During the experiment, animals were weighed weekly. After fifth week,
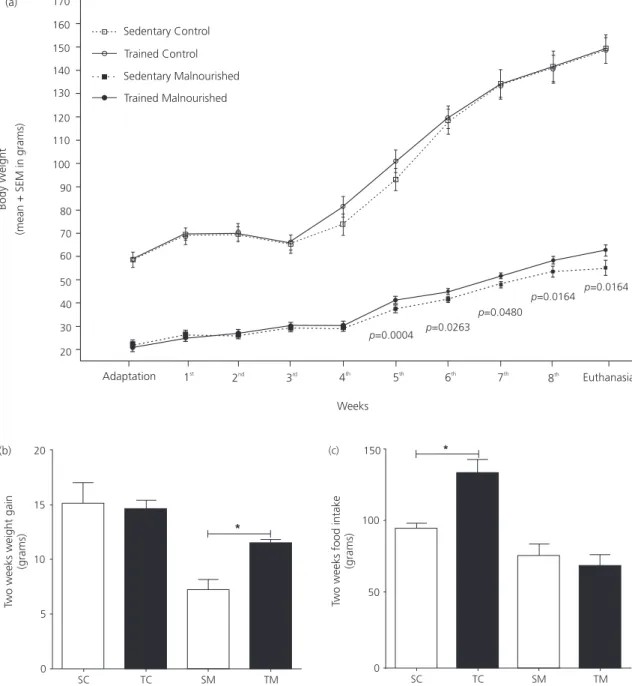
Figure 1. Growth, weight gain and food intake of trained and untrained control and malnourished rats. (a) After the fifth week,
trained malnourished animals have greater body weight than sedentary malnourished animals (p-value in the graphic-unpaired
t-test). No differences between sedentary control and trained control animals were observed during this period. (b) TM group have greater body weight gain at last two weeks (p=0.0015 - unpaired t-test). (c) TC group have greater food intake (p=0.0018 - unpaired t-test).
Note: SC: Sedentary Control; TC: Trained Control; SM: Sedentary Malnourished; TM: Trained Malnourished. All data are exposed as mean±Standard Error of the Mean (SEM).
the TM rats had greater body weight than the SM rats. Weight gain was higher in the TM than in the SM groups. Food ingestion was higher in the TC than in the SC groups (Figure 1).
170
160
150
140
130
120
110
100
90
80
70
60
50
40
30
20
Adaptation
Weeks
Euthanasia
Body W
eight
(mean + SEM in grams)
Sedentary Control
Trained Control
Sedentary Malnourished
Trained Malnourished
p=0.0004 p=0.0263
p=0.0480
p=0.0164
p=0.0164 (a)
1st 2nd
3rd
4th
5th
6th
7th
8th
* 20
15
10
5
0
Two weeks weight gain
(grams)
(b)
SC TC SM TM
Two weeks food intake
(grams)
150
100
50
0
*
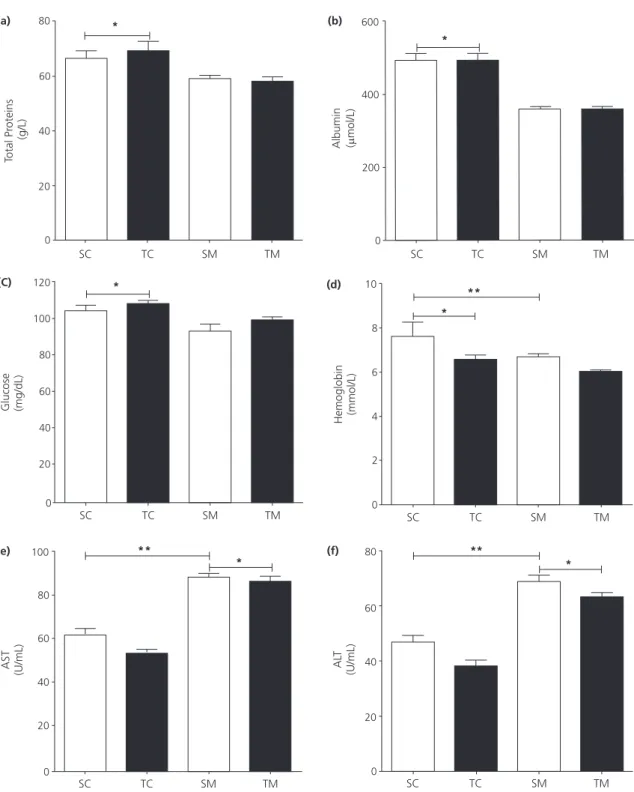
Figure 2. Serum analyses. (a) Total Proteins (*p<0.0014); (b) Albumin, (*p<0.0001); and (c) Glucose (*p=0.0012), differences in nutrition
factor (control bigger than malnourished. (d) Hemoglobin, differences in nutrition factor (control bigger than malnourished
*p=0.0406) and differences in training factor (sedentary bigger than trained **p=0.0161); (e) Aspartate aminotransferase (AST)
differences in nutrition factor (malnourished bigger than control *p<0.0001) and differences in training factor (sedentary bigger
than trained **p<0.0193); (f) Alanine aminotransferase (ALT) differences in nutrition factor (malnourished bigger than control *p<0.0001) and differences in training factor (sedentary bigger than trained **p<0.0033). Two-way analysis of variance. *Denotes
differences statistically significant for the factor nutritional status. **Denotes differences statistically significant for physical training
status. No interaction was found between the two classification factors (nutrition vs. training).
Note: SC: Sedentary Control; TC: Trained Control; SM: Sedentary Malnourished; TM: Trained Malnourished. All data are exposed as mean±Standard Error of the Mean (SEM).
80
60
40
20
0
Total Pr
oteins
(g/L)
(a)
SC TC SM TM
* 600
400
200
0
Albumin (mol/L)
SC TC SM TM
(b)
*
* 120
100
80
60
40
20
0 Glucose (mg/dL)
SC TC SM TM
(C)
SC TC SM TM
Hemoglobin (mmol/L) (d) 10
8
6
4
2
0
* **
100
80
60
40
20
0
AST
(U/mL)
(e)
SC TC SM TM
*
** 80
60
40
20
0 (f)
AL
T
(U/mL)
*
SC TC SM TM
Figure 3. Serum and liver analyses. (a) Superoxide dismutase (SOD), differences in nutrition factor (control bigger than malnourished
*p=0.0369); (b) Sulfhydryl, differences in nutrition factor (control bigger than malnourished *p=0.0263 and differences
in training factor (sedentary bigger than trained **p=0.0131; (c) Catalase, no differences; (d) Glutathione, differences in
nutrition factor (control bigger than malnourished *p<0.0001); (e) TARS, differences in nutrition factor (control bigger than
malnourished *p=0.0004 and differences in training factor (trained bigger than sedentary **p=0.0243); (f) Carbonyl Protein
differences in training factor (trained bigger than sedentary **p=0.0112. Two-way analysis of variance. *Denotes differences
statistically significant for the factor nutritional status. **Denotes differences statistically significant for physical training
status. No interaction was found between the two classification factors (nutrition vs. training).
Note: SC: Sedentary Control; TC: Trained Control; SM: Sedentary Malnourished; TM: Trained Malnourished. All data are exposed as mean±Standard Error of the Mean (SEM).
100
80
60
40
20
0
Serum SOD
(%)
(a)
SC TC SM TM
*
SC TC SM TM
400
300
200
100
0
Serum Sulfhydryl
(
mol/L)
(b)
*
* *
Liver Catalase
(U/mg of pr
otein)
(c) 4
3
2
1
0
SC TC SM TM
25
20
15
10
5
0
Liver Glutathione
(nmoles/mL)
(d)
*
SC TC SM TM
SC TC SM TM
Liver TBARS
(nmol/mg of pr
otein)
(e) 0.8
0.6
0.4
0.2
0.0
*
** * *
SC TC SM TM
2.0
1.5
1.0
0.5
0.0
Liver Carbonyl Pr
otein
(nmol/mg of pr
otein)
Protein and glycemic profiles and hepatic function
The concentrations of total protein, albumin, glucose and hemoglobin decreased in malnourished animals. Physical training only influenced the levels of hemoglobin, which decreased in trained animals. The activities of AST and ALT were increased, in malnourished animals. Physical training reversed these effects (Figure 2).
Serum antioxidants
The concentration of SOD was decreased in malnourished animals and physical training did not influence this parameter. Malnourishment also reduced the concentration of total sulfhydryl; physical training similarly produced a decrease (Figure 3).
Antioxidants and oxidative stress in the liver
Catalase activity was not affected either by malnourishment or by training. Total glutathione was diminished in malnourished animals. The level of TBARS was lower in the malnourished animals, physical training similarly produced a decrease. The concentration of carbonyl protein in the liver was not altered by malnourishment, physical training, however, resulted in an increase of carbonyl protein (Figure 3).
D I S C U S S I O N
In our experiment, animals that were malnourished from birth exhibited delayed growth and development, as shown by the evolution of body weight data (Figure 1). These results are consistent with previous observations that a low protein diet does not support normal growth in rats [14]. However, our data also show that exercise, reduced the effect of malnourishment
on body weight; the TM animals displayed a higher body weight than the SM animals. Our observations corroborate those made using an animal model [14] or humans [15]. The increase in weight and weight gain generated by exercise could have been explained by the increase in food intake, but SM and TM groups show no differences in food intake (Figure 1).
Our malnourished rats displayed reduced levels of serum protein, glucose, albumin and hemoglobin. Hypoproteinemia and hypoalbuminemia are common features of protein malnourishment, however was previously demonstrated that physical training improved the serum protein and albumin levels of malnourished rats [14]. These authors suggest that as well as producing positive effects on body growth, physical exercise may also play a beneficial role in protein metabolism in malnourished rats. Our training protocol differs from that [14] ours was proposedly easier; the difference in exercise regimes may explain the absence of differences.
In malnourished animals, the reduction in serum albumin content may result from depletion in amino acid precursors of albumin synthesis. The amino acids are released from exaggerated tissue breakdown during hepatobiliary disorder [16]. To metabolize these amino acids the activity of the related enzymes AST and ALT is increased. So, the increases in AST and ALT that we observed in our malnourished animals would be explained.
We observed that malnourished animals exhibited hypoalbuminemia, which explains the low levels of SH groups in the serum of these animals, because the largest source of SH in the body is albumin. Similarly, the SOD reduction could be explained by hypoproteinemia.
superoxide radicals with enzymes such as superoxide dismutase (SOD). SOD, together with other enzymes such as catalase and glutathione reductase, helps maintain the concentrations of glutathione and Nicotinamide Adenine Dinucleotide Phosphate (NADPH) required for the optimal function of antioxidant defense mechanisms [17].
In this experiment we show a reduction of SOD in serum of malnourished animals, so the classic signals of malnourishment (i.e. hypoalbuminemia and hypoproteinemia) are together with an undesirable disturbing in redox balance.
It has been demonstrated that levels of lipid peroxidation are increased in muscle fibers of rats subjected to physical training [18]. Our results show that the liver also can exhibit these increases in malnourished exercised animals. An explanation is that most hepatic lesions are calcium-dependent and interact with cytochrome P450, promoting the formation of metabolites and free radicals which can be highly toxic to cells [19,20]. These free radicals bind covalently to critical points of the cell membrane of hepatocytes, disrupting the cytoskeleton and altering mitochondrial morphology and functionality [21]. We believe that this cascade of reactions could explain the decreased level of liver glutathione and the raised levels of liver carbonyl proteins caused by malnourishment. Placed all together these events could indicate a liver dysfunction produced by malnourishment and a participation of an antioxidant system in these processes to try to minimize the deleterious effects.
To protect tissues against damage caused by radicals produced during exercise, the antioxidant enzymes SOD and catalase seem to respond in an adaptive manner. The activities of these enzymes are increased in the tissues and organs of trained animals [22] and humans [23], particularly in those individuals undergoing endurance-type training [24]. Our training did not increase the activity of these enzymes,
perhaps because of the low volume and low intensity of the exercise.
One significant difference between the metabolism of peroxides by Glutathione Peroxidase (GPX) and Glutathione S-Transferase (GST) is that glutathione molecule functions only as a reducing equivalent for GPX. The oxidized glutathione generated by GPX is reduced by a partner enzyme, Glutathione Reductase (GR), resulting in zero net consumption of glutathione. In contrast, GST produces a glutathione conjugate, resulting in a net consumption of glutathione. When selenium is deficient, GPX activity will be low and peroxides will be predominantly metabolized by GST. The resulting drain on reduced glutathione will lead to greatly increased glutathione synthesis, potentially producing a sulfur amino acid deficiency [3]. The glutathione status of the malnourished child will therefore be crucial to his ability to withstand oxidative stress. The question is whether the glutathione concentration in ours malnourished animals is low primarily because of increased glutathione consumption or because of a deficiency in the cysteine, glycine or total nitrogen needed to synthesize glutathione. This is a serious limitation of this work.
Our data did not show an interaction between malnourishment and physical training for enzymatic system or markers of oxidative stress. The improvement generated by training in the liver, does not appear to be associated with a modification of redox balance generated by exercise.
Factors that can reverse this liver disorder are important targets for study. This process can be initiated by early malnourishment and our results demonstrate that an exercise protocol was able to improve the outcome for malnourished animals, even if only in minimizing the activities of AST and ALT.
C O N C L U S I O N
such as weight loss and liver dysfunction by a pathway independent of the participation of enzymes involved in antioxidant defense and that there is no interaction between exercise and malnutrition. More studies should be carried out to elucidate the possible mechanisms involved with the improvement generated by physical exercise in parameters affected by malnourishment in rats.
C O N T R I B U T O R S
EC OLIVEIRA and ME SILVA participated of the study conception and design. EC OLIVEIRA, LK BECKER and DB COELHO collaborated with data analysis and interpretation. EC OLIVEIRA, RC SANTOS, ML PEDROSA and ME SILVA participated of the article writing and review. RC SANTOS collaborated with translation. All authors approved the final version.
A C K N O W L E D G M E N T S
Pró-Reitoria de Pesquisa e Pós-Graduação (PROPP)
da Universidade Federal de Ouro Preto, (Edital PROPP 07/2018).
R E F E R E N C E S
1. Torun B, Chew F. Protein-energy malnutrition. In: Shils M, Olson JA, Shike M, editors. Modern nutrition in health and disease. Philadelphia: Lea and Febiger; 1994.
2. Reichling TD, German RZ. Bones, muscles and visceral organs of protein-malnourished rats (Rattus norvegicus) grow more slowly but for longer durations to reach normal final size. J Nutr. 2000;130(9):2326-32. http://dx.doi.org/10.1093/ jn/130.9.2326
3. Golden MH, Ramdath D. Free radicals in the pathogenesis of kwashiorkor. Proc Nutr Soc. 1987;46(1):53-68.
4. McLaren DS, Faris R, Zekian B. The liver during recovery from protein-calorie malnutrition. J Trop Med Hyg. 1968;71(11):271-81.
5. Venkatachalam PS, Ramanathan KS. Effect of protein deficiency during gestation and lactation
on body weight and composition of offspring. J Nutr. 1964;84(1):38-42. http://dx.doi.org/10.1093/ jn/84.1.38
6. Winick M, Noble A. Cellular response in rats during malnutrition at various ages. J Nutr. 1966;89(3):300-6. http://dx.doi.org/10.1093/jn/89. 3.300
7. Martin HP. Nutrition: Its relationship to children’s physical, mental, and emotional development. Am J Clin Nutr. 1973;26(7):766-75. http://dx.doi. org/10.1093/ajcn/26.6.766
8. Reeves PG, Nielsen FH, Fahey Junior GC. AIN-93 purified diets for laboratory rodents: Final report of the American Institute of Nutrition ad hoc writing committee on the reformulation of the AIN-76A rodent diet. J Nutr. 1993;123(11):1939-51. http://dx.doi.org/10.1093/jn/123.11.1939 9. Sedlak J, Lindsay RH. Estimation of total,
protein-bound, and nonprotein sulfhydryl groups in tissue with Ellman’s reagent. Anal Biochem. 1968;25(1):192-205.
10. Aebi H. Catalase in vitro. Method Enzymol. 1984;105:121-6.
11. Levine RL, Williams JA, Stadtman ER, Shacter E. Carbonyl assays for determination of oxidatively modified proteins. Method Enzymol. 1994;233:346-57.
12. Buege JA, Aust SD. Microsomal lipid peroxidation. Method Enzymol. 1978;52:302-10.
13. Lowry OH, Rosebrough NJ, Farr AL, Randall RJ. Protein measurement with the folin phenol reagent. J Biol Chem. 1951;193(1):265-75. 14. Galdino R, Almeida CCS, Luciano E, Mello MAR.
Protein malnutrition does not impair glucose metabolism adaptations to exercise-training. Nutr Res. 2000;20:527-35. http://dx.doi.org/10.1016/ S0271-5317(00)00144-5
15. Torun B, Viteri FE. Influence of exercise on linear growth. Eur J Clin Nutr. 1994;48(Supl.1):S186-9. 16. Kumari R, Rao YN, Talukdar B, Agarwal S, Puri RK.
Serum enzyme abnormalities in protein energy malnutrition. Indian Pediatr. 1993;30(4):469-73. 17. Bhattacharya S. Reactive oxygen species and
cellular defense system. In: Rani V, Yadav UCS. Free radicals in human health and disease. New Delhi: Springer India; 2015. http://dx.doi.org/10. 1007/978-81-322-2035-0_2
18. Alessio HM. Exercise-induced oxidative stress. Med Sci Sports Exerc. 1993;25(2):218-24.
20. Nishikawa Y, Ukida M, Matsuo R, Omori N, Tsuji T. Ca2+ influx initiates death of hepatocytes injured by
activation of complement. Liver. 1994;14(4):200-5. 21. Nicotera P, Bellomo G, Orrenius S. The role of Ca2+
in cell killing. Chem Res Toxicol. 1990;3(6):484-94. 22. Pereira B, Costa Rosa LF, Safi DA, Medeiros MH,
Curi R, Bechara EJ. Superoxide dismutase, catalase, and glutathione peroxidase activities in muscle and lymphoid organs of sedentary and exercise-trained rats. Physiol Behav. 1994;56(5):1095-9.
23. Jenkins RR1, Goldfarb A. Introduction: Oxidant stress, aging, and exercise. Med Sci Sports Exerc. 1993;25(2):210-2.
24. Reddy Avula CP, Fernandes G. Modulation of antioxidant enzymes and lipid peroxidation in salivary gland and other tissues in mice by moderate treadmill exercise. Aging. 1999;11(4):246-52.