Universidade de Brasília
Instituto de Ciências Biológicas
Departamento de Biologia Celular
Programa de Pós-Graduação em Biologia Microbiana
PERFIL TAXONÔMICO E FUNCIONAL
MICROBIANO EM AMBIENTES AQUÁTICOS
Fabyano Alvares Cardoso Lopes
2
Universidade de Brasília
Instituto de Ciências Biológicas
Departamento de Biologia Celular
Programa de Pós-Graduação em Biologia Microbiana
PERFIL TAXONÔMICO E FUNCIONAL
MICROBIANO EM AMBIENTES AQUÁTICOS
Fabyano Alvares Cardoso Lopes
Orientador:
Dr. Ricardo Henrique Krüger
Co-orientador estrangeiro:
Dr. Rob Edwards
Tese apresentada ao Programa de Pós-Graduação em Biologia Microbiana da Universidade de Brasília, como requisito parcial para obtenção do título de Doutor em Biologia Microbiana
3
Trabalho realizado nos seguintes laboratórios: Laboratório de Enzimologia,
Departamento de Biologia Celular do Instituto de Ciências Biológicas da
Universidade de Brasília (UnB), Brasília, DF, Brasil; Laboratório de
Oceanografia, Departamento de Biologia Marinha, Universidade Federal do
Rio de Janeiro (UFRJ), Rio de Janeiro, RJ, Brasil; Bioinformatics Lab,
Department of Computer Science, San Diego State University (SDSU), San
Diego, CA, Estados Unidos da América.
Orientador:
Dr. Ricardo Henrique Krüger
Co-orientador estrangeiro: Dr. Rob Edwards
Banca Examinadora:
Prof. Dr. Alexandre Siqueira Guedes Coelho (UFG) – Examinador Externo Profa. Dra. Cristine Chaves Barreto (UCB) – Examinadora Externa
Prof. Dr. Georgios Joannis Pappas Júnior (UnB) – Examinador Interno Prof. Dr. Helson Mario Martins do Vale (UnB) – Examinador Interno Prof. Dr. Ricardo Henrique Krüger (UnB) – Orientador
Membro Suplente:
4
“Knowledge, like air, is vital to life.
Like air, no one should be denied it.”
5
Agradecimentos
Gostaria de agradecer primeiramente à minha esposa, amiga, companheira Amanda Rafaela. Você foi fundamental em tudo que conquistei até hoje em toda a minha vida. Você esteve comigo por toda a minha caminhada, desde o incentivo para a minha escolha por cursar Ciência Biológicas até a minha travessia por essa etapa tão árdua que é o doutorado. Amanda, você sempre foi, é e será a pessoa mais importante na minha vida. Obrigado, meu bem! Eu te amo.
Agradeço a toda minha família, sempre tão presente, tão amiga, tão preocupada comigo, pessoas que deram o suporte para eu atingir meus objetivos, me apoiando sempre, independente do horário, do clima ou até mesmo da distância entre Goiânia- Brasília-San Diego. Irmão, cunhadas (os), primos, tios, avós, sogros, aqui está o meu muitíssimo obrigado. Pais, muito obrigado por tudo, amo vocês!
Agradeço a todos os integrantes do Laboratório de Enzimologia-UnB, vocês deixaram minha vida muito mais feliz! Em especial quero agradecer ao grupo Metagenômica, todos vocês foram muito especiais em minha vida, me acolheram, me fizeram sentir em casa, mais do que isso, me adotaram como um integrante dessa família tão carinhosa e preocupada um com o outro. Obrigado!
Agradeço a todos os meus amigos, em especial, Andrei e Marcelo, companheiros que compartilhei vários momentos nessa caminhada, dando a força necessária para seguir sempre em frente, além de oferecerem opiniões amigas para o meu bem. Agradeço ao JP (meu eterno pupilo) que apesar da maioria das vezes parecer não falar nada sério, é uma pessoa extremamente leal, íntegra e sábia e ao Alonsito pela sua amizade. Obrigado danados!
Agradeço à Elisa, pessoa que se tornou mais do que uma amiga, uma irmã. Você sabe que nenhum trabalho que faço está completo sem você! Obrigado por ser minha amiga.
6 grande sereno Geni. Meu velho, sou muito feliz por ter te encontrado, irmão. Obrigado por tudo que fez e que continua fazendo por mim.
Um agradecimento em especial aos meus orientadores Dr. Ricardo Henrique Krüger e Dr. Rob Edwards por terem me acolhido e me oferecido condições de trabalho para mostrar o meu melhor, além de terem contribuído ao meu crescimento científico. Ao Dr. Fabiano L. Thompson, parceiro de trabalho que ofereceu toda a estrutura de seu laboratório, sempre acreditando no meu potencial. Ao prof. Cirano José Ulhoa que sempre me apoiou no meu processo de formação, e novamente reitero, espero me tornar um décimo do que você é profissionalmente, pois você sempre será meu modelo de pesquisador.
7
ÍNDICE
LISTA DE FIGURAS ... 10
LISTA DE TABELAS ... 13
RESUMO GERAL ... 14
GENERAL ABSTRACT ... 15
INTRODUÇÃO ... 16
Ecologia microbiana e técnicas aplicadas ao estudo da diversidade microbiana ... 16
Metagenômica ... 18
Metagenômica em ambientes aquáticos ... 19
Água do mar ... 19
Poças de maré ... 21
Água doce ... 21
Rio Paraguaçú ... 23
OBJETIVO GERAL E ESTRUTURA DA TESE ... 25
Referências Bibliográficas ... 26
CAPÍTULO 1 - Microbial community profile and water quality in a protected area of the Caatinga biome ... 32
Abstract ... 35
Introduction ... 36
Materials and methods ... 37
Ethics statement ... 37
Study area and sample collection ... 37
Physicochemical and microbial abundance analyses ... 39
Metagenomic DNA extraction... 41
Polymerase chain reaction, 16S rRNA gene amplicon sequencing, and sequence analysis ... 41
8
Accession numbers ... 45
Results ... 45
Inorganic and organic compounds and microbial cell count ... 45
Microbial community structure ... 50
Functional classification of metagenome data... 54
Discussion ... 58
Acknowledgments ... 62
References ... 63
Supporting information ... 69
CAPÍTULO 2 - Functional and Taxonomic Description of the Microbial Community from Ocean Beach Tide Pool Area (San Diego, CA) ... 83
Abstract ... 85
Introduction ... 86
Materials and Methods ... 86
Study area and samples collection ... 86
DNA extraction, metagenome sequencing, and sequence analysis ... 87
Functional and taxonomic diversity of tide pools ... 89
Other metagenome data ... 89
Results ... 89
Tide pool microbial profiles ... 89
Clustering of tide pool, sea, and freshwater metagenomes ... 92
Taxonomic and functional diversity of tide pool, sea, and freshwater metagenomes ... 96
Comparison of tide pool, sea, and freshwater metagenomes ... 97
Discussion ... 100
Conclusion ... 102
Acknowledgments ... 103
9
Supporting information ... 109
CONSIDERAÇÕES FINAIS ... 115
ARTIGOS E CAPÍTULOS PUBLICADOS DURANTE O DOUTORADO ... 116
10
LISTA DE FIGURAS
CAPÍTULO 1 - Microbial community profile and water quality in a protected area of the Caatinga biome
Fig.1. Study area. ... 39 Fig. 2. Principal component analysis (PCA) of the physicochemical parameters and bacterial community of Paraguaçú River water samples obtained from three sites (P1, unprotected area; P2 and P3, protected areas) during both wet and dry seasons. ... 46 Fig. 3. Taxonomic classification based on sequence analysis of 16S rRNA genes detected in Paraguaçú River water samples obtained from three sampling points (P1, unprotected area; P2 and P3, protected area) during both wet and dry seasons. ... 51 Fig. 4. Functional diversity of the Paraguaçú River’s metagenomes (P1, unprotected area; P2 and P3, protected area) in both wet and dry seasons. ... 54 Fig.5. Comparative analysis of pesticide-related genes in Paraguaçú River water samples obtained in the wet season. ... 56 Fig. 6. Comparative analysis of pesticide-related genes in Paraguaçú River water samples obtained in the dry season. ... 57
11 S8 Fig. Functional diversity of the Paraguaçú River’s metagenomes in both wet and dry seasons.. ... 73 S9 Fig. Comparative analysis of functional profiles of Paraguaçú River water samples obtained in the wet season.. ... 74 S10 Fig. Comparative analysis of functional profile of Paraguaçú River samples obtained in the dry the season.. ... 75 S11 Fig. Satellite image of the study area. ... 76 S12 Fig. Functional diversity of the Paraguaçú River’s metagenomes in samples obtained from an unprotected area (P1) and protected areas (P2 and P3) in both wet and dry seasons.. ... 77
CAPÍTULO 2 - Functional and Taxonomical Description of Microbial Community from Ocean Beach Tide Pool Area (San Diego, CA)
Fig. 1. Species and functional classification based on all tide pool metagenomes.. ... 90 Fig. 2. Principal component analysis (PCA) of relative species abundances from the tide pool, seawater, and freshwater metagenomes. ... 92 Fig. 3. Principal component analysis (PCA) of relative abundances of functional content (SEED database level 3 classification) from tide pool, seawater, and freshwater metagenomes. ... 94 Fig. 4. Taxonomic and functional diversity indices of tide pool metagenomes compared with those of seawater and freshwater metagenomes. ... 96 Fig. 5. Comparative analysis (SEED level 1 classification) of tide pool metagenomes with seawater and freshwater metagenomes... 98
13
LISTA DE TABELAS
CAPÍTULO 1 - Microbial community profile and water quality in a protected area of the Caatinga biome
Table 1. General features of water samples obtained from sites on the Paraguaçú River. ... 47 Table 2. Results of freshwater metagenomics studies. ... 48
S1 Table. Number of sequences obtained by metagenome sequencing. ... 78 S2 Table. Metal, sulfur, and phosphorus concentrations of sediments in water samples from the Paraguaçú River.. ... 79 S3 Table. Relative abundance of OTUs and sequence information of Paraguaçú River microbiota. ... 80 S4 Table. Diversity indices of water samples obtained from the Paraguaçú River at 3% dissimilarity for the 16S rRNA gene. ... 81 S5 Table. Relative abundance of OTUs and sequence information of Paraguaçú River metagenome.. ... 82
CAPÍTULO 2 - Functional and Taxonomical Description of Microbial Community from Ocean Beach Tide Pool Area (San Diego, CA)
Table 1. Source of metagenomic DNA from the tide pool area and number of sequences obtained by metagenome sequencing.. ... 87
14
RESUMO GERAL
A mensuração da diversidade microbiana é um dos maiores desafios do campo microbiológico, principalmente por problemas metodológicos. Com o avanço de novas metodologias foi possível observar que a diversidade de microrganismos era maior do que se pensava, assim, possibilitando o estudo desse conjunto de microrganismos. O estudo dos genomas de diversos microrganismos contidos em um dado ambiente é denominado de metagenômica. A metagenômica pode ser utilizada para o estudo de diversos tipos de ambientes, como solo, ar, corpo humano, intestino de cupim, entre outros. Dentro dos ambientes estudados pela metagenômica, o ambiente aquático vem sendo alvo de diversos estudos. Apesar de apresentar diversos estudos descrevendo diferentes profundidades e até mesmo diferentes hábitats (esponja, corais por exemplo), ainda existem inúmeros hábitats no ambiente marinho que ainda não possuem estudos focados sobre a microbiota. Diferente do ambiente marinho, trabalhos focados na descrição da microbiota de água doce são escassos. Além disso, apesar de toda sua importância ecológica, diversos desses corpos d’água estão sendo perturbados por atividades antropogênicas, levando à alteração da microbiota. Alguns trabalhos focaram na detecção de biossensores capazes de detectar impactos antropogênicos no meio ambiente. O objetivo de presente trabalho foi contribuir na descrição da comunidade microbiana em ambientes aquáticos. Para atingir essa meta foram realizados dois estudos, o primeiro estudo foi realizar a análise taxonômica e funcional da comunidade bacteriana do rio Paraguaçú na estação de chuva e seca, além de avaliar o efeito de proteção do Parque Nacional da Chapada Diamantina (PNCD) sobre a qualidade da água e da diversidade da microbiota do rio Paraguaçú. Outro estudo realizado foi o primeiro trabalho metagenômico focado em poças de maré. Esse trabalho deu enfoque na descrição do perfil taxonômico e funcional da microbiota das poças de maré situados em Ocean Beach, San Diego, CA, EUA. Ambos ambientes trabalhados possuem um grande potencial biotecnológico e se apresentaram como fundamentais na determinação do perfil da microbiota encontrada. No rio Paraguaçú foi possível observar uma predominância de genes relacionados à degradação de pesticidas (como o Benzoato), enquanto nas poças de maré foi possível observar uma maior abundância de genes relacionados à tolerância a ambientes com alta concentração salina. Novos estudos devem ser realizados para ambos ambientes buscando elucidar melhor os processos que ocorrem nesses ambientes.
15
GENERAL ABSTRACT
Determining the true diversity in a microbial community is one of the biggest challenges in microbiology. The development of new techniques has revealed a higher microbial diversity than what was previously thought and provided a new way to study these organisms. Metagenomics, the study of microbial DNA recovered from specific environments, allows the study of microbial communities in soil, air, human body, and termite gut. Among the environments studied using this approach, water is one of the most important. Each of the two types of water environments (seawater and freshwater) has a specific microbial community. Although previous studies have described microbial communities in different water layers and habitats (e.g. sponge, coral), the microbial communities of several seawater habitats have not been studied, and studies describing microbial communities in freshwater environments are rare. Moreover, ecologically important freshwater environments are being disturbed by anthropogenic activity, which can change the microbial profile. Previous studies have focused on identifying biosensors that can detect anthropogenic impacts on the environment. The aim of this work was to characterize the microbial communities in two water environments, and this objective was developed in two separate studies. The first described taxonomic and functional analyses of the bacterial community in the Paraguaçú River during both wet and dry seasons. Additionally, we evaluated the protective effect of Parque Nacional da Chapada Diamantina (PNCD) on water quality and microbial diversity in this river. The second study was the first metagenomic study of tide pools, in which we described the taxonomic and functional profiles of microbial communities in tide pools at Ocean Beach, San Diego, CA, USA. Both studies describe environments with great biotechnological potential and showed themselves as fundamental factors shaping the microbial communities. For example, in the Paraguaçú River we observed a high abundance of genes encoding enzymes capable of degrading pesticides such as emamectin benzoate, whereas tide pools showed a high abundance of halotolerance genes. Further studies are needed to elucidate processes in both environments.
16
INTRODUÇÃO
Ecologia microbiana e técnicas aplicadas ao estudo da diversidade microbiana
Os microrganismos estão inseridos no ecossistema que possui diversos hábitats. Hábitat é um dado ambiente compostos por fatores abióticos e bióticos [1], sendo que cada hábitat possui características intrínsecas que são fundamentais na determinação de qual microrganismo o habitará. Assim, certos fatores são cruciais para seleção de microrganismos que irão colonizar um determinado hábitat: nutrientes disponíveis e fatores ambientais (salinidade, pH, temperatura, etc) associados a esse hábitat. Caso a disponibilidade de nutrientes e os fatores ambientais forem favoráveis para diversos microrganismos, isso dará origem a diversas populações originando uma comunidade. A diversidade de microrganismos, além de como se relacionam inter e intraespecificamente e com o ambiente que estão inseridos são estudados na ecologia microbiana [2].
Dentro da ecologia microbiana, existem dois conceitos que mensuram a microbiota de um hábitat, são eles: riqueza e abundância [2]. O conceito de riqueza está relacionado com o número de espécies em um dado local. A riqueza pode ser mensurada numericamente através do índice de diversidade, como o índice de Shannon [3] ou índice de Simpson [4], por exemplo, que possibilita a comparação entre diferentes amostras. Porém, diferente do conceito de riqueza de espécies, o conceito de abundância está vinculado a contribuição de uma espécie em uma comunidade, ou seja, é a proporção em número de indivíduos de uma dada espécie.
17 Inúmeras técnicas podem avaliar a diversidade microbiana, seja diversidade taxonômica ou funcional que podem ser de baixa, intermediária e alta resolução. Dentro das técnicas de baixa resolução, a observação direta da amostra por microscopia consegue oferecer uma noção dos microrganismos presentes em termos morfológicos, além de fornecer o número de microrganismos presentes com uma certa precisão. Outra técnica de baixa resolução é o método de reassociação de DNA da comunidade microbiana, onde a estimativa da diversidade procariótica é dada pela porcentagem de DNA que é renaturada após a desnaturação do DNA da comunidade microbiana, ou seja, quanto menor o teor de DNA renaturado, mais diversa é a amostra, porém a composição da comunidade não é acessada [6,7].
Existem outros métodos de baixa resolução que se baseiam em marcadores bioquímicos como a análise de ácidos graxos. Na análise de ácido graxos é realizada a extração desses compostos provenientes dos microrganismos da amostra após a identificação do composto, se for um marcador bioquímico característico, será possível identificar as espécies, permitindo o monitoramento da diversidade de um ambiente [8]. Todavia esse método é utilizado com algumas ressalvas. Fakruddin e Mannan, em sua revisão, alertam que vários microrganismos possuem os mesmos ácidos graxos o que pode impedir a detecção na mudança da diversidade [9]. Outra ressalva realizada por Fakruddin e Mannan é que a composição de ácidos graxos dos microrganismos pode variar de acordo com as condições de crescimento.
Dentro dos métodos de resolução intermediária estão presentes as técnicas por fingerprint, como DGGE, TGGE, RISA e ARDRA. Essas técnicas consistem na amplificação do gene rRNA 16S (DGGE, TGGE) ou da região ITS (RISA, ARDRA) e separação dos produtos gerados em um gel de eletrofoforese, sendo que o perfil apresentado no gel é utilizado para estimar a diversidade. Godheja et al. relatam que apesar das limitações, principalmente pelo desenho dos primers para grupos específicos, essas técnicas têm sido bastante utilizadas em diversos estudos [10]. Porém, essas técnicas não conseguem mensurar de uma forma precisa a abundância e diversidade, principalmente pela dificuldade da reprodutibilidade.
18 permitindo a detecção e quantificação de células de grupos filogenéticos conhecidos, permitindo a descrição da diversidade da amostra. Porém, conforme Douterelo et al. essa técnica possui dificuldade de diferenciar células vivas de células mortas [11]. Sanz e Köchling relatam que esse método requer uma sequência de nucleotídeo conhecida do organismo alvo para o desenho de uma sonda, portanto, permitindo a detecção apenas de microrganismos conhecidos [12].
Para a análise da diversidade funcional, a técnica de microarranjo de fenótipo é utilizada. Esse método consiste no crescimento da comunidade microbiana em diferentes fontes nutricionais (12, 48 ou 96 fontes), exibindo um potencial catabólico característico [13]. Apesar de ser uma alternativa mais barata que o sequenciamento, essa técnica pode superestimar a presença de algumas bactérias, alterando a verdadeira contribuição dessas bactérias na comunidade.
Metagenômica
O estudo dos genomas de diversos microrganismos contidos em um dado ambiente é denominado de metagenômica [14]. Esse estudo pode contemplar tanto a diversidade presente em um ambiente (bactérias, arqueas, fungos, protozoários) quanto a investigação de seu potencial funcional, ou seja, seus recursos genéticos com a facilidade do não-cultivo desses microrganismos.
O termo “metagenômica” foi empregado pela primeira vez por Handelsman et al.
[14], onde foi levantada uma possibilidade de poder acessar compostos com apelo industrial produzidos por microrganismos desconhecidos de difícil cultivo por meio do sequenciamento do DNA total da comunidade microbiana. Assim, diversos trabalhos foram realizados a partir de diversos tipos de amostra, como solo, água, ar, resíduos industriais, etc.
19 o próprio DNA) poderiam ser facilmente sequenciados fornecendo informações de vias enzimáticas inteiras que podem estar presentes em um único clone BAC e fosmídeos.
Atualmente, os estudos metagenômicos são realizados a partir do sequenciamento
shotgun direto do DNA “ambiental” [18,19]. Assim, no campo da metagenômica é possível descrever as espécies e/ou genes presentes no ambiente através de identificação realizada por meio do contraste com banco de dados específicos (Greengenes [20], SILVA [21] para taxonomia e SEED [22] para funcional, por exemplo), possibilitando a mensuração da diversidade microbiana de uma forma mais precisa. Por meio do processamento dos dados gerados pelo sequenciamento realizado em softwares e/ou plataformas (QIIME [23], MG-RAST [24]) é possível investigar o potencial gênico de uma dada comunidade. Porém, essa técnica prioriza os membros dominantes de um determinado ambiente, sendo que são necessárias certas modificações e/ou outras técnicas para analisar organismos mais raros.
Metagenômica em ambientes aquáticos
A metagenômica pode ser utilizada para o estudo de diversos tipos de ambientes, como solo [25], ar [26,27], corpo humano [28,29], intestino de cupim [30], entre outros. Dentro dos ambientes estudados pela metagenômica, o ambiente aquático vem sendo alvo de diversos estudos focados na descrição e nas interações que ocorrem na microbiota. Dentro do ambiente aquático, há diversos tipos de ambientes como água do mar e água doce, por exemplo.
Água do mar
20 na coluna d’água do oceano (superfície, mesopelágico, mar profundo e sedimento marinho [31].
A maioria dos estudos marinhos são realizados nos oceanos Pacífico e no Atlântico Norte [32]. Descrevendo a microbiota presente na superfície marinha do mar de Sargasso (Atlântico Norte), Venter et al. relataram que os mais abundantes filos nesse ambiente eram Proteobacteria, Actinobacteria, Cyanobacteria, Firmicutes, entre outros [19]. Nesse mesmo trabalho, Venter et al. detectaram mais de 1800 espécies, maioria pertencente a Alphaproteobacteria e Gammaproteobacteria. Em outro estudo, Mueller et al. sequenciaram amostras da superfície do mar em Monterey (CA, EUA) no oceano Pacífico [33]. Nesse estudo, eles relataram a predominância dos filos Proteobacteria e Bacteriodetes.
Existem alguns esforços para o preenchimento dessa ausência de conhecimento em outras regiões marinhas. Alves-Junior et al. realizaram uma caracterização metagenômica na região sul do oceano Atlântico em diferentes profundidades - superfície, camada profunda de máxima concentração de clorofila (DMC; 48–82m), zona afótica (1200m) [34]. Nesse trabalho eles relataram a predominância do filo Proteobacteria nas amostras e que a abundância de Cyanobacteria foi maior quando comparada a outros oceanos [34]. Eles também relataram que as abundâncias de Alphaproteobacteria e Cyanobacteria diminuíram com o aumento da profundidade, enquanto ocorreu um aumento na abundância de Rhodobacteriales [34].
Além da coluna d’água, o ambiente marinho oferece diversas opções de hábitats para microrganismos. Trindade-Silva et al. descreveram a microbiota associada à esponja endêmica Arenosclera brasiliensis, onde foi encontrada a prevalência dos gêneros
21 Além de estudos ecológicos, os ambientes marinhos também têm fornecido microrganismos alvos de produtos biotecnológicos. Por exemplo, Zhu et al. descobriram e modificaram geneticamente uma linhagem de Marinactinospora thermotolerans
(Actinomycete) em sedimento marinho capaz de produzir um potente agente antibacteriano [38]. A partir de uma microbiota associada à esponja A. brasiliensis, Rua
et al. isolaram microrganismos cultiváveis que apresentam atividade antimicrobiana, possuindo um grande potencial biotecnológico [36].
Poças de maré
Um tipo de ambiente vinculado ao ambiente marinho é a poça de maré. As poças de maré são áreas conhecidas como ambientes sob forte estresse onde os seus habitantes estão sujeitos a oscilações de temperatura e salinidade, além de dissecação e hipoxia [39]. Essas condições de estresse podem ser causadas por diversos fatores como incidência de luz solar (elevando a temperatura), oxigênio, entre outros [40]. Devido à limitação espacial e à facilidade para mensurar nutrientes e outros compostos, esse ambiente oferece a possibilidade de desenvolver estudos ecológicos [41,42]. Em geral, os estudos realizados nas poças de maré são focados em macrorganismos, como alguns crustáceos, algas, camarões e peixes [43–47].
Essas zonas entremarés são também influenciadas pelos seus habitantes. Alguns organismos podem usar os nutrientes em uma proporção diferente dos demais organismos, afetando diretamente a disponibilidade do nutriente em questão nas poças de maré [48,49]. Bjork et al. relataram a capacidade da alga Ulva intestinalis em aumentar o pH e reduzir a concentração do carbono inorgânico em uma poça de maré[50]. Todas essas mudanças podem ser fundamentais para moldar a microbiota presente nas poças de maré. Estudos relacionados a microrganismos em poças de maré são raros e esses poucos trabalhos estão vinculados a estudos biotecnológicos [51,52]. Nenhum estudo metagenômico foi realizado nesse ambiente.
Água doce
22 escassos quando comparados aos estudos realizados em ambientes marinhos [19,53]. Esses poucos trabalhos já foram capazes de mostrar que a comunidade microbiana presente em água doce é diferente da comunidade presente em água salgada [54]. Esses ambientes de água doce possuem uma grande importância para o homem, além de estarem relacionados a diversos ciclos biogeoquímicos [55].
As caracterizações microbianas são realizadas ao longo da coluna d’água e dos sedimentos desses ambientes de água doce. Ghai et al. realizaram uma análise da microbiota do rio Amazonas (Brasil), além de uma caracterização dos parâmetros físico-químicos de sua água [56]. O rio Amazonas apresentou uma microbiota dominada por Actinobacteria, Alphaproteobacteria e Betaproteobacteria, apresentando o gênero
Polynucleobacter como o mais abundante entre as bactérias. Além dessa descrição, Ghai
et al. também mostraram a importância do metabolismo heterotrófico nesse rio.
Em outro trabalho, que ajuda a esclarecer a microbiota de água doce, Gibbons et al. realizaram um estudo sobre a diversidade taxonômica e funcional da microbiota do sedimento do rio Tongue (EUA) [57]. Os autores relataram a predominância dos filos Proteobacteria, Acidobacteria, Bacteroidetes e Planctomycetes. Nesse mesmo estudo também foi relatado o potencial da microbiota em degradar compostos aromáticos e hidrocarbonetos, como naftaleno, nitrotolueno, benzoato entre outros. Segundo os autores, provavelmente, o potencial de degradação desses compostos na microbiota foi estimulado por estar vinculado à proximidade de uma carvoaria próxima ao corpo d’água. Apesar de toda sua importância ecológica, diversos desses corpos d’água estão sendo perturbados por atividades antropogênicas, levando à alteração da microbiota [58] e, por sua vez, impactando em diversos ciclos biogeoquímicos, visto que a microbiota tem papel fundamental nessa etapa. Liu et al. relataram que no estuário Pearl (China) havia uma alta abundância de Sphingomonadales e Rhizobiales (Alphaproteobacteria), além de uma maior abundância de fitoplâncton. Os autores explicam que esse cenário se deve à alta concentração de nutrientes proveniente de impactos antropogênicos no estuário [59].
23 bacterianas de ambientes saudáveis, assim, podendo ser utilizadas como biossensores capazes de detectar impactos antropogênicos no meio ambiente [60].
Rio Paraguaçú
O rio Paraguaçú faz parte da bacia do Paraguaçú, sendo que essa bacia está contida em grande parte na Caatinga, assim, possuindo uma grande importância para o estado da Bahia. Essa bacia propicia o desenvolvimento de atividades agropecuárias e mineração, contém o manancial de abastecimento de Salvador e região metropolitana, além de abrigar inúmeras nascentes [61,62].
O curso do rio Paraguaçú está contido inteiramente na Bahia, possuindo 500 km de extensão desde a sua nascente localizada no município de Barra da Estiva (13° 37' 33" S 41° 19' 37" W, 1200m de altitude), passando pela Chapada Diamantina e pela Caatinga do Recôncavo Baiano, chegando à desembocadura na Baía de Todos os Santos (Pereira, 2008). Em seu percurso existem três barragens: do Apertado, Bandeira de Melo e Pedra do Cavalo. A barragem do Apertado está localizada na cidade de Mucugê, antes do rio Paraguaçú entrar no Parque Nacional da Chapada Diamantina, essa barragem possui uma capacidade de 108,89 hm³ e uma vazão de 8,90 m³/s, com o propósito de abastecer o município, nas zonas urbana e rural [63].
Apesar de sua extrema importância, o rio Paraguaçú sofre inúmeros impactos ambientais que interferem na sua manutenção, diversidade e qualidade. Esses impactos estão ligados principalmente a atividades agrícolas, como a utilização de pesticidas, desmatamentos e/ou queimadas para formação de pastagem que potencializam as formações de erosões em áreas sem cobertura vegetal com consequente assoreamento do rio [61], além da poluição com metais pesados pela atividade de garimpo [64].
24 Paraguaçú compreende uma sequência metassedimentar pelito-psamítica, cortada por rochas magmáticas [67].
O clima na Chapada Diamantina se alterna de subúmido a seco, sendo que nas regiões mais próximas da nascente pode variar de úmido a subúmido coberto com florestas remanescentes e campos rupestres (S.E.M.A.R.H. e S.R.H., 2005). Segundo o Instituto Nacional de Meteorologia (INMET), entre o período de agosto/2012 a maio/2013, houve variação na temperatura de 17,8 ºC (25/08/2012) a 33 ºC (23/10/2012) e variação da umidade de 43% (30/09/2012) a 100% (23/11/2012), enquanto a precipitação pluviométrica do período de agosto/2012 a maio/2013 chegou a 124 mm (23/01/2013), sendo que o mês de novembro de 2012 apresentou precipitação em quase todos os dias. O período de 25 de janeiro de 2013 a 21 de março de 2013 foi considerado como um dos piores períodos de seca da região possuindo apenas 8 mm de precipitação em dois meses.
25
OBJETIVO GERAL E ESTRUTURA DA TESE
O objetivo geral do presente estudo foi descrever a comunidade microbiana em ambientes aquáticos. Os resultados foram apresentados em dois capítulos, sendo eles:
CAPÍTULO 1 - Microbial community profile and water quality in a protected area of the Caatinga biome
26
Referências Bibliográficas
1. Stolp H. Microbial ecology: organisms, habitats, activities. Cambridge University Press; 1988.
2. Xu J. INVITED REVIEW: Microbial ecology in the age of genomics and metagenomics: concepts, tools, and recent advances. Mol Ecol. 2006;15: 1713–1731. doi:10.1111/j.1365-294X.2006.02882.x
3. Shannon CE, Weaver W. The mathematical theory of communication. University of Illinois press; 2015.
4. Simpson EH. Measurement of diversity. Nature. 1949;
5. Staley JT, Konopka A. Measurement of in situ activities of nonphotosynthetic microorganisms in aquatic and terrestrial habitats. Annu Rev Microbiol. 1985;39: 321–346. doi:10.1146/annurev.mi.39.100185.001541
6. Torsvik V, Daae FL, Sandaa RA, Ovreås L. Novel techniques for analysing microbial diversity in natural and perturbed environments. J Biotechnol. 1998;64: 53–62. 7. Griffiths BS, Ritz K, Ebblewhite N, Dobson G. Soil microbial community structure:
Effects of substrate loading rates. Soil Biol Biochem. 1998;31: 145–153. doi:10.1016/S0038-0717(98)00117-5
8. Banowetz GM, Whittaker GW, Dierksen KP, Azevedo MD, Kennedy AC, Griffith SM, et al. Fatty acid methyl ester analysis to identify sources of soil in surface water. J Environ Qual. 2006;35: 133–140. doi:10.2134/jeq2005.0048
9. Fakruddin M, Mannan K. Methods for analyzing diversity of microbial communities in natural environments. Ceylon J Sci Biol Sci. 2013;42.
10. Godheja J, Shekhar SK, Modi DR. Advances in Molecular Biology Approaches to Guage Microbial Communities and Bioremediation at Contaminated Sites. Int J Environ Bioremediation Biodegrad Int J Environ Bioremediation Biodegrad. 2014;2: 167–177. doi:10.12691/ijebb-2-4-4
11. Douterelo I, Boxall JB, Deines P, Sekar R, Fish KE, Biggs CA. Methodological approaches for studying the microbial ecology of drinking water distribution systems. Water Res. 2014;65: 134–156. doi:10.1016/j.watres.2014.07.008
12. Sanz JL, Köchling T. Molecular biology techniques used in wastewater treatment: An overview. Process Biochem. 2007;42: 119–133. doi:10.1016/j.procbio.2006.10.003 13. Stefanowicz A. The Biolog plates technique as a tool in ecological studies of
microbial communities. Pol J Environ Stud. 2006;15: 669.
27 15. Shizuya H, Birren B, Kim UJ, Mancino V, Slepak T, Tachiiri Y, et al. Cloning and stable maintenance of 300-kilobase-pair fragments of human DNA in Escherichia coli using an F-factor-based vector. Proc Natl Acad Sci U A. 1992;89: 8794–7.
16. Kim UJ, Birren BW, Slepak T, Mancino V, Boysen C, Kang HL, et al. Construction and characterization of a human bacterial artificial chromosome library. Genomics. 1996;34: 213–8. doi:10.1006/geno.1996.0268
17. Wild J, Hradecna Z, Szybalski W. Conditionally amplifiable BACs: switching from single-copy to high-copy vectors and genomic clones. Genome Res. 2002;12: 1434– 44. doi:10.1101/gr.130502
18. Tyson GW, Chapman J, Hugenholtz P, Allen EE, Ram RJ, Richardson PM, et al. Community structure and metabolism through reconstruction of microbial genomes from the environment. Nature. 2004;428: 37–43. doi:10.1038/nature02340
19. Venter JC, Remington K, Heidelberg JF, Halpern AL, Rusch D, Eisen JA, et al. Environmental genome shotgun sequencing of the Sargasso Sea. Science. 2004;304: 66–74. doi:10.1126/science.1093857
20. DeSantis TZ, Hugenholtz P, Larsen N, Rojas M, Brodie EL, Keller K, et al. Greengenes, a chimera-checked 16S rRNA gene database and workbench compatible with ARB. Appl Environ Microbiol. 2006;72: 5069–5072. doi:10.1128/Aem.03006-05
21. Yilmaz P, Parfrey LW, Yarza P, Gerken J, Pruesse E, Quast C, et al. The SILVA and “All-species Living Tree Project (LTP)” taxonomic frameworks. Nucleic Acids Res. 2014;42: D643–D648. doi:10.1093/nar/gkt1209
22. Overbeek R, Olson R, Pusch GD, Olsen GJ, Davis JJ, Disz T, et al. The SEED and the Rapid Annotation of microbial genomes using Subsystems Technology (RAST). Nucleic Acids Res. 2014;42: D206–D214. doi:10.1093/nar/gkt1226
23. Caporaso JG, Kuczynski J, Stombaugh J, Bittinger K, Bushman FD, Costello EK, et al. QIIME allows analysis of high-throughput community sequencing data. Nat Methods. 2010;7: 335–336. doi:10.1038/Nmeth.F.303
24. Meyer F, Paarmann D, D’Souza M, Olson R, Glass EM, Kubal M, et al. The metagenomics RAST server - a public resource for the automatic phylogenetic and functional analysis of metagenomes. BMC Bioinformatics. 2008;9. doi:10.1186/1471-2105-9-386
25. Catã, O ECP, Lopes FAC, Araú, Jo J, F N, et al. Soil Acidobacterial 16S rRNA Gene Sequences Reveal Subgroup Level Differences between Savanna-Like Cerrado and Atlantic Forest Brazilian Biomes, Soil Acidobacterial 16S rRNA Gene Sequences Reveal Subgroup Level Differences between Savanna-Like Cerrado and Atlantic Forest Brazilian Biomes. Int J Microbiol Int J Microbiol. 2014;2014, 2014: e156341. doi:10.1155/2014/156341, 10.1155/2014/156341
28 27. Be NA, Thissen JB, Fofanov VY, Allen JE, Rojas M, Golovko G, et al. Metagenomic Analysis of the Airborne Environment in Urban Spaces. Microb Ecol. 2015;69: 346– 355. doi:10.1007/s00248-014-0517-z
28. Szalkai B, Grolmusz V. Nucleotide 9-mers characterize the type II diabetic gut metagenome. Genomics. 2016; doi:10.1016/j.ygeno.2016.02.007
29. Wang A-H, Li M, Li C-Q, Kou G-J, Zuo X-L, Li Y-Q. Human colorectal mucosal microbiota correlates with its host niche physiology revealed by endomicroscopy. Sci Rep. 2016;6: 21952. doi:10.1038/srep21952
30. Santana RH, Catão ECP, Lopes FAC, Constantino R, Barreto CC, Krüger RH. The Gut Microbiota of Workers of the Litter-Feeding Termite Syntermes wheeleri (Termitidae: Syntermitinae): Archaeal, Bacterial, and Fungal Communities. Microb Ecol. 2015;70: 545–556. doi:10.1007/s00248-015-0581-z
31. Kennedy J, Flemer B, Jackson SA, Lejon DPH, Morrissey JP, O’Gara F, et al. Marine Metagenomics: New Tools for the Study and Exploitation of Marine Microbial Metabolism. Mar Drugs. 2010;8: 608–628. doi:10.3390/md8030608
32. Arístegui J, Gasol JM, Duarte CM, Herndld GJ. Microbial oceanography of the dark ocean’s pelagic realm. Limnol Oceanogr. 2009;54: 1501–1529. doi:10.4319/lo.2009.54.5.1501
33. Mueller RS, Bryson S, Kieft B, Li Z, Pett-Ridge J, Chavez F, et al. Metagenome Sequencing of a Coastal Marine Microbial Community from Monterey Bay, California. Genome Announc. 2015;3. doi:10.1128/genomeA.00341-15
34. Alves Junior N, Meirelles PM, de Oliveira Santos E, Dutilh B, Silva GGZ, Paranhos R, et al. Microbial community diversity and physical-chemical features of the Southwestern Atlantic Ocean. Arch Microbiol. 2015;197: 165–179. doi:10.1007/s00203-014-1035-6
35. Trindade-Silva AE, Rua C, Silva GGZ, Dutilh BE, Moreira APB, Edwards RA, et al. Taxonomic and Functional Microbial Signatures of the Endemic Marine Sponge Arenosclera brasiliensis. PLOS ONE. 2012;7: e39905. doi:10.1371/journal.pone.0039905
36. Rua CPJ, Trindade-Silva AE, Appolinario LR, Venas TM, Garcia GD, Carvalho LS, et al. Diversity and antimicrobial potential of culturable heterotrophic bacteria associated with the endemic marine sponge Arenosclera brasiliensis. PeerJ. 2014;2: e419. doi:10.7717/peerj.419
37. Bruce T, Meirelles PM, Garcia G, Paranhos R, Rezende CE, Moura RL de, et al. Abrolhos Bank Reef Health Evaluated by Means of Water Quality, Microbial Diversity, Benthic Cover, and Fish Biomass Data. PLOS ONE. 2012;7: e36687. doi:10.1371/journal.pone.0036687
29 39. Horn MH, Martin KL, Chotkowski MA. Intertidal fishes: life in two worlds.
Academic Press; 1998.
40. Bertness JW, Nybakken JW. Marine Biology, an Ecological Approach. Benjamin Cummings Bolch CJ Reynolds MJ 2002 Species Resolut Glob Distrib Microreticulate Dinoflag Cysts J Plankton Res. 2005;24: 565–578.
41. Bracken MES, Friberg SE, Gonzalez-Dorantes CA, Williams SL. Functional consequences of realistic biodiversity changes in a marine ecosystem. Proc Natl Acad Sci U S A. 2008;105: 924–928. doi:10.1073/pnas.0704103105
42. Altieri AH, Trussell GC, Ewanchuk PJ, Bernatchez G, Bracken MES. Consumers Control Diversity and Functioning of a Natural Marine Ecosystem. PLOS ONE. 2009;4: e5291. doi:10.1371/journal.pone.0005291
43. Longo GO, Morais RA, Martins CDL, Mendes TC, Aued AW, Cândido DV, et al. Between-Habitat Variation of Benthic Cover, Reef Fish Assemblage and Feeding Pressure on the Benthos at the Only Atoll in South Atlantic: Rocas Atoll, NE Brazil. PLoS ONE. 2015;10. doi:10.1371/journal.pone.0127176
44. Barreto FS, Schoville SD, Burton RS. Reverse genetics in the tide pool: knock-down of target gene expression via RNA interference in the copepod Tigriopus californicus. Mol Ecol Resour. 2015;15: 868–879. doi:10.1111/1755-0998.12359
45. Sorte CJB, Bracken MES. Warming and Elevated CO2 Interact to Drive Rapid Shifts in Marine Community Production. PLoS ONE. 2015;10. doi:10.1371/journal.pone.0145191
46. Sampaio HA, Martinelli-Lemos JM, Sampaio HA, Martinelli-Lemos JM. Use of intertidal areas by shrimps (Decapoda) in a brazilian Amazon estuary. An Acad Bras Ciênc. 2014;86: 333–345. doi:10.1590/0001-3765201420120039
47. Godinho WO, Lotufo TMC. Local v. microhabitat influences on the fish fauna of tidal pools in north-east Brazil. J Fish Biol. 2010;76: 487–501. doi:10.1111/j.1095-8649.2009.02501.x
48. Pfister CA. Intertidal invertebrates locally enhance primary production. Ecology. 2007;88: 1647–53. doi:10.1890/06-1913.1
49. Bracken MES, Gonzalez-Dorantes CA, Stachowicz JJ. Whole-Community Mutualism: Associated Invertebrates Facilitate a Dominant Habitat-Forming Seaweed. Ecology. 2007;88: 2211–2219. doi:10.1890/06-0881.1
50. Björk M, Axelsson L, Beer S. Why is Ulva intestinalis the only macroalga inhabiting isolated rockpools along the Swedish Atlantic coast? Mar Ecol Prog Ser. 2004;284: 109–116.
30 52. Yu Z, Zhou N, Qiao H, Qiu J. Identification, Cloning, and Expression of L-Amino Acid Oxidase from Marine Pseudoalteromonas sp. B3. Sci World J. 2014;2014. doi:10.1155/2014/979858
53. Rusch DB, Halpern AL, Sutton G, Heidelberg KB, Williamson S, Yooseph S, et al. The Sorcerer II Global Ocean Sampling Expedition: Northwest Atlantic through Eastern Tropical Pacific. PLOS Biol. 2007;5: e77. doi:10.1371/journal.pbio.0050077 54. Logares R, Bråte J, Heinrich F, Shalchian-Tabrizi K, Bertilsson S. Infrequent transitions between saline and fresh waters in one of the most abundant microbial lineages (SAR11). Mol Biol Evol. 2010;27: 347–357. doi:10.1093/molbev/msp239 55. Tranvik LJ, Downing JA, Cotner JB, Loiselle SA, Striegl RG, Ballatore TJ, et al.
Lakes and reservoirs as regulators of carbon cycling and climate. Limnol Oceanogr. 2009;54: 2298–2314. doi:10.4319/lo.2009.54.6_part_2.2298
56. Ghai R, Rodriguez-Valera F, McMahon KD, Toyama D, Rinke R, Cristina Souza de Oliveira T, et al. Metagenomics of the water column in the pristine upper course of the Amazon river. PloS One. 2011;6: e23785. doi:10.1371/journal.pone.0023785 57. Gibbons SM, Jones E, Bearquiver A, Blackwolf F, Roundstone W, Scott N, et al.
Human and environmental impacts on river sediment microbial communities. PloS One. 2014;9: e97435. doi:10.1371/journal.pone.0097435
58. Li H, Xing P, Wu QL. Characterization of the bacterial community composition in a hypoxic zone induced by Microcystis blooms in Lake Taihu, China. FEMS Microbiol Ecol. 2012;79: 773–784. doi:10.1111/j.1574-6941.2011.01262.x
59. Liu J, Fu B, Yang H, Zhao M, He B, Zhang X-H. Phylogenetic shifts of bacterioplankton community composition along the Pearl Estuary: the potential impact of hypoxia and nutrients. Front Microbiol. 2015;6: 64. doi:10.3389/fmicb.2015.00064
60. Smith MB, Rocha AM, Smillie CS, Olesen SW, Paradis C, Wu L, et al. Natural Bacterial Communities Serve as Quantitative Geochemical Biosensors. mBio. 2015;6: e00326–15. doi:10.1128/mBio.00326-15
61. S.R.H.S.H., S.R.H. Plano Diretor de Recursos Hídricos da Bacia do Médio e Baixo Paraguaçu. Salvador, BA, Brazil; 1996.
62. Pereira M do CN. Composição do Comitê da Bacia Hidrográfica do rio Paraguaçú-BA: análise da origem geográfica e do setor econômico representado por seus membros como fatores intervenientes na gestão participativa e de recursos hídricos. Universidade de Brasília. 2008.
63. Superintendência e Recursos Hídricos – SRH. 2007;
31 65. Velloso AL, Sampaio EVSB, Pareyn FGC. Ecorregiões: Propostas para o Bioma Caatinga. Recife: Associação Plantas do Nordeste/Instituto de Conservação Ambiental; 2002.
66. I.C.M.Bio. Plano de Manejo: Parque Nacional da Chapada Diamantina. 2007; 67. Santos PR, Durães AMM. Hidrogeologia Do Grupo Chapada Diamantina e do Grupo
Paraguaçú. Rev Águas Subterrâneas. 1986;
68. Machado ABM, Martins CS, Drummond GM. Lista da Fauna Brasileira Ameaçada de Extinção: Incluindo as Espécies Quase Ameaçadas e Deficientes em Dados. Belo Horizonte: Fundação Biodiversitas; 2005.
32
CAPÍTULO 1 1 - Microbial community profile and water quality in a protected area
of the Caatinga biome
Authors: Fabyano Alvares Cardoso Lopes1, Elisa Caldeira Pires Catão1, Renata Henrique
Santana2, Anderson de Souza Cabral3, Rodolfo Paranhos3, Thiago Pessanha Rangel4,
Carlos Eduardo de Rezende4, Robert A. Edwards5,6, Cristiane C. Thompson3, Fabiano L.
Thompson3¶*, Ricardo Henrique Kruger1¶*
1 Cellular Biology Department, Universidade de Brasília (UnB), Brasília, DF, Brazil
2 Genomic Sciences and Biotechnology, Universidade Católica de Brasília (UCB),
Brasília DF, Brazil
3 Institute of Biology, Universidade Federal do Rio de Janeiro (UFRJ), Rio de Janeiro,
Brazil
4 Laboratory of Environmental Sciences, Universidade Estadual do Norte Fluminense
(UENF), Campos dos Goytacazes, Brazil
5 Computational Science Research Center, San Diego State University (SDSU), San
Diego, California, United States of America
6 Department of Computer Science, San Diego State University (SDSU), San Diego,
California, United States of America
* Corresponding authors:
33 Fabiano L. Thompson
Laboratório de Microbiologia – Instituto de Biologia,
and Laboratório de Sistemas Avançados de Gestão da Produção (SAGE) – COPPE,
Universidade Federal do Rio de Janeiro (UFRJ), Av. Carlos Chagas
Fo. S/N - CCS - IB - Lab de Microbiologia - BLOCO A (Anexo) A3 - sl 102, Cidade Universitária, Rio de Janeiro, RJ, Brazil 21941-599
E-mail: [email protected]
Ricardo H. Kruger
Universidade de Brasília – UnB
Instituto Central de Ciências Sul – Dept. de Biologia Celular
Laboratório de Enzimologia
CEP. 70910-900, Brasília, DF, Brazil.
E-mail: [email protected]
¶ These authors contributed equally to this work.
35
Abstract
The Caatinga is a semi-arid biome in northeast Brazil. The Paraguaçú River is located in the Caatinga biome, and part of its course is protected by the National Park of Chapada Diamantina (PNCD). In this study we evaluated the effect of PNCD protection on the water quality and microbial community diversity of this river by analyzing water samples obtained from points located inside and outside the PNCD in both wet and dry seasons. Results of water quality analysis showed higher levels of silicate, ammonia, particulate organic carbon, and nitrite in samples from the unprotected area compared with those from protected areas. Pyrosequencing of the 16S rRNA genes revealed that Burkholderiales was abundant in samples from all three sites during both seasons and was represented primarily by the genus Polynucleobacter and members of the Comamonadaceae family (e.g., genus Limnohabitans). During the dry season, the unprotected area showed a higher abundance of Flavobacterium sp. and Arthrobacter sp., which are frequently associated with the presence and/or degradation of arsenic and pesticide compounds. In addition, genes that appear to be related to agricultural impacts on the environment, as well as those involved in arsenic and cadmium resistance, copper homeostasis, and propanediol utilization, were detected in the unprotected areas by metagenomic sequencing. Although PNCD protection improves water quality, agricultural activities around the park may affect water quality within the park and may account for the presence of bacteria capable of pesticide degradation and assimilation, evidencing possible anthropogenic impacts on the Caatinga.
36
Introduction
The Caatinga is a semi-arid biome located in the northeast of Brazil (3–17°S to 35–45°W). It occupies almost 900,000 km² of the Brazilian territory and is characterized by its vegetation during the dry season, when the leaves fall and white tree trunks and shrubs remain in the landscape [1, 2]. This unique and important biome is strongly affected by anthropogenic processes. It is estimated that about 50% of the Caatinga biome has been modified by activities related to agriculture, livestock, or coal extraction [3-6]. The dry season in the Caatinga is characterized by water shortage [5], with an annual rainfall of 300–500 mm in the semi-arid zone and 1,500 mm in the mountainous area of Chapada Diamantina [3]. Accordingly, the Paraguaçú River, which is a typical Caatinga river, shows high seasonal volume fluctuations. This river supplies water for agricultural and mining activities, as well as several cities. Despite the great importance of this river, it is subject to pesticide dumping, siltation, and heavy metal pollution [7], but the precise effects of agriculture and mining on the water quality and microbial diversity of this region remain unclear. To prevent environmental degradation, the National Park of Chapada Diamantina (PNCD) was created in 1985. However, this park, which protects part of the Paraguaçú River course, is surrounded by agricultural land, some of which is in direct contact with the Paraguaçú River.
37 and Atlantic forest, but the limited number of samples analyzed hampered a clear distinction. In addition, it is not clear from previous studies how the microbial communities are structured inside and outside protected areas (such as PNCD).
In this study, we evaluated the effect of PNCD protection on the water quality and microbial diversity of the Paraguaçú River. Specifically, we performed taxonomic and metagenomic analyses of bacterial communities from sites inside and outside the PNCD in both wet and dry seasons. We also analyzed water quality by measuring the levels of heavy metals, dissolved organic carbon (DOC), particulate organic carbon (POC), and inorganic nutrients.
Materials and methods
Ethics statement
This study was approved by Instituto Chico Mendes de Conservação da Biodiversidade (ICMBio) in accordance with the Brazilian law (Permit Number: SISBIO31652-1).
Study area and sample collection
38 Two replicate samples were obtained at each sampling point in the wet season (November 2012) and dry season (February 2013) for a total of 12 samples. For each sampling point in both seasons, we collected approximately 20 L unfiltered water by pump from the water column at a depth of approximately 1 m.
After obtaining water samples, aliquots of each sample (200 ml) were frozen at -20ºC for the subsequent measurement of physicochemical parameters. After collecting the water samples, sediments were sampled from the river bottom directly below the water sampling point. The sediment samples were collected using a dredge at a depth of 10 cm inside a perimeter of 2 m and stored at -20°C.
For each freshwater sample, aliquots used to measure microbial abundance were prepared immediately after water sampling. Three 1.5-ml aliquots were dispensed into 2.0-ml cryogenic tubes and fixed with 1% paraformaldehyde and 0.5% glutaraldehyde for the bacterial count [14], 0.5% glutaraldehyde for the viral count [15], and 1% paraformaldehyde for the nanoeukaryotic phytoplankton (NEUK), picoeukaryote (PEUK), and Synechococcus spp. analyses [16]. Fixation was performed within 30 minutes after the water samples were collected.
39 Fig.1. Study area. A) The area under National Park of Chapada Diamantina (PNCD) management is shown in green. The three sampling points on the Paraguaçú River are indicated on the map: P1, unprotected site outside the PNCD; P2 and P3, protected sites within the PNCD. The arrow indicates the direction of water flow. B) Unprotected sampling point P1. C) Protected sampling point P2. D) Protected sampling point P3.
Physicochemical and microbial abundance analyses
40 following nitrate determination, orthophosphate by reaction with ascorbic acid, total phosphorous by acid digestion to phosphate, and silicate by reaction with molybdate. DOC and POC were analyzed as described previously [18].
Each sediment sample was passed through a 2-mm sieve (Millipore) with a stream of water. Sand (coarse, medium and fine), silt, clay, and trace elements were measured in the fraction that passed through the sieve. Quantification of trace elements was carried out by inductively coupled plasma optical emission spectrometry (ICP-OES; Varian Liberty-Series II) using a procedure based on US Environmental Protection Agency Method 3052 [19] and modified by Marques et al. [20]. Approximately 0.5 g of the sieved sediment was used to determine concentrations of the following elements: Al, Ba, Ca, Cd, Cr, Cu, Fe, Mn, Ni, P, Pb, S, Sr, Ti, V, and Zn. Measurements were carried out in triplicate for each sample, and a coefficient of variation between replicates <10% was considered satisfactory.
Microbial and viral abundance in water samples was determined by flow cytometry (FACSCalibur, BD Biosciences) using nucleic acid affinity fluorophore probes for bacteria [21, 22] and SYBR Green (Life Technologies) for viruses [15]. Picoplankton were detected by the fluorescence of natural photosynthetic pigments [16].
Principal component analysis of physicochemical and microbial parameters was performed using a correlation matrix in Past v.3.01 [23]. Values for physicochemical and microbial parameters from the 12 water samples (two samples taken from three different sites in both seasons) were compared by ANOVA (α < 0.05), followed by the Tukey post
41
Metagenomic DNA extraction
DNA extraction was performed using lysozyme (1 mg/ml) for 1 h at 37°C, as previously described [25]. Then proteinase K (0.2 mg/ml) and 1% sodium dodecyl sulfate (SDS) were added, and the samples were incubated at 55°C for 60 min with gentle agitation. The lysate was rinsed into a new tube with 1 ml SET buffer. Metagenomic DNA was extracted with one volume of phenol:chloroform:isoamyl alcohol (25:24:1) and then precipitated with ethanol and sodium acetate (0.3 M final concentration) at -20°C overnight. The DNA was purified using a Power Clean DNA Clean-Up Kit (MO BIO Laboratories) and stored at -20°C.
Polymerase chain reaction, 16S rRNA gene amplicon sequencing, and
sequence analysis
Polymerase chain reaction (PCR) amplification of bacterial 16S rRNA genes was performed as described in our previous reports [26]. The hypervariable regions V5 to V9 of the bacterial 16S rRNA gene were amplified using primers 787F (5'-ATTAGATACCCNGGTAG-3') and 1492R (5'-GNTACCTTGTTACGACTT-3') [27]. Primers used in this work were designed with the appropriate 454 pyrosequencing adaptor sequences and multiplex identifiers (not shown). Ten 20-µL reactions were carried out for bacteria using 1× buffer, 0.25 mM dNTP mix, 3 mM MgCl2, 0.175 pmol each primer
42 amplicons was carried out in two 1/8 picotiter plates by Macrogen Inc. (Seoul, Korea) using a 454 GS-FLX Titanium system (454 Life Sciences; Roche, Basel, Switzerland).
Sequences were analyzed using QIIME 1.7.0 software [28]. Initially the 16S rRNA sequences were demultiplexed, and the reads were renamed according to the sample ID with the split_libraries.py script. The sequence quality thresholds used in this step were minimum average quality score of 30, sequence length range of 200–1000 nucleotides, window score of 50 nucleotides, maximum number of ambiguous bases of 6, length of homopolymer run of 6, and maximum number of error in barcodes of 1.5. Primer mismatches were not allowed. The denoising procedure for the output file was performed using the denoise_wrapper.py script [29] set to titanium defaults. The script
inflate_denoiser_output.py reintegrated the denoised data, and the
truncate_reverse_primer.py script removed the reverse primers and any subsequent sequences. Chimeric sequence identification was performed by
identify_chimeric_seqs.py script using Chimera Slayer [30], which performs reference-based or de novo (abundance-based) chimera checking. From a total of 165,337 raw sequences obtained by pyrosequencing, 54,423 sequences were removed after the processing steps described above, yielding 110,914 high-quality sequences.
43 nucleotides. (iv) RDP Classifier v.2.2 [33] was used to assign taxonomy based on the Greengenes sequences as references and templates. (v) The phylogenetic tree was built using the FastTree method [34]. (vi) The OTU table showing the relative abundance at each taxonomic level (kingdom, phylum, class, order, family, and genus) was then generated from OTU counts for each sample and their taxonomic assignments.
The script alpha_rarefaction.py calculated the diversity indices at a single sequencing depth (i.e. number of sequences per sample) with 2910 sequences using the following metrics: nonparametric Shannon [35], Chao1 [36], Observed Species, and Good’s coverage [37]. The values of the indices from the 12 samples (taken from three sites in both seasons with two replicates each) were compared by ANOVA (α < 0.05),
followed by the Tukey post hoc test using R statistical software [24]. The script beta_rarefaction.py was used to calculate beta diversity [38]. Results of the principal coordinates analysis (PCoA) of relative abundances of bacterial taxa (at the order and genus levels) were plotted in EMPeror [39] from community similarities values (unweighted UniFrac distance matrices).
44
Metagenome sequencing and sequence analysis
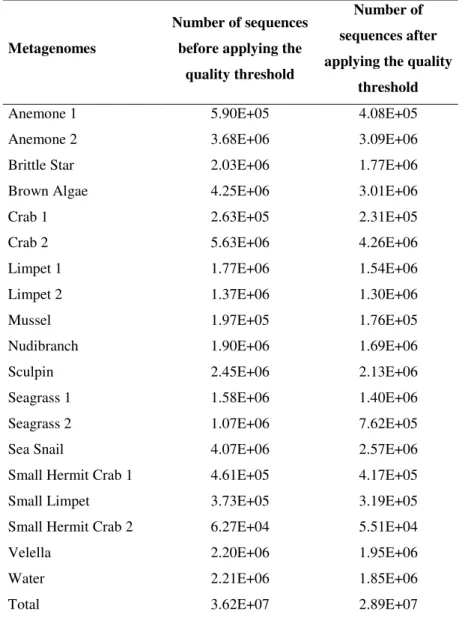
Metagenomic DNA libraries were constructed with the Nextera DNA Sample Preparation Kit (Illumina) and 2 × 250 bp paired-end sequencing was carried out by Centro de Genômica de Alto Desempenho UCB (Brasília, Brazil) using an Illumina MiSeq system according to the manufacturer's instructions. Sequence analysis was performed with 2.2 x 10⁷ sequences (S1 Table) using the MG-RAST server [41] using
default sequence quality thresholds [42, 43]. The analysis of metagenomic data was based on unassembled reads. Functional annotation was performed against the SEED database [44], and taxonomic profiles were generated using the M5NR database [45].
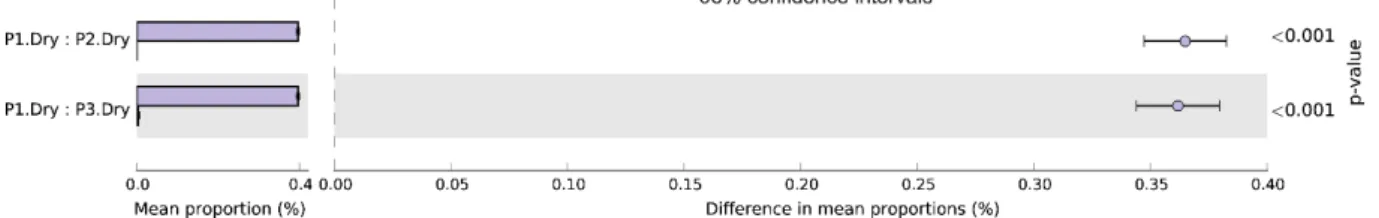
We compared the abundance of gene and taxa among the water samples using STAMP software [40]. Samples were compared by ANOVA, followed by the Tukey– Kramer post hoc test (p < 0.05) without correction for the gene profile and with the Bonferroni correction for multiple comparisons for the taxonomic profile. Genes and taxa with small effect sizes were removed by filtering (effect size = 8.00), and asymptotic confidence intervals (95%) were calculated. For seasonal analysis (wet versus dry; protected versus unprotected in both seasons), samples were compared by t-test (p < 0.05) without correction (gene profile) and with the Bonferroni correction for multiple comparisons (taxonomic profile). Genes and taxa with small effect sizes were removed by filtering (effect size = 8.00).
45
Accession numbers
The sequences assessed in this study are available in NCBI Sequence Read Archive (SRA) under the study Accession number PRJNA292014. Metagenomic data sets are available in the MG-RAST server under Biodiversidade Microbiana do Bioma Caatinga project (ID 7927).
Results
Inorganic and organic compounds and microbial cell count
47 Table 1. General features of water samples obtained from sites on the Paraguaçú River.
Abbreviations: CFU, colony-forming units; DOC, dissolved organic carbon; NEUK, nanoeukaryotes; N/P, nitrogen/phosphorus; PEUK, picoeukaryotes; POC, particulate organic carbon.
P1 P2 P3
Geographic location 13°26'9.11"S 41°20'17.56"W 13° 0'2.60"S 41°23'22.57"W 12°50'25.91"S 41°19'26.52"W Altitude (m above sea
level) 1100 974 345
Month/Year Nov 2012 Feb 2013 Nov 2012 Feb 2013 Nov 2012 Feb 2013
Season wet dry wet dry wet dry
Depth (m) ± 0.80 ± 0.70 ± 1.10 ± 0.45 > 3.00 > 3.00
Width (m) ± 4.23 ± 2.94 ± 36.9
pH 2.8 4.0 2.9 3.8 3.2 4.1
Conductivity (µS/ml) 41 44 54 63 27 35
Coarse sand (%) 2.6 5.5 45.7 41.9 68.2 10.5
Medium sand (%) 82.3 63.4 48.7 52.4 28.3 78.3
Fine sand (%) 14.8 28.9 5.6 5.7 3.3 10.7
Silt (%) 0.3 2.2 0.0 0.0 0.0 0.5
Clay (%) 0.0 0.0 0.0 0.0 0.0 0.0
Bacterial counts (cells/ml) 2.1E+06 ± 1.1E+05 1.2E+06 ± 1.9E+05 1.0E+06 ± 2.0E+04 9.9E+05 ± 6.8E+04 8.7E+05 ± 4.3E+04 7.1E+05 ± 2.4E+04 Virus counts (CFU/ml) 6.0E+05 ± 4.3E+04 6.9E+06 ± 1.9E+06 6.6E+05 ± 1.4E+05 1.2E+07 ± 5.6E+05 3.7E+05 ± 1.2E+05 8.7E+06 ± 4.2E+05
Synechococcus (cells/ml) 0 ± 0 0 ± 0 0 ± 0 2.2E+03 ± 5.0E+02 0 ± 0 0 ± 0
PEUK (cells/ml) 0 ± 0 0 ± 0 1.6E+03 ± 2.4E+02 3.1E+03 ± 1.7E+02 1.6E+03 ± 6.2E+01 2.0E+03 ± 9.7E+01
NEUK (cells/ml) 0 ± 0 0 ± 0 0 ± 0 0 ± 0 0 ± 0 0 ± 0
48 Table 2. Results of freshwater metagenomics studies.
Study classification Freshwater Name Sample Observation Bacterial counts (cells/ml)
Depth
(m) pH (mg/l) DO Conductivity (mS/cm) Salinity (PSU) (mg/l) DOC (mg/l) POC Orthophosphate (µM)
Total phosphorus
(µM)
Silicate
(µM) Ammonia (µM) Nitrite (µM) Nitrate (µM) Total nitrogen (µM) N/P ratio Present
study River Paraguaçú P1 Wet season 21.49 . 105 ± 0.80 2.80 0.04 0.9 7.5 0.2 0.4 16 3.2 0.3 3.3 28.2 79.1
P2 Wet season 10 . 105 ± 1.10 2.90 0.05 2 2.9 0.1 0.1 0.7 1.1 0.3 0.4 43.8 338.9
P3 Wet season 8.73 . 105 > 3.00 3.20 0.03 1.5 1 0.4 0.7 1.4 0.8 0.3 6.5 42.1 60.2
P1 Dry season 11.88 . 105 ± 0.70 4.00 4.64 0.04 1.2 2.4 0.3 0.3 11.6 2.6 0.3 5.8 21.2 75.4
P2 Dry season 9.86 . 105 ± 0.45 3.80 4.7 0.06 2.9 0.7 0.2 0.2 0.3 1.5 0.3 0.7 46.6 189.6
P3 Dry season 7.13 . 105 > 3.00 4.10 6.21 0.04 1.9 0.8 0.2 0.3 0.6 1.6 0.3 8 44.2 130.3
Liu et al.
(2015) [47] River Estuary Pearl P01 Surface water 1 7.01 0.22 0 4.8 139.7 14.8 78.6
P03 Surface water 1 7.24 3.47 0 2 21.4 24.6 102.5
P07 Surface water 1 6.99 0.72 0 2 34.4 43.1 105
P01 Bottom water 7 7.01 0.51 0 4.7 140.1 14.7 96.1
P03 Bottom water 3 7.21 3.14 0 2.2 30.6 26.4 103
P07 Bottom water 19 6.98 0.62 0.1 2 31.1 41.9 106.4
Yan et al.
(2015) [48] River
Three Gorges Reservoir XXR_E Lacustrine system, Xiangxi
River estuary 8.24 7.96 374.9 2.1 0.9 0.7 29.4 7.6
XXR_M
Lacustrine system, Xiangxi River
midstream
8.83 12.26 332.3 1.9 1 0.8 15.3 5.3
WJB
Lacustrine system, Wujia
Bay
9.28 19.43 266.8 0.1 0.6 0.2 4.4 3.8
XXR_U
Riverine system, Xiangxi
River upstream 9.52 16.42 282.5 4.1 1.9 0.2 1.5 3.1
BSR_E
Riverine system, Baisha
River estuary
9.25 15.01 266.1 6.8 3.1 0.2 1.3 3.6
SDR_E
Riverine system, Shendu
River estuary 9.24 16.43 271.4 4.6 2.3 0.3 0.4 4.3
Tseng et al.
(2013) [49] Reservoir
Feitsui Reservoir
(FTR)
M1 North Taiwan Located in 32.46 . 105 9.08 7.64 0.09 0.04 0.1 0.3 13.8
M2 North Taiwan Located in 34.44 . 105 8.09 9.45 0.08 0.04 0.1 0.3 17.6
M3 North Taiwan Located in 23.21 . 105 6.52 7.99 0.06 0.03 0.1 0.1 61
49
M5 North Taiwan Located in 35.33 . 105 9.13 6.92 0.08 0.04 0 0.3 35.8
M6 North Taiwan Located in 13.85 . 105 6.96 6.99 0.06 0.04 0 0.1 37.6
Ghai et al.
(2011) [50] River Solimões-Amazon
Whitewater streams with high sediment concentrations
8 7.09 5.05 109.7
Hemme et al. (2010)
[51] Groundwater Oak Ridge FW301
Pristine
groundwater ± 7.00 6.5
Research Field
Center FW106
Uranium
contamination 104–105 ± 12.00 3.70 0.26 10046.6
50 We also found that sand and silt percentages and bacterial and eukaryotic cell counts differed among sampling points (Table 1). Although none of the samples contained clay, P1 had a lower percentage of coarse sand than the other sites and was the only site with silt during both seasons. Picoeukaryotes were detected only in the protected areas (in both seasons), whereas Synechococcus was detected only in P2 in the dry season (Table 1). Total virus counts were higher in samples obtained during the dry season than in those obtained during the wet season (S1B Fig.). In addition, bacterial cell counts were higher in samples obtained from P1 than in samples from the protected sampling points (Fig. 2 and S1A Fig.). Analysis of trace elements is shown in S2 Table.
Microbial community structure
The 454 pyrosequencing of the 16S rRNA gene revealed similar profiles at high taxonomic levels (phylum and some classes) among the samples (Fig. 3 and S3 Table), and statistical differences were not found between any of the diversity indices tested (S4 Table). The phylum Proteobacteria (primarily Betaproteobacteria) accounted for 79.54% of the OTUs and was observed in all samples analyzed (Fig. 3A). Burkholderiales, an order within Betaproteobacteria, was most frequently detected, contributing 70% of all OTUs (S3 Table). The OTUs from this order belonged mainly to the families Comamonadaceae (represented by the genus Limnohabitans and other genera) and Burkholderiaceae (represented by the genus
Polynucleobacter). The abundance of Comamonadaceae was similar across sampling points during the wet season (P1 (30.09%), P2 (44.38%), P3 (24.10%), p > 0.05) and dry season (P1 (45.44%), P2 (46.07%), P3 (36.60%), p > 0.05). The abundance of the genus Limnohabitans