c o m p l i a n c e i n g o u t p a t i e n t s
Lígia Silva
*, Eugenio De Miguel
**, Diana Peiteado
**, Alejandro Villalba
**,
Martin Mola
**, José Pinto
*, Francisco S. Ventura
**Rheumatology Department, Hospital de São João and Faculdade de Medicina da Universidade do Porto, Portugal
**Rheumatology Department, Hospital La Paz, Madrid, Spain
sented higher rate of gout flares and final sUA. Eva -luating the 3 “outcomes of non-response”, we have noticed a tendency for association with long di -sease duration, self-report of previous non-com-pliance (frequently attributed to gout flare), hi gher initial sUA and kidney failure. These patients ten -ded to be less often treated with NSAID, and more often treated with allopurinol. Gout flare correla ted to selfreport of noncompliance and no sonogra -phic improvement. Sonogra-phic non response also correlated to higher final sUA.
Conclusions: This study shows an association be-tween some clinical features and non-compliance, but above all, and unlike the majority of other stu -dies, it has found a correlation between non-com-pliance with possible causes of worst response or lower rate of treatment, such as hyperuricosuria, nephrolithiasis, kidney failure, and contraindica-tion for NSAID treatment. The data which is based on a comprehensive and detailed clinical assess-ment, might point out hidden elements, which might go beyond the visible non-compliance, contributing to the frequent lack of control of the di -sease.
Keywords: Gout; Compliance; Adherence; Serum Uric Acid; Ultrasound.
Introduction
Gout is the most common inflammatory arthritis in men and older women; it has been estimated to affect about 1 to 1.4% of the total population, approximately 7% of men and 3% of women aged over 65 years old, but estimates vary widely, de-pending on population under study. Its prevalence has increased in recent decades, possibly related to popu lation aging, increasing obesity and changing lifestyles worldwide1-4.
It is associated with tissue deposition of mo -nosodium urate (MSU) crystals, usually in patients with a prolonged history of hyperuricemia. It gene
-Abstract
Introduction: Despite its relative high prevalence, potential devastating clinical consequences and socio-economic impact, the existence of effective drugs to treat it, and the well recognised direct re-lation between acute flares and treatment inter-ruptions and its resumption, gout is still often con-sidered the chronic disease with the worst rate of adherence to therapy. The reason for this is un-known. We proposed to thoroughly evaluate a sub-group of patients, aiming at identifying the clinical features predictive of non-compliance, and 5 dif-ferent ways to assess those.
Methods: We analysed a number of clinical, analy -tical and ultrasound data relating to 34 gout pa-tients (according to the Wallace-ARA diagnostic cri-teria for gout 1977 and the EULAR recommenda-tions for gout diagnosis 2006), which were followed in a specialized rheumatology consultation as part of an ongoing study for ultrasound validation in gout. To assess non-compliance, we compared the prevalence of each one of these clinical features with 5 outcomes (2 of which related to “non-com-pliance”: self-report of non-adherence to therapy and missing consultation, and 3 other outcomes related to “non-response”: gout flare(s), final serum uric acid (sUA) ≥ 6 mg/dL, and no sonographic im-provement) registered during a 1 year of follow-up assessment.
Results: We have found an association between younger age, higher body mass index, previous treatment with urate lowering drugs, self-report of previous non-compliance, nephrolithiasis and hy-peruricosuria and the “outcomes of noncompliance”. These patients tended to be less often trea -ted with NSAID and allopurinol, and more often treated with corticosteroid and benzbromarone during the 1 year follow-up. They have also
pre-rally presents as recurrent episodes of monoarthri-tis, causing severe pain and impairment. If left un-treated, it progresses as attacks, which become in-creasingly frequent, reaching progressively more joints and accumulating structural damage. At the end of its clinical spectrum, it can manifest as chronic destructive polyarthritis, affecting also other tissues, such as kidney (uric acid nephropa-thy and nephrolithiasis), or juxta-articular and subcutaneous tissues (gouty tophi)5. Moreover, it has also been associated with increased cardio-vascular morbidity and mortality5,6.
Despite being known for centuries5, its preva-lence1,4,7, its potential devastating clinical conse-quences, its economic impact5,8, the existence of ef-fective drugs1,3,9, and the frequent and direct rela-tion between acute flares (and higher levels of sUA) with treatment interruptions2,7,10and resuming, it continues to be described by several studies as the chronic disease with the worst rate of drug adhe -rence, ranging from 26-74%7,11-13. The reasons for this are unknown. Probably this is due to several different conjoint factors. Many studies suggest different patient, care system or medication factors as being responsible for this, but all agree on one point: there is insufficient data7,11,14,15.
This study aims at thoroughly evaluate a small group of patients followed in a specialized consul-tation, to identify clinical risk factors which can be associated with poor compliance to therapy, and it aims at presenting 5 different ways to assess this.
Methods
The patients included in this analysis are partici-pants in a prospective study of ultrasound evalua-tion of gout, started in 2008, and still ongoing (pre-liminary results were presented at the EULAR 201016). They were recruited from the outpatient rheumatology department of the Hospital La Paz, in Madrid, to a different consultation specifically created for the purposes of that study, where they had a clinical, analytical and sonographic evalua-tion at 1, 3, 6, 9 and 12 months from the first visit. Patients with a doubtful diagnosis of gout, and those with gout and concomitant diseases possi-bly associated with arthritis, such as psoriasis or cancer, were excluded from the study. A total of 34 adults aged 18 years or older, were diagnosed gout according to the Wallace-ARA diagnostic criteria for gout (1977)17and the EULAR recommendations
for gout diagnosis (2006)18. All of them had hyper-uricemia and at least one sonographic sign sug-gestive of gout at their 1stvisit.
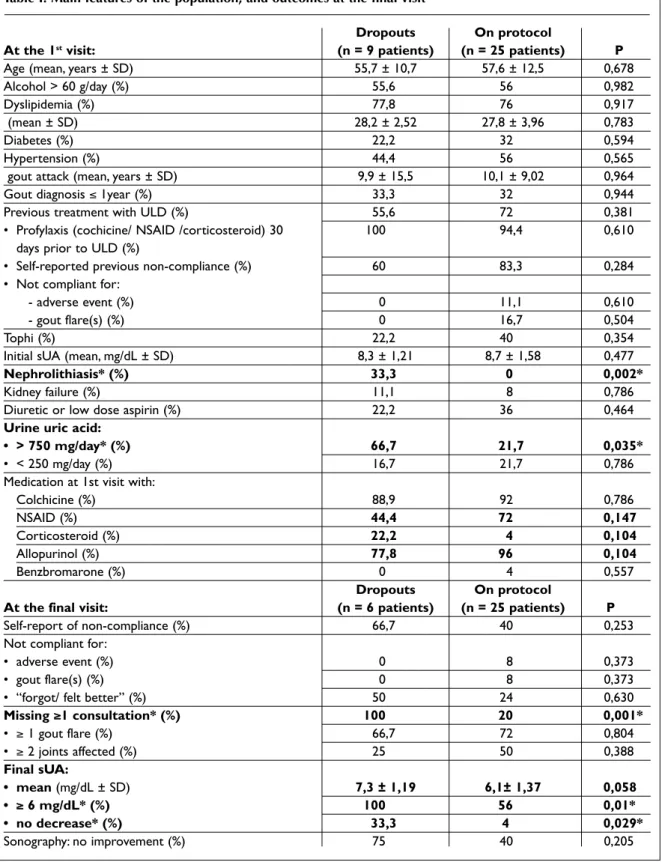
To study the risk factors of poor adherence to therapy, we have collected data from these medi-cal registers, filling a protocol focusing on epi-demiological, clinical, analytical and ultrasound aspects (Table I). We have noted several factors such as age, sex, history of excessive alcohol con-sumption (greater than 60 g/day), dyslipidemia, body mass index (BMI), diabetes, hypertension, time elapsed since the 1stepisode of arthritis, presen ce of tophi, initial sUA, previous treatment with urate lowering drugs (ULD) allopurinol or benzbromarone, and prophylaxis with colchicine, NSAID or corticosteroid within the 30 days prior to its start, selfreported compliance (defined as ta -king medication regularly, as prescribed), and if not compliant, whether the reason was an adverse event or the worsening of the disease with gout flare(s), attributed to the drug by the patient. Be-sides the direct effect of some of these factors in uric acid metabolism, these were selected, in accor dance to previous studies, as potentially rela -ted to poor adherence6,7,14. We have also collected data to assess possible causes of poor response to the rapy or contraindication to NSAID or ULD, such as history of nephrolithiasis, kidney failure, medi-cation with diuretic or low dose aspirin, and urine uric acid, since these can hinder control of the diease, causing non-compliance4,5,19. To assess adhe rence one year after the 1stevaluation, we have registered 2 “non-compliance outcomes”: the medication prescribed during the 1 year follow-up and self-report of compliance to it during this time interval (or if not, whether was due to an adverse event, gout flare(s) or “other causes”), and the non attendance to one or more follow-up visits. We have also noted 3 “non-response outcomes”: gout flares (defined as episodes of arthritis requiring NSAID, colchicine or corticosteroid), and if so, whether one or more joints were affected, the ini-tial and 12thmonth levels of sUA, and the evolution of ultrasound signs of gout. We considered a sono-graphic improvement when there was a decrease in a score that resulted from the sum of the loca-tions with hyperechoic aggregates or areas of MSU deposit and Doppler signal (semi-quantitative scale), in 20 different locations in joints and tendons in feet, ankles and knees. This is being eva -luated and properly valued in the ongoing ultra-sound study16.
Table I. Main features of the population, and outcomes at the final visit
Dropouts On protocol
At the 1stvisit: (n = 9 patients) (n = 25 patients) P
Age (mean, years ± SD) 55,7 ± 10,7 57,6 ± 12,5 0,678
Alcohol > 60 g/day (%) 55,6 56 0,982
Dyslipidemia (%) 77,8 76 0,917
(mean ± SD) 28,2 ± 2,52 27,8 ± 3,96 0,783
Diabetes (%) 22,2 32 0,594
Hypertension (%) 44,4 56 0,565
gout attack (mean, years ± SD) 9,9 ± 15,5 10,1 ± 9,02 0,964
Gout diagnosis ≤ 1year (%) 33,3 32 0,944
Previous treatment with ULD (%) 55,6 72 0,381
• Profylaxis (cochicine/ NSAID /corticosteroid) 30 100 94,4 0,610
days prior to ULD (%)
• Self-reported previous non-compliance (%) 60 83,3 0,284
• Not compliant for:
- adverse event (%) 0 11,1 0,610
- gout flare(s) (%) 0 16,7 0,504
Tophi (%) 22,2 40 0,354
Initial sUA (mean, mg/dL ± SD) 8,3 ± 1,21 8,7 ± 1,58 0,477
Nephrolithiasis* (%) 33,3 0 0,002*
Kidney failure (%) 11,1 8 0,786
Diuretic or low dose aspirin (%) 22,2 36 0,464
Urine uric acid:
• > 750 mg/day* (%) 66,7 21,7 0,035*
• < 250 mg/day (%) 16,7 21,7 0,786
Medication at 1st visit with:
Colchicine (%) 88,9 92 0,786 NSAID (%) 44,4 72 0,147 Corticosteroid (%) 22,2 4 0,104 Allopurinol (%) 77,8 96 0,104 Benzbromarone (%) 0 4 0,557 Dropouts On protocol
At the final visit: (n = 6 patients) (n = 25 patients) P
Self-report of non-compliance (%) 66,7 40 0,253
Not compliant for:
• adverse event (%) 0 8 0,373
• gout flare(s) (%) 0 8 0,373
• “forgot/ felt better” (%) 50 24 0,630
Missing ≥1 consultation* (%) 100 20 0,001* • ≥ 1 gout flare (%) 66,7 72 0,804 • ≥ 2 joints affected (%) 25 50 0,388 Final sUA: • mean (mg/dL ± SD) 7,3 ± 1,19 6,1± 1,37 0,058 • ≥ 6 mg/dL* (%) 100 56 0,01* • no decrease* (%) 33,3 4 0,029* Sonography: no improvement (%) 75 40 0,205
Legend: SD – Standard Deviation, BMI – body mass index, ULD – urate lowering drug, NSAID – nonsteroidal anti-inflammatory drug, sUA – serum uric acid.
The results were analyzed using SPSS version 10.5 software (SPSS, Chicago, IL). Comparison be-tween means was performed using the Student's t-test for independent samples. A P value less than 0.05 was considered statistically significant.
Results
This study comprised 34 subjects with a mean age of 57,1 ± 11,8 years. Only 2 were female. Nine pa-tients discontinued the study before completing the 1 year protocol: 3 (including 1 woman) attend-ed only the 1stconsultation, and the remai ning 6 were followed for an average of 4 months. Table I presents the population's features and the 5 out-comes assessed, registered during follow-up. The 9 patients who discontinued the study were quite similar to the group of 25 who completed the pro-tocol, except they presented more cases of hyper-uricosuria and all cases of nephrolithiasis. They also tended to be less often treated with NSAID and al-lopurinol, and more frequently with corticosteroid. By analyzing the records of the last visit, beyond the obvious lower adherence to medical consulta-tion, the patients who have dropped out before the 1 year of follow-up (6 patients) had a lower rate of reduction in levels of sUA, 33,3% had no decrease at all, and none reached levels below 6 mg/dL. Simi -lar to the previous medication for gout, also during the follow-up period, there was no mention to adver se events or exacerbation of the disease as a cause to suspend therapy, but 50% of them cited they “forgot” or “tried to suspend because felt bet-ter”. In the 25 patients group on the protocol, 83,3% reported noncompliance to medication pres -cribed prior to this study, and of these, only 11,1% claimed to have suspended colchicine and allopu -rinol for adverse events (diarrhoea and worsening of arthritis, respectively). During the 1 year follow--up, 8% suspended colchicine for epigastric pain, 8% left allopurinol for gout flares, and 24% assumed forgetfulness. One patient, who had pre viously sus-pended colchicine for diarrhoea, was prescribed a lower dose, and presented good tole rance.
Focusing on the 25 patients on protocol, we have analyzed data comparing the prevalence of the clinical features observed, in relation to 5 outcomes (versus their reciprocal, as exemplified in Tables II and III): self-report of non-compliance during the 1 year follow-up, missing (≥ 1) medical consulta-tion, having (≥ 1) gout flare(s), final sUA
≥ 6 mg/dL, and having no sonographic improve-ment. Table IV summarizes our most significant findings.
Comparing self-reports of “non-compliance” versus “compliance” to therapy during the follow--up, the “non-compliant” had less often urine uric acid < 250 mg/day (0% versus 35,7%, P value of 0,026). Moreover, 100% (versus 72,7%) reported they were also not compliant previously, and there was also a trend for younger age (52,6 ± 8,8 versus 61 ± 13,7 years, P = 0,101). Comparing “non-com-pliance” with the other 4 outcomes, self-report of non-compliance was associated to a higher rate of acute flares (90% versus 60%, P = 0,110).
Patients who “missed (≥ 1) consultation” had higher BMI (31 ± 3,4 versus 27 ± 3,8 kg/m2, P = 0,043), and were more frequently treated with benzbromarone during follow-up (20% versus 0%, P = 0,043). None had a recent (< 1 year) diagnosis of gout (versus 40% in the reciprocal group, P = 0,09), and all of them had previously been treat-ed with ULD.
Having “≥ 1 gout flare(s)” versus “no gout flare(s)” during the 1 year follow-up was correla ted with higher self-report of non-adherence to the rapy (92,9% versus 50%, P = 0,045 for treatments pre-scribed before, and 50% versus 14,3%, P = 0,110 for drugs prescribed during this study). Comparing this outcome with the other 4, having gout flares tended be correlated with “no sonographic im-provement” (50% versus 14,3%, P = 0,110).
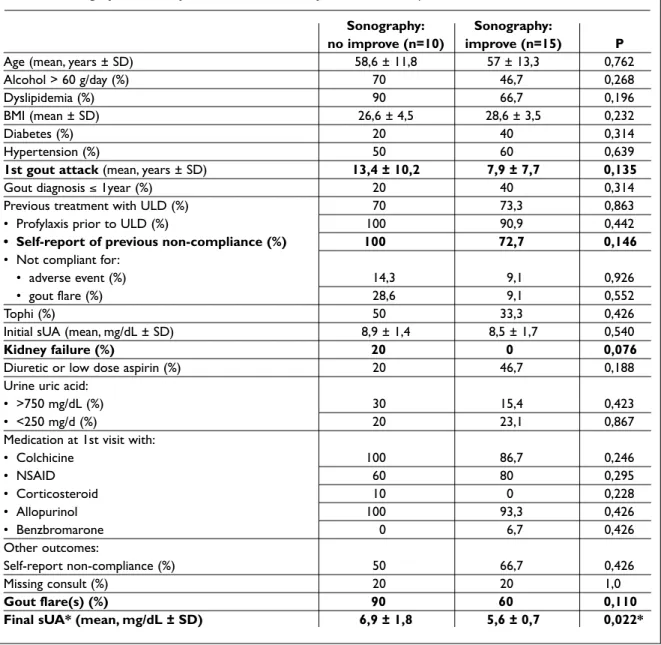
Besides having significantly higher sUA initial levels, patients with “final uricemia levels ≥ 6 mg/dL” (versus “< 6”) (Table II) tended to report more often having suspended treatment due to gout worsening, and were less often treated with NSAID. “No sonographic improvement” tended to be asso-ciated with longer disease duration, self-report of previous non-compliance, kidney failure and gout flare(s), but the only significant correlation was the higher final sUA level (Tables II and III).
Discussion
Despite its huge impact, little is known about (non adherence) to gout treatment, its true prevalence, its causes, its consequences, and the best way to monitor and improve it. Some studies point out to different patient characteristics (such as younger age, fewer comorbid conditions, being treated with NSAID previous to ULD, male sex and some
cop-ing patterns, presumably reflectcop-ing decreased mo-tivation or level of expertise in management of the disease)7,12,14, and health-care system or medica-tion problems (such as low index of medical sup-port, initiating ULD in higher doses or with no colchicine prophylaxis, and inefficacy or side ef-fects of drugs)1,2,12,19-22. However, one major limita-tion of the few directed studies is the lack of sta-tistical power of their findings, and the difficulty to compare among the existing studies, because they measure different things, apply to distinct popu-lations (ethnicity, consultation contexts, causes and severity of gout), use different definitions of
adherence and different methods to assess it7,11,14,15. Our study found a correlation of clinical features with measurements of compliance and non--response. Based on specialized and accurate me-di cal records (clinical, analytical and sonogra phic) of two rheumatologists directed to this subject, we were able to overcome some limitations of pre -vious studies based on administrative and phar-macists records, which presented shortcomings regarding the proper diagnosis of gout, the regis-tration of the cause of non-adherence, the appre-ciation of the importance of other causes of poor adherence and the response to therapy, among
Table II. Final uricemia levels «≥ 6» versus «< 6» mg/dL at 1 year
Final sUA ≥ 6 Final sUA <6
(n=14) (n=11) P
Age (mean, years ± SD) 60,1 ± 13,7 54,5 ± 10,5 0,268
Alcohol > 60 g/day (%) 57,1 54,5 0,902
Dyslipidemia (%) 78,6 72,7 0,747
BMI (mean ± SD) 28,2 ± 4,5 27,3 ± 3,2 0,621
Diabetes (%) 35,7 27,3 0,669
Hypertension (%) 50 63,6 0,516
1st gout attack (mean, years ± SD) 9,5 ± 10 10,8 ± 7,9 0,727
Gout diagnosis ≤ 1year (%) 35,7 27,3 0,669
Previous tx with ULD (%) 71,4 72,7 0,946
• Profylaxis prior to ULD(%) 100 87,5 0,276
• Self-report of previous non-compliance (%) 80 87,5 0,693
• Not compliant for:
• adverse event (%) 0 25 0,120
• gout flare(s) (%) 30 0 0,104
Tophi (%) 35,7 45,5 0,639
Initial sUA* (mean, mg/dL ± SD) 9,5 ± 0,9 7,7 ± 1,7 0,002*
Kidney failure (%) 14,3 0 0,207
Diuretic or low dose aspirin (%) 35,7 36,4 0,975
Urine uric acid:
• >750 mg/dL (%) 25 18,2 0,966
• <250 mg/d (%) 33,3 9,1 0,344
Medication at 1st visit with:
• Colchicine (%) 92,9 90,9 0,866 • NSAID (%) 57,1 90,9 0,066 • Corticosteroid (%) 7,1 0 0,387 • Allopurinol (%) 100 90,9 0,268 • Benzbromarone (%) 0 9,1 0,268 Other outcomes: Self-report non-compliance (%) 42,9 36,4 0,755 Missing consult (%) 14,3 27,3 0,442 Gout flare(s) (%) 71,4 72,7 0,946 Sonography: no improvement*(%) 57,1 18,2 0,05*
Table III. Sonographic «no-improvement» versus «improvement» at 1 year
Sonography: Sonography:
no improve (n=10) improve (n=15) P
Age (mean, years ± SD) 58,6 ± 11,8 57 ± 13,3 0,762
Alcohol > 60 g/day (%) 70 46,7 0,268
Dyslipidemia (%) 90 66,7 0,196
BMI (mean ± SD) 26,6 ± 4,5 28,6 ± 3,5 0,232
Diabetes (%) 20 40 0,314
Hypertension (%) 50 60 0,639
1st gout attack(mean, years ± SD) 13,4 ± 10,2 7,9 ± 7,7 0,135
Gout diagnosis ≤ 1year (%) 20 40 0,314
Previous treatment with ULD (%) 70 73,3 0,863
• Profylaxis prior to ULD (%) 100 90,9 0,442
• Self-report of previous non-compliance (%) 100 72,7 0,146
• Not compliant for:
• adverse event (%) 14,3 9,1 0,926
• gout flare (%) 28,6 9,1 0,552
Tophi (%) 50 33,3 0,426
Initial sUA (mean, mg/dL ± SD) 8,9 ± 1,4 8,5 ± 1,7 0,540
Kidney failure (%) 20 0 0,076
Diuretic or low dose aspirin (%) 20 46,7 0,188
Urine uric acid:
• >750 mg/dL (%) 30 15,4 0,423
• <250 mg/d (%) 20 23,1 0,867
Medication at 1st visit with:
• Colchicine 100 86,7 0,246 • NSAID 60 80 0,295 • Corticosteroid 10 0 0,228 • Allopurinol 100 93,3 0,426 • Benzbromarone 0 6,7 0,426 Other outcomes: Self-report non-compliance (%) 50 66,7 0,426 Missing consult (%) 20 20 1,0 Gout flare(s) (%) 90 60 0,110
Final sUA* (mean, mg/dL ± SD) 6,9 ± 1,8 5,6 ± 0,7 0,022*
others7,23.
Similar to several previous studies, high sUA le -vels (≥ 6 mg/dL) tended to be associated with flares8,10,20, and in this study, we have also found trends of correlation to “report of non-compliance” and “no signs of ultrasonic improvement”, not pre-viously evaluated. There is evidence of clinical out-comes being consistently better with sUA levels bel-low 6 mg/dL, in accordance with the saturation point of MSU. This threshold has been very useful, and is the most repeatedly recommended in guide-lines, for use in clinical practice and research, as a surrogate marker of efficacy and compliance to
therapy13,24,25. However, it is an arbitrary target le vel that needs validation. For instance, some studies suggest that there should be a dynamic cut-off, over time. Initially, the reduction of sUA should be as slow as possible, to minimize the risk of flare, and in some subpopulations of patients, like those with tophaceous gout, sUA levels should be as low as possible. But no study has formally evaluated the effectiveness and risks of these strategies2,26,27. Our results come in line with this perspective. We have found trends of correlation of some clinical features like nephrolithiasis (all patients with ne phrolithiasis discontinued the study), kidney fai
-lure and urine uric acid abnormalities, with the 5 outcomes used to measure “non-compliance” and “nonresponse”. Our study suggests that nonres -ponse and contraindication to drugs like ULD or NSAID may be decisive as cause of non-compli-ance, as it hinders adjustment to medication, lead-ing the patient to suspend it, and when trylead-ing to resume it, it aggravates the disease. So, these clini -cal features may mediate other pathogenic path-ways that eventually redound in non-adherence by unmotivated patients22.
The sonographic outcome was the most often related to the parameters of poor response to treat-ment. However, this is still a crude preliminary analysis, that needs to be confirmed, and further
research (as the one that is underway on this same population) is necessary to evaluate and validate sonographic findings in gout16,28-30. In any case, this is consistent with the logical link that some stu dies demonstrate to exist between the decreased de-tection of urate crystals in synovial fluid (even in asymptomatic joints) or reduction in tophi area, in those patients on treatment with ULD who showed reducing levels of sUA2,26,31,32. The small number of participants, but more important, the lack of a con-trol group of gout patients in outpatient treatment, reduced the statistical power of this study. These factors might explain why we didn't reach statisti-cal significance on clinistatisti-cal features like dyslipi-demia, hypertension or presence of tophi, but
Table IV. Summary of the trends of correlation found in this study Measurements of
non-compliance Associated clinical features Associated outcomes
Self-report of non-compliance • Younger age • Gout flare(s)
(during the 1 year follow-up) • Self-report of previous non-compliance
• Less often urine uric acid < 250mg/dL*
Abandoning the study • Nephrolithiasis* + • Missing consultation*
(before 1 year of follow-up) • Urine uric acid >750mg/dL* • Higher final sUA*
• Less often treated with NSAID and allopurinol, and more often with corticosteroid during follow-up
Missing consult(s) • Higher BMI* Ø
(during the 1 year follow-up) • Gout diagnosis >1 year
• Previous treatment with ULD • Treatment with benzbromarone
during follow-up* Measurements of
non-response (at 1 year)
Gout flare(s) • Self-report of previous non-compliance* • Self-report of non-compliance
• Treatment with allopurinol during (during follow-up)
follow-up • No sonographic improvement
Final sUA ≥ 6 mg/dL • Higher initial sUA* • No sonographic
• Self-report of previous non-compliance improvement*
because it caused gout flare (less often for adverse events)
• Less often treated with NSAID during follow-up
No sonographic improvement • Long disease duration • Gout flare(s)
• Self-report of previous non-compliance • Higher final sUA*
• Kidney failure
Legend: sUA – serum uric acid, BMI – body mass index, ULD – urate lowering drug, NSAID – nonsteroidal anti-inflammatory drug. Notes: +all patients with history of nephrolithiasis abandoned the study before 1 year of follow-up, so this factor was not taken into account in the remaining analysis of risk assessment. *statistical significance
most likely this was the result of evaluating a more homogeneous group of selected patients which presented a more severe disease, and were referred to a specialized consultation. However, in fact, this might have contributed to a concentration of markers of noncompliance (including nonres -ponse), which may have been instrumental to find new trends to guide future research.
Conclusion
Treatment and monitoring of gout must be pa-tient-tailored, and this study suggests that there might be much more behind the apparent “psy-chosocial factors” determining non-adherence to therapy. We have found correlation of higher BMI, nephrolithiasis and urine uric acid abnormalities with non-compliance, which correlated to gout flare, no sonographic improvement and/ or hi gher sUA. Possibly, patients with different pathogenic mechanisms and contraindication or insufficient response to therapy of gout, need a different approach from the start (for instance, reinforce-ment of prophylaxis) and also special attention over time. Efforts should be made to standardize the best methods to assess compliance, since this is probably one main reason for gout widespread suboptimal care. Frequent regular consultations (as 1 month interval, at onset), with quantification of improvement by clinical, analytical and, some-times, ecographic means, can be a very rewarding strategy.
Correspondence to
Lígia Silva
Serviço de Reumatologia do Hospital de São João, Alameda Professor Hernâni Monteiro
4202-451 Porto, Portugal E-mail: [email protected]
References
1. Mikuls TR. Qua lity of care in gout: from me a su re ment to im pro ve ment. Clin Exp Rheu ma tol 2007;25:114-119. 2. Pe rez-Ruiz F, Li o té F. Lowe ring se rum uric acid le vels: what is the op ti mal tar get for im pro ving cli ni cal out -co mes in gout? Arthri tis Rheum 2007;57:1324-1328. 3. Baker JF, Ralph Schu ma cher H. Up da te on gout and
hype ru ri ce mia. Int J Clin Pract (pu blis hed on li ne) 2009 Nov. doi:10.1111/j.1742-1241.2009.02188.x
4. Do herty M. New in sights into the epi de mio logy of gout. Rheu ma to logy (Ox ford) 2009;48:2-8.
5. Gib son T. Cris tal-re la ted arthro pa thi es. In: Hochberg M, Sil man A et al, ed. Rheu ma to logy. 4th ed. Mosby El -se vi er; 2008. 2:p1805-1837.
6. Io a chi mes cu AG, Bren nan DM, Hoar BM, Ha zen SL, Ho ogwerf BJ. Se rum uric acid is an in de pen dent pre -dic tor of all-cau se mor ta lity in pa ti ents at high risk of car dio vas cu lar di se a se: a pre ven ti ve car di o logy in for ma ti on system (Pre CIS) da ta ba se co hort study. Arthri -tis Rheum 2008;58:623-630.
7. Har rold LR, An dra de SE, Bri e sa cher BA et al. Ad he ren -ce with ura te-lowe ring the ra pi es for the tre at ment of gout. Arthri tis Res Ther 2009;11:R46.
8. Hal pern R, Mody RR, Ful de o re MJ, Pa tel PA, Mikuls TR. Im pact of non com pli an ce with ura te-lowe ring drug on se rum ura te and goutre la ted he althca re costs: ad -mi nis tra ti ve claims analysis. Curr Med Res Opin 2009;25:1711-1719.
9. Terkel ta ub R, Zel man D, Sca vul li J, Pe rez-Ruiz F, Li o té F. Gout Study Group: Up da te on hype ru ri ce mia and gout. Jo int Bone Spi ne 2009;76:444-446.
10. Sho ji A, Ya ma naka H, Ka ma ta ni N. A re tros pec ti ve study of the re la ti ons hip betwe en se rum ura te le vel and re cur rent at tacks of gouty arthri tis: evi den ce for re duc ti on of re cur rent gouty arthri tis with an tihype ru ri -ce mic the rapy. Arthri tis Rheum 2004;51:321-325. 11. Har rold LR, An dra de SE. Me di ca ti on ad he ren ce of pa
ti ents with se lec ted rheu ma tic con di ti ons: a syste ma -tic re vi ew of the li te ra tu re. Se min Arthri tis Rheum 2009;38:396-402.
12. de Klerk E, van der Heijde D, Lan dewé R, van der Tem pel H, Ur qu hart J, van der Lin den S. Pa ti ent com pli an -ce in rheu ma toid arthri tis, polymyal gia rheu ma ti ca, and gout. J Rheu ma tol 2003;30:44-54.
13. Bri e sa cher BA, An dra de SE, Fou ayzi H, Chan KA. Com -pa ri son of drug ad he ren ce ra tes among -pa ti ents with se ven dif fe rent me di cal con di ti ons. Phar ma co the rapy 2008;28:437-443.
14. Har rold LR, An dra de SE, Bri e sa cher B et al. The dyna -mics of chro nic gout tre at ment: me di ca ti on gaps and re turn to the rapy. Am J Med 2010;123:54-59.
15. Ri e del AA, Nel son M, Jo sephRid ge N, Wal la ce K, Mac Do nald P, Becker M. Com pli an ce with al lo pu ri nol the rapy among ma na ged care en rol le es with gout: a re tros -pec ti ve analysis of ad mi nis tra ti ve claims. J Rheu ma tol 2004;31:1575-1581.
16. D. Pei te a do Lo pez, A. Vil lal ba, E. De Mi guel, M.C. Or do ñez, E. Mar tín Mola. Lon gi tu di nal study of ul tra so no graphy sen si bi lity to chan ge in pa ti ents with gout af -ter one year of tre at ment. Ann Rheum Dis 2010;69:713. 17. Wal la ce S L, Ro bin son H, Masi A T, Decker J L, McCar-ty D J, Yu T F. Pre li mi nary cri te ria for the clas si fi ca ti on of the acu te arthri tis of pri mary gout. Arthri tis Rheum 1977;20:895-900.
18. Zhang W, Do herty M, Pas cu al E et al. EU LAR evi den ce ba sed re com men da ti ons for gout. Part I: Di ag no sis. Re port of a task for ce of the Stan ding Com mit tee for In -ter na ti o nal Cli ni cal Stu dies In clu ding The ra peu tics (ES CI SIT). Ann Rheum Dis 2006;65:1301-1311. 19. Pil lin ger MH, Ke e nan RT. Up da te on the ma na ge ment
of hype ru ri ce mia and gout. Bull NYU Hosp Jt Dis 2008;66:231-239.
-wer KK, Bakst AW. Se rum ura te le vels and gout fla res: analysis from ma na ged care data. J Clin Rheu ma tol 2006;12:61-65.
21. Singh JA. Qua lity of life and qua lity of care for pa ti ents with gout.Curr Rheu ma tol Rep 2009;11:154-160. 22. Singh JA, Hod ges JS, Asch SM. Op por tu ni ti es for im pro
-ving me di ca ti on use and mo ni to ring in gout. Ann Rheum Dis 2009;68:1265-1270.
23. An dra de SE, Kahler KH, Frech F, Chan KA. Me thods for eva lua ti on of me di ca ti on ad he ren ce and per sis ten ce using au to ma ted da ta ba ses. Phar ma co e pi de miol Drug Saf. 2006;15:565-74; dis cus si on 575-7.
24. Zhang W, Do herty M, Bar din T et al. EU LAR evi den ce ba sed re com men da ti ons for gout. Part II: Ma na ge -ment. Re port of a task for ce of the EU LAR Stan ding Com mit tee for In ter na ti o nal Cli ni cal Stu dies In clu ding The ra peu tics (ES CI SIT). Ann Rheum Dis 2006;65:1312--1324.
25. Pe rez-Ruiz F. Tre a ting to tar get: a stra tegy to cure gout. Rheu ma to logy (Ox ford) 2009;48:ii9-ii14.
26. Pe rez-Ruiz F, Ca la bo zo M, Pi jo an JI, Her re ro-Bei tes AM, Ru i bal A. Ef fect of ura telowe ring the rapy on the ve lo -city of size re duc ti on of top hi in chro nic gout. Arthri tis Rheum 2002;47:356-360.
27. Hershfi eld MS. Re as ses sing se rum ura te tar gets in the ma na ge ment of re frac tory gout: can you go too low? Curr Opin Rheu ma tol 2009;21:138-142.
28. Thi e le RG, Schle sin ger N. Di ag no sis of gout by ul -trasound. Rheu ma to logy 2007; 46:1116-1121. 29. Car ter JD, Ke dar RP, An der son SR et al. An analysis of
MRI and ul tras ound ima ging in pa ti ents with gout who have nor mal plain ra di o graphs. Rheu ma to logy (Ox -ford) 2009;48:1442-1446.
30. Pe rez-Ruiz F, Dal beth N, Ur re so la A, De Mi guel E, Schle sin ger N. Ima ging of Gout: fin dings and uti lity. Arthri tis Re se arch & The rapy 2009;11:232-239. 31. LiYu J, Claybur ne G, Sieck M et al. Tre at ment of chro
nic gout. Can we de ter mi ne when ura te sto res are de -ple ted enough to pre vent at tacks of gout? J Rheu ma tol 2001;28:577-5780.
32. Becker MA, Schu ma cher HR Jr, Wortmann RL et al. Fe -bu xos tat com pa red with al lo pu ri nol in pa ti ents with hype ru ri ce mia and gout. N Engl J Med 2005;353:2450--2461.