Acquirers’ Value Creation in Green M&A
Deals
A Cross-Sectional Analysis of North America and Europe
August Klemp
Supervisor: Irem Demirci
Master’s in Finance
Nova School of Business and Economics
22.05.2020
A Work Project, presented as part of the requirements for the Award of a Master’s degree in Finance from the Nova School of Business and Economics.
Abstract
Acquirers’ Value Creation in Green M&A Deals
This thesis seeks to investigate acquirers’ post-acquisition performance when buying a "green" company, looking specifically at differences between North America and Europe. I conduct cross-sectional OLS analyses on 423 deals in North America and Europe, between 2000 and 2016, focusing on accounting-based performance measures. My results suggest acquirers are better off buying a green company in North America rather than Europe, despite having to pay higher transaction premiums for companies with lower average ESG scores across the pond. However, my findings fail to confirm previous research that acquiring green companies creates value for bidders in the first place.
Keywords − M&A, Green, Value creation, Accounting-based performance measures
This work used infrastructure and resources funded by Fundação para a Ciência e a Tecnologia (UID/ECO/00124/2013, UID/ECO/00124/2019 and Social Sciences DataLab, Project 22209), POR Lisboa (LISBOA-01-0145-FEDER-007722 and Social Sciences DataLab, Project 22209) and POR Norte (Social Sciences DataLab, Project 22209).
1 Introduction 3
2 Literature Review 4
2.1 Green energy transition and clean technology . . . 4 2.2 Mergers and Acquisitions . . . 5 2.3 Performance measures . . . 6 2.4 Economic and structural differences between North America and Europe . . . . 8
3 Hypothesis 10
4 Data and Sample Selection 12
5 Methodology 14
6 Results 17
7 Conclusion 30
References 33
Appendix 37
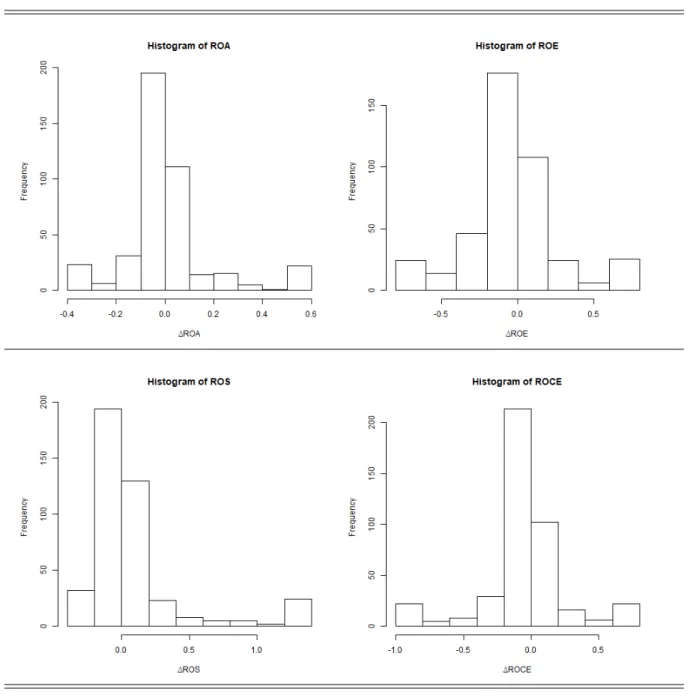
A1 Industry keywords applied to source for "green" deals . . . 37 A2 Histograms of returns . . . 38 A3 VIF test and correlation matrix for interaction variables . . . 38
1
Introduction
In this study, I examine the effects of "green" M&A transactions. As the world is increasingly focusing on sustainability and social impact, environmental, social and governance (ESG) issues become more and more important for companies as well. In 2018, 83% of S&P 500 companies issued reports on sustainability, compared with only 20% in 2011 (Kwon et al., 2018). The area of interest that is sustainable investing is starting to manifest itself in stock returns as well. Renshaw (2018) shows that companies with improving ESG credentials have outperformed their benchmarks by between 0.81% and 2.43% from 2015 to 2018.
Social investing is on the rise and billions of dollars are flowing into "green-only" funds. Morningstar reports that average annual net inflows to sustainability funds between 2013 and 2018 were 30x times higher than from 2009 to 2012 (Morningstar, 2019). New assets invested into mutual funds and ETFs focusing on ESG totalled USD 20.6 billion in 2019, a year-on-year increase of 275% from the previous USD 5.5 billion high in 2018. Many companies want to get in on this hype and reap the rewards of a greener label, and one of the ways of doing so is to acquire a green company − but does this lead to improved performance and better results? My thesis aims at answering this question, and further to provide a comparison between the two geographical regions that have historically dominated the green M&A market.
I contribute to the existing literature by relating the size of the deal to that of the acquirer, in addition to adding three years of observations. I also focus more on green deals in detail using several performance measures, and highlight differences between North America and Europe. My sample does not confirm existing research that acquiring green firms creates value for bidders, but my findings do indicate that acquiring a green target in North America is more beneficial than Europe − but this is only statistically significant in certain scenarios and thus not definitive.
2
Literature Review
This section is centred around a review of relevant research previously conducted on theoretical concepts related to my topic of "green" M&As. First, I look at what makes certain companies "green"; the label which is placed on companies focusing on energy transition and clean technology. Then, I provide an overview of M&As, the reasoning behind them and how their performance is best measured. Subsequently, I investigate the main economic and structural differences between North America and Europe, before I in Section 3 highlight research papers that have looked specifically at topics similar to my thesis in the past.
2.1
Green energy transition and clean technology
Salvi et al. (2018) defines green growth as "a novel type of economic growth and development that ensures natural assets continue to provide resources and environmental services key for the wellbeing of future generations". The "green" label is an umbrella which covers terms like "Corporate Social Responsibility" (CSR), "Environmental, Social and Governance" (ESG), "renewable energy" and "cleantech". CSR and ESG are abbreviations that are used fairly interchangeably today, both referring to the idea that companies are responsible for all their stakeholders (e.g. employees, local communities and the environment), and not just their shareholders (Doh and Guay, 2006). Ellabban et al. (2014) define renewable energy as energy from resources that are replenished during a human life (e.g. solar, wind and water). Cleantech is a compounding of "clean" and "technology", a sector which was born at the start of the year 2000 (Caprotti, 2011), and aims to deliver value with a limited or non-existent use of non-renewable resources, thus creating less waste than conventional alternatives (Pernick and Wilder, 2007). Together, I argue that the aforementioned explanations accurately define the term
"green". However, for variation and simplicity, terms like "cleantech", "green", "ESG", "CSR" and "renewable energy" will be used throughout this thesis in reference to companies involved in green activities. The same logic applies to terms like "merger", "acquisition" and "takeover" in referring to the combination of two companies.
The focus on ESG has intensified in recent years, but researchers have looked for a relationship between an environmental and social focus, and financial performance since the 1970s (Friede et al., 2015). Friede and his colleagues review about 2,200 individual studies on the relationship between ESG and corporate financial performance, and find a non-negative relationship in roughly 90% of them, with the large majority reporting positive findings. According to their findings, focusing on ESG usually enhances performance, and at the very least does not hurt it.
It would seem then, that companies have little to lose in terms of financial performance by focusing more on ESG and becoming more green. In early 2019, IHS Markit (2019) surveyed senior executives at private equity firms, large corporations and asset management firms, asking for their thoughts on ESG’s place in M&A going forward. 53% answered that ESG factors will become significantly more important in 2019 to 2021, with no one believing ESG factors would lose any importance. Such predictions may help explain why the number of green M&A deals is increasing (Salvi et al., 2018).
2.2
Mergers and Acquisitions
Growthis among the two main reasons for companies to merge, according to Gaughan (2017). Growth comes naturally as a result of an acquisition, but green companies can accelerate this as consumers are increasingly focused on sustainability issues, allowing for opportunities of high rate of return (Salvi et al., 2018). This is appealing to companies, as keeping assets from
synergies, which can be split into operational and financial. Operational synergies are to a large extent related to improving margins by increasing revenues (e.g. higher pricing power), and/or reducing costs (e.g. lower unit costs following economies of scale).
Financial synergies are typically the reduction of the entity’s cost of capital. Financial synergies, with regard to green companies, have been thoroughly researched by among others Sharfman and Fernando (2008), Ghoul et al. (2011) and Ng and Rezaee (2015). They find a clear relationship between a firm’s environmental focus and its cost of capital. More specifically, they find that firms focusing more on environmental and governance aspects reduce their cost of equity and can shift from equity to debt financing (subsequently obtaining higher tax benefits). With several investment banks (e.g. JP Morgan Chase and Goldman Sachs) now imposing stricter constraints related to sustainability in terms of what they will help finance, the relative lower cost of capital for ESG-focused companies can become even more substantial going forward.
2.3
Performance measures
M&As in general have been extensively researched, with consensus being that sellers capture the majority of value creation − leaving little to nothing for the buyers. This usually materializes through bidders paying a premium to target shareholders in order to obtain control, thus generating a positive return for the sellers (Jensen & Ruback, 1983). There is no clear consensus on the opposing side, however, and whether bidders experience value creation or destruction is heavily debated. There are two main reasons for this; it is difficult to decide both what to measure, and how to measure it. One could argue for measuring share price performance, sales and market performance, or profitability performance. All of these will say something about value creation, but often with different results. This is especially true when combining it with
the vast number of different ways there are to measure performance. Studies have utilised accounting-based measures such as Return On Assets (ROA), Return On Equity (ROE) and Return On Sales (ROS), as well as market-based measures like Tobin’s Q and Jensen’s α − yielding different and sometimes conflicting results (Zollo & Meier, 2008).
In determining "value creation", most of the literature focuses on stock market reactions (Cording et al., 2010). This can either be done through the event study methodology (short term) or long-term stock market performance. These differ in long-terms of time horizon, but both reflect investors’ expectations of future returns. This in turn assumes that investors act rationally and have the necessary information available to accurately assess future cash flows. The assumption of rationality is a strong one, and has been questioned by several scholars (e.g. Bromiley et al., 1988).
To avoid the assumption of rationality, I make use of accounting-based performance measures, to investigate if there is fundamental value creation taking place for acquirers of green companies − and how it may differ between North America and Europe. Cording et al. (2010) argue that the most common method is to use changes in ROE, ROS or ROA, from one year before the acquisition to two-to-three years after. Change in accounting-based performance measures has the advantage of reflecting actual returns earned by the firm, and allowing for enough time so that operational synergies can be achieved. In addition, both private and public companies can in theory be included as one is no longer bound by public stock market information. The drawbacks of this methodology are that the longer time horizon means that other factors not related to the acquisition can affect the results (which is also the case with long-term stock market performance), and that management can manipulate accounting figures (Chakravarthy, 1986).
2.4
Economic and structural differences between North
America and Europe
For simplicity, I focus on the United States as a proxy for all of North America in this chapter, as this is by far the largest and most influential economy in the region. The United States and Europe (in aggregate) are two economies of similar size in terms of GDP. The IMF (2019) estimates both regions to have a total GDP of approximately USD 22 trillion in 2018. But to some extent, the similarities end there. Europe has more than twice as many people as the United States, and consists of 44 countries. Brounen et al. (2004) conclude that "the US and European financial markets and firms differ considerably". They justify this statement by referring to several studies conducted on the structural differences between the United States and Europe. Rajan and Zingales (2003) argue that the financial system in Europe is more dependent on institutions and relationships, while a market-based system is more prominent in the United States. The characteristics of the financial systems have also manifested themselves in how corporations finance their activities. A bank-lending model prevails in Europe, where bank loans account for 80% of corporate financing and only 10% stems from debt raised in the market (Le Leslé, 2012). The latter figure compares to 60% in the United States.
Chew (1997) shows that the relationship-based system in Europe also extends to the corporate governance system practiced. Brounen et al. (2004) add to this that shareholder orientation is more prevalent in Anglo-Saxon countries like the United States and the United Kingdom, while this is less important in continental Europe. Such shareholder orientation and legal protection are major determinants of the size and success of a country’s capital markets, according to La Porta et al. (1997). They argue that the focus on protecting shareholders in countries following English common law (e.g. the United States, the United Kingdom and Canada), explains why
these countries have larger and more developed capital markets than continental Europe.
Doh and Guay (2006) investigate how the structural differences between the United States and Europe affect focus on CSR, and conclude that awareness of, and support for, CSR is more advanced in Europe. This is echoed by Nordea Markets, which calculates the average ESG score per region for North America and Europe based on MSCI data, and finds that the average ESG score of European companies outperformed North American ones in a range of 20% to 50% between 2005 and 2017 (Nordea Markets, 2018).
Common for the two continents is that bidders pay an extensive premium when acquiring companies, and that this premium increases in cross-boarder transactions (Mateev and Andonov, 2017). Historically, target companies involved in M&A transactions in North America have earned a higher abnormal return following the announcement, compared to Europe (Renneboog, 2006). Past research thus suggests that companies acquiring a target in North America are paying a higher price premium in M&A transactions, especially if the acquirer is not domestic, and that the ESG focus in North America is less advanced than in Europe. However, the higher price premium paid in M&A transactions in North America relative to Europe can still be beneficial for acquirers if there is also a positive difference in their post-acquisition performance. In this thesis, I address whether or not this is actually the case for green M&As.
3
Hypothesis
In this section, I review research previously conducted on similar topics related to acquirers’ performance after M&A transactions in North America and Europe (with an emphasis on those involving green companies), and develop my hypotheses accordingly. As discussed in Chapter 2.3, there is no definitive consensus with respects to post-acquisition performance for bidders. Using different performance measures, including accounting and market-based measures, have yielded different results for different researchers (Bettinazzi and Zollo, 2017). With regards to abnormal returns for M&As in general, the majority of studies indicates negative post-acquisition performance for acquirers (though not statistically significant), in both the United States (Andrade et al., 2001) and Europe (Campa and Hernando, 2004).
When focusing on renewable energy and cleantech M&As in detail, the picture changes somewhat. While not nearly as much research has been conducted in this niche, the results mainly point to the opposite of M&As in general; namely that acquirers experience positive post-acquisition performance when acquiring a green company. Eisenbach et al. (2011) examine 337 M&A transactions from 2000 to 2009 in which the target was in the renewable energy sector. Using the event study methodology, they find that acquirers earned positive abnormal returns when acquiring a renewable company. The same result is echoed by Basse-Mama et al. (2013) and Yoo et al. (2013), who both add that the positive post-acquisition effects are larger for acquirers that are also renewable firms (homogeneous), than for non-renewable acquirers (heterogeneous). They argue that the operational synergies and increased market power gained by homogeneous firms thus trump the diversification effect heterogeneous firms can achieve.
Salvi et al. (2018) also research green M&As and their effects on acquirers’ performance, but they use an accounting-based performance measure (ROA). Examining mega deals (larger than
USD 2 billion) from 2000 to 2013, they find that while acquirers in general exhibit a negative post-acquisition change in ROA, this turned positive if the target is classified as a green company. This is despite the fact that, or perhaps the reason for why, acquirers are willing to pay a larger premium to acquire targets with superior CSR and ESG management (Salvi et al., 2018).
Based on the aforementioned studies and literature review, I arrive at my hypotheses. The findings by Eisenbach et al. (2011) regarding acquirers’ positive market performance after buying a green company, suggest investors are on average positive to green transactions. According to Cording et al. (2010), a positive market reaction reflects expectations of improved future returns, which can be expected to be found in future accounting information:
H1: Acquirers in green M&A transactions exhibit a positive change in post-acquisition performance based on accounting-based measures
Further, the transaction premiums paid in M&As in North America are higher than in Europe (Renneboog, 2006). A willingness to consistently pay higher premiums may suggest that acquirers buying a company in North America have higher expectations for, and realizations of, changes in post-acquisition performance, relative to those targeting firms in Europe. This is in turn something I expect remains the case for my sample of green deals as well:
H2: The positive change in post-acquisition performance for acquirers in green M&A deals is larger for acquirers that are buying a target in North America compared to Europe
While M&As in general have been extensively researched, consensus around bidders’ value creation is still lacking. Further, combining this with a focus on green companies opens up a new, fairly unexplored area of research. An environmental focus will likely become more important in the future, and green M&As are therefore a highly relevant topic where additional research is needed.
4
Data and Sample Selection
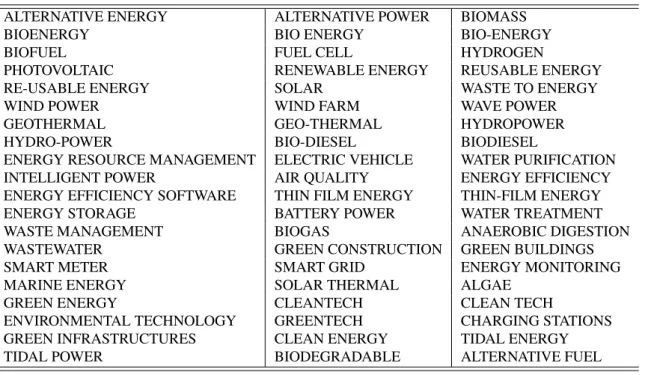
I use the Thomson Reuters SDC Platinum M&A Database to find deals, as this is recognized as a highly reliable source of information regarding M&A transactions (Barnes et al., 2014). Subsequent accounting and financial information for the selected companies are obtained from Thomson Reuters EIKON by matching Datastream Codes. "Green" deals are sourced for by employing a search for 60 keywords in the target’s detailed business description (e.g. "cleantech", "green", "solar" etc. − see Appendix A1), as suggested by Zephyr (2013).
More specifically, I gather data from North America and Europe, as these have historically been the largest markets for green M&A deals and are the focus of my thesis. Thanos and Papadakis (2012) find that studying the acquiring firms is most common in the literature, and therefore argue that more research is needed for target firms. However, as the authors mention; it is difficult to obtain data for target firms. They are often small, private companies without detailed public information, and may even seize to exist in their original state after the acquisition. This is the case with my sample as well, forcing me to investigate the performance of acquiring firms. A similar hinder in obtaining data also leads me to look exclusively at publicly listed acquirers, as information for private ones is difficult to obtain.
I study the change in accounting figures from one year before the acquisition to three years after the deal, in line with Salvi et al. (2018), meaning I am only able to use deals up to 31.12.2016. In order to account for deals completed in different economic environments, I include the period before the financial crisis (from 2000 to 2016 in total). I exclude observations where the buyer is a financial institution (fund or investor), as there are no operational gains in such a case. Another requirement is that the acquirer needs to own more than 50% of the target post acquisition (Salvi et al,. 2018). I am interested in observing the effects on the acquirer’s returns when it controls
the target, and this will ensure that the bidder have control of the target’s operations after the acquisition and thus can be held accountable for its performance. The deal value is required to be a minimum of 1% of the acquirer’s average market capitalization in the four weeks prior to announcement, in order to make sure the deal is of significant importance to the buyer (Hu et al., 2020). To ensure reliable data, the constraint of being publicly listed is, as mentioned, also imposed on acquirers. In addition, deal status is required to be "completed".
1. Markets: North America and Europe 2. Time period: 01.01.2000 to 31.12.2016
3. Acquirer: Publicly listed, not financial institution
4. Acquirer’s ownership after acquisition: Minimum 50.1% 5. Deal status: Completed
6. Deal value: Minimum 1% of acquirer’s market capitalization (average in the four weeks leading up to the announcement)
7. Deal type: All mergers and acquisitions 8. Target status: "Green" (see Appendix A1) 9. Non-missing values for all variables
The larger the deal value is as a percentage of the acquirer’s market capitalization, the fewer deals remain in the sample. After eliminating deals where financial data was lacking, the total number of deals left is 423 for the 1% sample. Corresponding numbers are 311 and 222 for a 5% sample and 10% sample, respectively. As the results that are highlighted later remain consistent across all three samples, I elect to focus on the 1% sample as this is in line with previous research (Hu et al., 2020) and yields as many deals as possible. All samples remain fairly consistently split 60% and 40% between North America and Europe, respectively.
Table 1: Number of deals by geography
1% sample 5% sample 10% sample North America 254 (60%) 187 (60%) 137 (62%)
Europe 169 (40%) 124 (40%) 85 (38%)
5
Methodology
The structure of my research is inspired by Salvi et al. (2018). However, their focus is centered around the difference between green and non-green mega-deals (larger than USD 2 billion), from 2000 to 2013. Rather than having a fixed cut-off point, I relate the deal value to the size of the acquirer, as this will ensure that the deal is material for the buyer (Hu et al., 2020). My contribution to the literature also lies in focusing more specifically on the green deals than Salvi et al. (2018), and on the continent-specifics of North America and Europe. I am also able to extend the time period with an additional three years to 2016, a period in which the focus on green companies, and the money in green-only funds, have become even larger. Salvi and his colleagues use as their performance measure change in ROA from one year before the acquisition to two and three years after. ROA is recognized as one of the most reliable performance measures in M&A literature (e.g. Cording et al., 2010 and King et al., 2004). I keep this as a performance measure, but also added ROE, ROS and Return On Capital Employed (ROCE).
As mentioned in Chapter 2.3 about performance measures, there is no clear consensus about how to best measure post-acquisition performance. According to Aggarwal and Garg (2019), ROE and ROCE should be added as performance measures due to the vital importance of returning value to shareholders and debtholders. They argue that unless an M&A transaction improves the profitability position of the acquirer, it cannot be deemed a success. ROS is among the most common performance measures (Cording et al., 2010), and reflects operational performance and synergies that may arise from an acquisition. Thanos and Papadakis (2010) argue that the insight into M&A performance can be improved by including several accounting-based measures, and for this reason I choose to include ROE, ROCE and ROS, in addition to ROA.
between North America and Europe. In accordance with the suggestion of Thanos and Papadakis (2010) to include several accounting-based measures, I elect to focus on changes in the dependent variables ROA, ROE, ROS and ROCE. These changes will be measured from one year before the transaction (t-1) to three years after (t+3), as suggested by Zollo and Singh (2004). ROA and ROE is calculated as net profit divided by total assets and shareholders’ equity, respectively. ROS is equivalent to operating margin (operating income divided by revenues). ROCE is calculated as EBIT divided by capital employed (total assets − current liabilities). The dependent variables all lag the independent variables, as the latter are calculated at the time of the acquisition.
As mentioned, my hypotheses are that acquirers in green M&A deals exhibit positive post-acquisition performance (H1), and that this performance is better when the target is incorporated in North America (H2). As such, I focus on the independent variable “NA”; a dummy variable that takes the value of 1 if the target is incorporated in North America, and 0 otherwise.
Cording et al. (2010) look at 218 control variables used by researchers in the M&A literature, and find that the ones most often used relate to deal and firm-specific characteristics. I choose four deal characteristic variables and two firm-specific variables, in accordance with Salvi et al. (2018). "SS" is a dummy variable that takes the value of 1 if the target and acquirer are registered in the same "Industry Group", defined as having the same first three digits in their SIC code (Bhojraj et al., 2003), and 0 otherwise. "CC" is a dummy variable which takes the value of 1 if the target and acquirer are incorporated in different countries, and 0 otherwise. The natural logarithm of the deal value ("ln(DV )") is also included, as well as "Cash"; a dummy variable that takes the value of 1 if the deal is paid for purely in cash, and 0 otherwise. The two firm-specific variables are the natural logarithm of the acquirer’s total assets ("ln(TA)"), and the leverage of the acquiring company ("Lev"), defined as total liabilities divided by shareholders’ equity.
Thus, the null hypothesis that the models are correctly specified cannot be rejected (Wooldridge, 2013). As with a lot of financial datasets, my sample also has outliers. Adams et al. (2018) review 3,572 studies published in the top four financial journals from 2008 to 2017, and find that 999 of them mention outliers. Of those, 52% use winsorizing to cope with the effects outliers create. Investigation of the outliers in my dataset reveals that most are likely data entry errors. According to Leone et al. (2017), winsorizing helps to remove the effects of these observations. As such, I opt to follow the majority of scientific research in the field of finance, and winsorize the data to [2.5% , 97.5%].
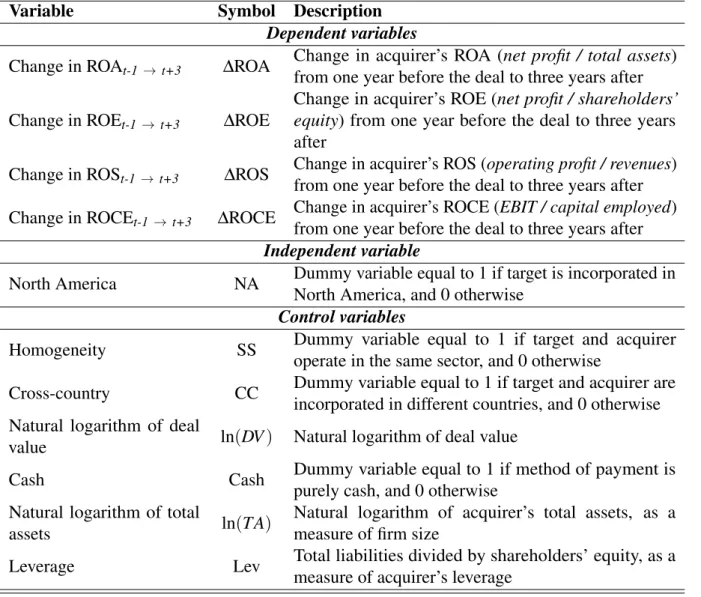
Table 2: Description of variables
Variable Symbol Description
Dependent variables Change in ROAt-1 → t+3 ∆ROA
Change in acquirer’s ROA (net profit / total assets) from one year before the deal to three years after Change in ROEt-1 → t+3 ∆ROE
Change in acquirer’s ROE (net profit / shareholders’ equity) from one year before the deal to three years after
Change in ROSt-1 → t+3 ∆ROS
Change in acquirer’s ROS (operating profit / revenues) from one year before the deal to three years after Change in ROCEt-1 → t+3 ∆ROCE Change in acquirer’s ROCE (EBIT / capital employed)
from one year before the deal to three years after Independent variable
North America NA Dummy variable equal to 1 if target is incorporated in North America, and 0 otherwise
Control variables
Homogeneity SS Dummy variable equal to 1 if target and acquirer operate in the same sector, and 0 otherwise
Cross-country CC Dummy variable equal to 1 if target and acquirer are incorporated in different countries, and 0 otherwise Natural logarithm of deal
value ln(DV ) Natural logarithm of deal value
Cash Cash Dummy variable equal to 1 if method of payment is
purely cash, and 0 otherwise Natural logarithm of total
assets ln(TA)
Natural logarithm of acquirer’s total assets, as a measure of firm size
Leverage Lev Total liabilities divided by shareholders’ equity, as a measure of acquirer’s leverage
6
Results
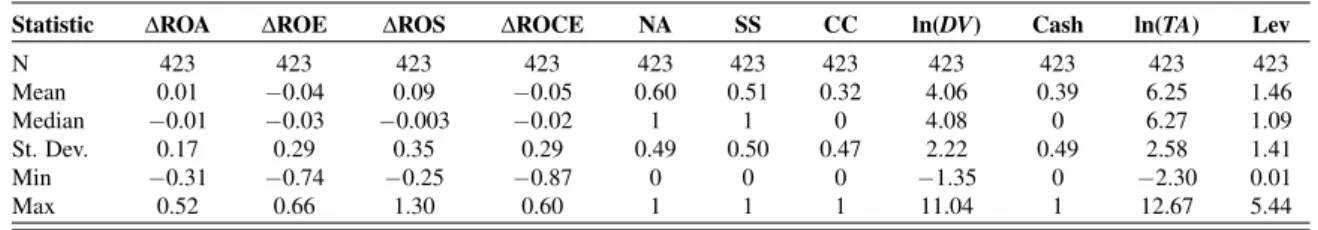
Table 3 depicts descriptive statistics for the utilized variables. 60% of transactions occur with the target incorporated in North America, while 51% are between companies operating in the same sector. 32% of deals are cross-boarder transactions, and 39% is paid purely in cash. Averages of the dependent variables are positive for ∆ROA (1 percentage point) and ∆ROS (9 percentage points), and negative for ∆ROE (−4 percentage points) and ∆ROCE (−5 percentage points).
Table 3: Descriptive statistics in aggregate
Statistic ∆ROA ∆ROE ∆ROS ∆ROCE NA SS CC ln(DV) Cash ln(TA) Lev N 423 423 423 423 423 423 423 423 423 423 423 Mean 0.01 −0.04 0.09 −0.05 0.60 0.51 0.32 4.06 0.39 6.25 1.46 Median −0.01 −0.03 −0.003 −0.02 1 1 0 4.08 0 6.27 1.09 St. Dev. 0.17 0.29 0.35 0.29 0.49 0.50 0.47 2.22 0.49 2.58 1.41 Min −0.31 −0.74 −0.25 −0.87 0 0 0 −1.35 0 −2.30 0.01 Max 0.52 0.66 1.30 0.60 1 1 1 11.04 1 12.67 5.44
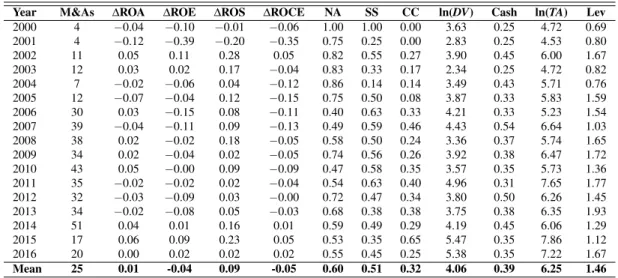
Table 4 shows the averages of each variable by year. The average number of deals each year is 25 and the trend is that the number of green deals that fit the criteria from Section 4 has increased in recent years. Interestingly, all average returns are positive for deals that occurred in 2014 to 2016. This is the period I am able to extent to the study conducted by Salvi et al. (2018), and also a period when inflows to ESG funds have increased substantially (Morningstar, 2019). Another interesting observation is that yearly averages of ∆ROE and ∆ROCE follow an almost identical pattern (with the exception of 2003), and that averages of ∆ROS is positive every year from 2002. Despite conflicting results, my initial findings do, to some extent, appear to contradict the conclusions of the literature that M&A transactions destroy value for acquirers (e.g. King et al., 2004, and Zollo and Meier, 2008). In fact, my results appear to be more in line with those of Salvi et al. (2018), who find that while M&As in general may destroy value for bidders, the green sub-sample outperformed the non-green one with respect to ∆ROA. However, a more detailed analysis is needed before any conclusions can be drawn.
Year M&As ∆ROA ∆ROE ∆ROS ∆ROCE NA SS CC ln(DV) Cash ln(TA) Lev 2000 4 −0.04 −0.10 −0.01 −0.06 1.00 1.00 0.00 3.63 0.25 4.72 0.69 2001 4 −0.12 −0.39 −0.20 −0.35 0.75 0.25 0.00 2.83 0.25 4.53 0.80 2002 11 0.05 0.11 0.28 0.05 0.82 0.55 0.27 3.90 0.45 6.00 1.67 2003 12 0.03 0.02 0.17 −0.04 0.83 0.33 0.17 2.34 0.25 4.72 0.82 2004 7 −0.02 −0.06 0.04 −0.12 0.86 0.14 0.14 3.49 0.43 5.71 0.76 2005 12 −0.07 −0.04 0.12 −0.15 0.75 0.50 0.08 3.87 0.33 5.83 1.59 2006 30 0.03 −0.15 0.08 −0.11 0.40 0.63 0.33 4.21 0.33 5.23 1.54 2007 39 −0.04 −0.11 0.09 −0.13 0.49 0.59 0.46 4.43 0.54 6.64 1.03 2008 38 0.02 −0.02 0.18 −0.05 0.58 0.50 0.24 3.36 0.37 5.74 1.65 2009 34 0.02 −0.04 0.02 −0.05 0.74 0.56 0.26 3.92 0.38 6.47 1.72 2010 43 0.05 −0.00 0.09 −0.09 0.47 0.58 0.35 3.57 0.35 5.73 1.36 2011 35 −0.02 −0.02 0.02 −0.04 0.54 0.63 0.40 4.96 0.31 7.65 1.77 2012 32 −0.03 −0.09 0.03 −0.00 0.72 0.47 0.34 3.80 0.50 6.26 1.45 2013 34 −0.02 −0.08 0.05 −0.03 0.68 0.38 0.38 3.75 0.38 6.35 1.93 2014 51 0.04 0.01 0.16 0.01 0.59 0.49 0.29 4.19 0.45 6.06 1.29 2015 17 0.06 0.09 0.23 0.05 0.53 0.35 0.65 5.47 0.35 7.86 1.12 2016 20 0.00 0.02 0.02 0.02 0.55 0.45 0.25 5.38 0.35 7.22 1.67 Mean 25 0.01 -0.04 0.09 -0.05 0.60 0.51 0.32 4.06 0.39 6.25 1.46
Table 5 shows the correlation matrix of all variables utilized. Vatcheva et al. (2016) argue that in the literature, the most common cut-off point for multicollinearity is 0.8, a threshold which all the variables lie within. However, ln(DV ) and ln(TA) are closely correlated at 0.78. Salvi et al. (2018) also find that ln(DV ) and ln(TA) are among the mostly correlated variables.
Table 5: Correlation matrix
∆ROA ∆ROE ∆ROS ∆ROCE NA SS CC ln(DV) Cash ln(TA) Lev ∆ROA 1 ∆ROE 0.63 1 ∆ROS 0.38 0.31 1 ∆ROCE 0.49 0.63 0.27 1 NA 0.07 0.08 0.02 0.05 1 SS −0.10 −0.05 −0.06 0.04 0.05 1 CC 0.01 0.05 0.10 0.05 −0.30 −0.02 1 ln(DV) −0.13 0.004 −0.23 0.02 −0.08 0.18 0.13 1 Cash −0.18 −0.08 −0.15 −0.08 −0.09 0.10 0.24 0.08 1 ln(TA) −0.25 −0.04 −0.30 0.05 −0.18 0.15 0.17 0.78 0.19 1 Lev −0.04 0.05 −0.04 0.11 −0.09 0.08 −0.04 0.22 −0.06 0.33 1
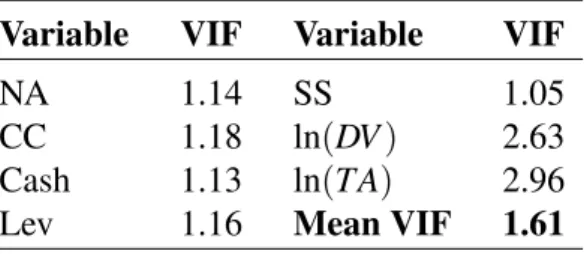
Subsequently, I conduct a Variance Inflation Factor (VIF) test to make sure that my dataset is not affected by multicollinearity (shown in Table 6). All values from the VIF test are less than 3, and thus comfortably within the thresholds suggested by Vatcheva et al. (2016) of 5 and 10. On the basis of this, I conclude that significant multicollinearity is not present in my sample.
Results from the sample show statistically significant changes in average returns for ROE, ROS and ROCE at a 1% level (see Table 7), while the change in ROA is not statistically significant.
Table 6: Variance Inflation Factor (VIF) test
Variable VIF Variable VIF
NA 1.14 SS 1.05
CC 1.18 ln(DV ) 2.63
Cash 1.13 ln(TA) 2.96
Lev 1.16 Mean VIF 1.61
As mentioned earlier, the results are conflicting; the change in ROS is positive, while the changes in ROE and ROCE are negative. This indicates that acquirers in my sample which bought a green company may have been able to improve their operational margins (ROS), but this has not trickled down to the debt and equity holders, which have ended up with negative changes in returns (ROE and ROCE). This is despite the fact that researchers have found that environmentally-focused firms are able to reduce their cost of capital (e.g. Sharfman and Fernando, 2008, and Ng et al., 2015), suggesting that the acquirers in my sample might have paid too high a premium in the transactions; something Salvi et al. (2018) argue is common in green M&A deals.
Further, the average change in ROA is not statistically different from zero. This may appear to contradict the positive change in ROA found by Salvi et al. (2018), but they compared green mega-deals with non-green mega-deals. The latter has been well documented to destroy value for bidders, according to Hu et al. (2020). As such, it is plausible that green M&As perform better than non-green deals (Salvi et al., 2018) − despite not creating value for bidders in the first place. My sample indicates that this is the case, and as such I cannot confirm my first hypothesis that acquirers buying green firms exhibit positive changes in accounting-based performance measures (H1). This conclusion is based on a Student t test conducted on the changes in returns. These results, as wells as those for the two sub-samples, are robust provided that the data is not extremely non-normal, or the sample size is large (Keller, 2012). With a sample of 423 deals, and from the histograms depicted in Appendix A2, I would argue this is the case here.
Sample ∆ROA ∆ROE ∆ROS ∆ROCE Whole sample 0.007 (0.904) −0.039∗∗∗(-2.716) 0.093∗∗∗(5.448) −0.050∗∗∗(-3.557) North America (1) 0.017 (1.462) −0.019 (-0.986) 0.098∗∗∗(4.313) −0.039∗∗(-2.012)
Europe (2) −0.001 (-0.640) −0.068∗∗∗(-3.392) 0.087∗∗∗(3.319) −0.067∗∗∗(-3.337)
Difference (1 - 2) 0.018 (1.506) 0.049∗(1.735) 0.011 (0.326) 0.028 (1.020) Note ∗p<0.1;∗∗p<0.05;∗∗∗p<0.01 (two-tailed test)
In order to look more closely at the differences between deals completed in North America and Europe, I divide my data into two sub-samples; one for each region. The results in Table 7 show that returns from sub-sample 1 (North America) outperform those from sub-sample 2 (Europe) in all regards. However, none of the differences are statistically significant at a 5% level.
To address the fact that the normality requirement may be in doubt in this case, I also conduct a non-parametric test to compare the two samples; the Wilcoxon Signed Rank Sum Test, as suggested by Keller (2012). This test yields p values well above any reasonable cut-off point, and thus the null hypothesis of equal means between North America and Europe cannot be rejected.
Basic tests are not able to provide statistically significant evidence of any differences between the two continents. To investigate further if there are any differences between the changes in post-acquisition performance for acquirers buying green companies in North America and Europe, I conduct a cross-sectional OLS regression analysis (see Table 8). According to Thanos and Papadakis (2010), most of the existing research suggests to compare returns before the acquisition with returns after, where the changes in the dependent variables can be caused by changes in both the numerator and the denominator. My analysis is conducted this way, in accordance with Salvi et al. (2018). Breusch-Pagan tests confirm the presence of heteroskedasticity in my dataset, and thus White-Huber heteroskedasticity-robust standard errors and heteroskedasticity-robust Wald F statistics are presented in the regression results (Wooldridge, 2013).
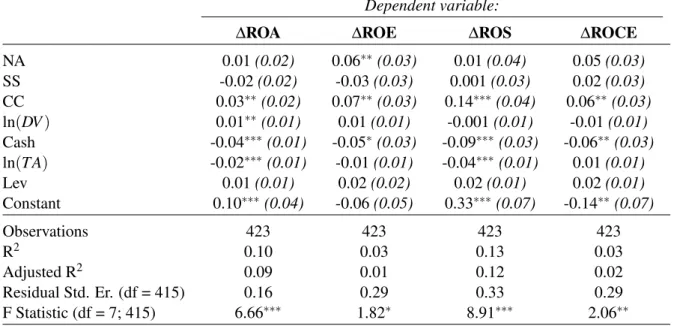
Table 8: Regression results
Dependent variable:
∆ROA ∆ROE ∆ROS ∆ROCE
NA 0.01 (0.02) 0.06∗∗(0.03) 0.01 (0.04) 0.05 (0.03) SS -0.02 (0.02) -0.03 (0.03) 0.001 (0.03) 0.02 (0.03) CC 0.03∗∗(0.02) 0.07∗∗(0.03) 0.14∗∗∗(0.04) 0.06∗∗(0.03) ln(DV ) 0.01∗∗(0.01) 0.01 (0.01) -0.001 (0.01) -0.01 (0.01) Cash -0.04∗∗∗(0.01) -0.05∗(0.03) -0.09∗∗∗(0.03) -0.06∗∗(0.03) ln(TA) -0.02∗∗∗(0.01) -0.01 (0.01) -0.04∗∗∗(0.01) 0.01 (0.01) Lev 0.01 (0.01) 0.02 (0.02) 0.02 (0.01) 0.02 (0.01) Constant 0.10∗∗∗(0.04) -0.06 (0.05) 0.33∗∗∗(0.07) -0.14∗∗(0.07) Observations 423 423 423 423 R2 0.10 0.03 0.13 0.03 Adjusted R2 0.09 0.01 0.12 0.02 Residual Std. Er. (df = 415) 0.16 0.29 0.33 0.29 F Statistic (df = 7; 415) 6.66∗∗∗ 1.82∗ 8.91∗∗∗ 2.06∗∗ Notea: ∗p<0.1;∗∗p<0.05;∗∗∗p<0.01
Noteb: Standard errors and F statistics are robust to heteroskedasticity
As Table 8 shows, NA is associated with a positive change in returns for all regressions. However, with the exception of the regression for ∆ROE, this is not statistically significant for any of the dependent variables. In addition, the regression for ∆ROE has a low F statistic of 1.82, which is only significant at a 10% level. This means that at a significance level of 5%, I cannot reject the null hypothesis that all variables are jointly insignificant (Wooldridge, 2013). The adjusted R-squares are also very low for ∆ROE and ∆ROCE, but in line with Salvi et al. (2018) for ∆ROA and ∆ROS. However, Shalizi (2015) argues against using R-squared as it "does not measure goodness of fit" and "can be arbitrarily low when the model is completely correct".
Measured by the change in returns from one year before the transaction to three years after, my sample does not indicate that there is a statistically significant difference in performance for acquirers that are buying green firms in North America and Europe, in line with the previous statistical tests. The same can be said for acquirers operating in the same sector as their targets, as the variable SS is also not significant for any regressions. This contradicts the results of
that homogeneous firms have better post-acquisition performance than heterogeneous firms when buying renewable companies. As such, my sample indicates that the positive results investors expect in homogeneous deals relative to heterogeneous deals, are not manifesting themselves in realized accounting returns. This can be explained by my requirement that the deal value needs to be a minimum of 1% of the acquirer’s market capitalization. This ensures that the deal is material to the buyer (Hu et al., 2020), thus effectively removing any attempts of "greenwashing"; something Basse-Mama et al. (2013) and Yoo et al. (2013) argue is penalized by the market and may explain why they find that heterogeneous firms underperform homogeneous ones in renewable M&As without such a requirement relating deal value to the acquirer’s size.
As mentioned in Chapter 2.4, premiums paid in cross-boarder deals are higher than in domestic deals (Mateev and Andonov, 2017). Based on the transactions in my sample, acquirers are getting value for their money as the variable CC is associated with a positive change in returns that is significant at a 5% level for all the dependent variables. Acquirers buying green targets outside their home-country have, all else equal, on average realized 3 percentage points, 7 percentage points , 14 percentage points and 6 percentage points higher changes in ∆ROA, ∆ROE, ∆ROS and ∆ROCE, respectively, relative to domestic transactions.
The same cannot be said for acquirers who pay purely in cash. My sample indicates that paying solely in cash is associated with negative changes in returns at various levels of statistical significance. Acquirers paying purely in cash in green M&As have, all else equal, on average realized 4 percentage points, 5 percentage points , 9 percentage points and 6 percentage points lower changes in ∆ROA, ∆ROE, ∆ROS and ∆ROCE, respectively, relative to those using other payment methods. This contradicts the findings of Heron and Lie (2002), who conclude that paying solely in cash in M&A deals does not affect the stock returns for acquirers, albeit using a
sample of transactions from 1985 to 1997, which is not really comparable with my data set.
The regressions in Table 8 assume that the marginal effects of the dummy variables are equal for deals in North America and Europe. The regressions also assume that the effect of the target being incorporated in North America is equal for all states of the other dummy variables. However, in order to investigate whether or not this is actually the case and to gain a deeper understanding of how the independent variable NA interacts with the dummy variables SS and CC, I also conduct cross-sectional OLS analyses using interaction variables. As with the previous regressions in Table 8, I run a VIF test and draw a correlation matrix to check for multicollinearity (see Appendix A3). The results remain the same (no multicollinearity), as all VIF values remain comfortably within the suggested limits of 5 and 10 (Vatcheva et al., 2016).
"NA*SS" is an interaction variable comprised of NA and SS. NA*SS is interpreted as a dummy variables that takes the value of 1 if the target is incorporated in North America and is registered in the same Industry Group as its acquirer, and 0 otherwise. Similarly, "NA*CC" is an interaction variable comprised of NA and CC. NA*CC is interpreted as a dummy variables that takes the value of 1 if the target is incorporated in North America and in a different country than its acquirer, and 0 otherwise. Table 9 and Table 10 depict the results of separately including the interaction variables NA*SS and NA*CC, respectively.
Including the interaction between NA and SS (see Table 9) results in the variable NA now being statistically significant at a 5% level for ∆ROA, and at a 10% level for ∆ROE and ∆ROCE. The variable SS is still not statistically significant for any of the regressions. CC remains positive and statistically significant at a 5% level for all regressions with the coefficients virtually unchanged. It should be noted that the regression for ∆ROE now has an F statistic that is not significant at a 10% level, and thus I am unable to rule out that all variables are jointly statistically insignificant.
Dependent variable:
∆ROA ∆ROE ∆ROS ∆ROCE
NA 0.05∗∗(0.02) 0.08∗(0.04) 0.01 (0.05) 0.08∗(0.04) SS 0.02 (0.02) -0.01 (0.04) 0.01 (0.05) 0.06 (0.04) CC 0.04∗∗(0.02) 0.07∗∗(0.03) 0.14∗∗∗(0.04) 0.06∗∗(0.03) NA*SS -0.07∗∗(0.03) -0.03 (0.06) -0.01 (0.06) -0.06 (0.06) ln(DV) 0.01∗∗(0.01) 0.01 (0.01) -0.001 (0.01) -0.01 (0.01) Cash -0.04∗∗∗(0.01) -0.05∗(0.03) -0.09∗∗∗(0.03) -0.06∗∗(0.02) ln(TA) -0.02∗∗∗(0.01) -0.01 (0.01) -0.04∗∗∗(0.01) 0.01 (0.01) Lev 0.004 (0.01) 0.02 (0.02) 0.02 (0.01) 0.02 (0.01) Constant 0.08∗∗(0.03) -0.07 (0.05) 0.33∗∗∗(0.07) -0.15∗∗(0.07) Observations 423 423 423 423 R2 0.11 0.03 0.13 0.04 Adjusted R2 0.09 0.01 0.11 0.02 Residual Std. Er. (df = 414) 0.16 0.29 0.33 0.29 F Statistic (df = 8; 414) 6.52∗∗∗ 1.63 7.78∗∗∗ 1.96∗∗ Notea: ∗p<0.1;∗∗p<0.05;∗∗∗p<0.01
Noteb: Standard errors and F statistics are robust to heteroskedasticity
The interaction variable NA*SS is negative for all regressions, and only significant in the regression for ∆ROA. However, Brambor et al. (2006) show how it is perfectly possible for the marginal effects of an independent variable to be significant for relevant values of the interaction variables, even though the coefficients on the interaction terms are insignificant. Such values for the interaction variables can be found using the Johnson-Neyman procedure (D’Alonzo, 2004).
For NA*SS in the regressions for ∆ROA and ∆ROCE, the Johnson-Neyman procedure yields intervals that contain the value 0, but not 1, for a p value of 5%. This means that the independent variable NA is significant at a 5% level for the regressions for ∆ROA and ∆ROCE when the interaction variables equal 0, but not when they equal 1. So when the target and the acquirer are not in the same sector (SS = 0), NA is significant at a 5% level and associated with effects of 0.05 and 0.08 for ∆ROA and ∆ROCE, respectively. SS equals 0 for 206 deals in my sample, equalling 49% of the total. This leaves a large number of observations in which heterogeneous acquirers have realized on average a 5 percentage point and 8 percentage point higher change in ROA and
ROCE, respectively, when buying a green company in North America relative to Europe, all else equal. Based on these observations, the higher premiums paid in deals in North America relative to Europe (Renneboog, 2006) are paying off for acquirers in heterogeneous, green M&As.
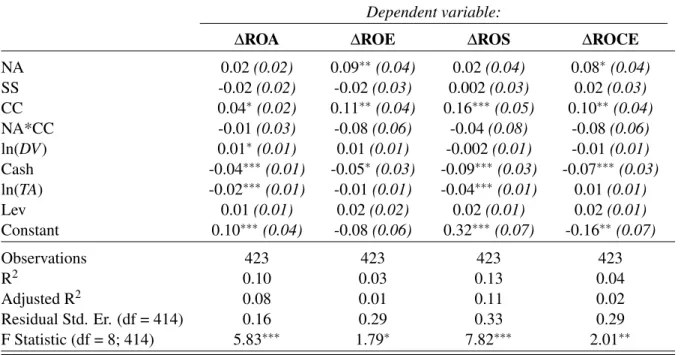
Subsequently, I complete the same exercise with NA*CC (see Table 10). NA remains insignificant for ∆ROS and this is now also the case for ∆ROA, suggesting that the positive cross-boarder effects found by Mateev and Andonov (2017) trump any continental-specific differences between North America and Europe. Further, the F statistic for ∆ROE is still low, and only significant at a 10% level. Hence, I cannot place too much emphasis on the results from this regression.
Table 10: Regression results with NA*CC
Dependent variable:
∆ROA ∆ROE ∆ROS ∆ROCE
NA 0.02 (0.02) 0.09∗∗(0.04) 0.02 (0.04) 0.08∗(0.04) SS -0.02 (0.02) -0.02 (0.03) 0.002 (0.03) 0.02 (0.03) CC 0.04∗(0.02) 0.11∗∗(0.04) 0.16∗∗∗(0.05) 0.10∗∗(0.04) NA*CC -0.01 (0.03) -0.08 (0.06) -0.04 (0.08) -0.08 (0.06) ln(DV) 0.01∗(0.01) 0.01 (0.01) -0.002 (0.01) -0.01 (0.01) Cash -0.04∗∗∗(0.01) -0.05∗(0.03) -0.09∗∗∗(0.03) -0.07∗∗∗(0.03) ln(TA) -0.02∗∗∗(0.01) -0.01 (0.01) -0.04∗∗∗(0.01) 0.01 (0.01) Lev 0.01 (0.01) 0.02 (0.02) 0.02 (0.01) 0.02 (0.01) Constant 0.10∗∗∗(0.04) -0.08 (0.06) 0.32∗∗∗(0.07) -0.16∗∗(0.07) Observations 423 423 423 423 R2 0.10 0.03 0.13 0.04 Adjusted R2 0.08 0.01 0.11 0.02 Residual Std. Er. (df = 414) 0.16 0.29 0.33 0.29 F Statistic (df = 8; 414) 5.83∗∗∗ 1.79∗ 7.82∗∗∗ 2.01∗∗ Notea: ∗p<0.1;∗∗p<0.05;∗∗∗p<0.01
Noteb: Standard errors and F statistics are robust to heteroskedasticity
When the cross-boarder effects are removed (CC = 0), NA reflects changes in returns for North American acquirers relative to European ones, and is significant at a 5% level for ∆ROCE, confirmed by the Johnson-Neyman procedure. There are 286 such observations in my sample, corresponding to 68% of the total. In other words, when the target and the acquirer are incorporated in the same country, acquirers of green firms in North America have on average
result for ∆ROCE remains consistent with Table 9, and can be explained by the fact that North American companies have lower average ESG scores that European ones (Nordea Markets, 2018). North American firms will in turn have more to gain from acquiring a green company, provided that acquiring a green company yields positive results in the first place, which, among others, Eisenbach et al. (2011) and Yoo et al. (2013) find to be the case.
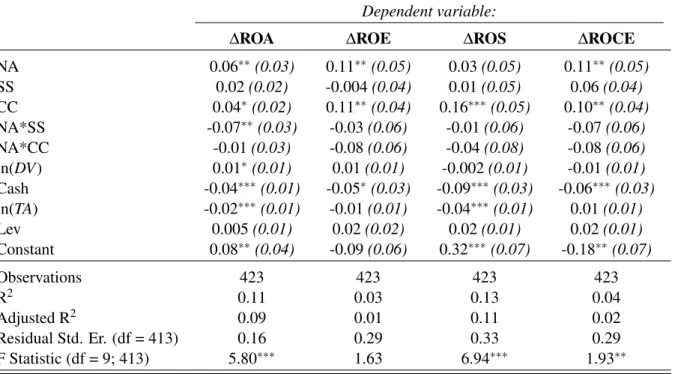
Further, I conduct a cross-sectional OLS analysis that includes both the interaction variables NA*SS and NA*CC (see Table 11). This results in the variable NA being statistically significant at a 5% level for ∆ROA, ∆ROE and ∆ROCE. The variable SS is still not statistically significant for any of the regressions, while CC remains positive and statistically significant at various levels for all regressions. It should again be noted that the regression for ∆ROE now has an F statistic that is not significant at a 10% level, and thus I cannot rule out that all variables are jointly statistically insignificant for this particular regression.
Table 11: Regression results with NA*SS and NA*CC
Dependent variable:
∆ROA ∆ROE ∆ROS ∆ROCE
NA 0.06∗∗(0.03) 0.11∗∗(0.05) 0.03 (0.05) 0.11∗∗(0.05) SS 0.02 (0.02) -0.004 (0.04) 0.01 (0.05) 0.06 (0.04) CC 0.04∗(0.02) 0.11∗∗(0.04) 0.16∗∗∗(0.05) 0.10∗∗(0.04) NA*SS -0.07∗∗(0.03) -0.03 (0.06) -0.01 (0.06) -0.07 (0.06) NA*CC -0.01 (0.03) -0.08 (0.06) -0.04 (0.08) -0.08 (0.06) ln(DV) 0.01∗(0.01) 0.01 (0.01) -0.002 (0.01) -0.01 (0.01) Cash -0.04∗∗∗(0.01) -0.05∗(0.03) -0.09∗∗∗(0.03) -0.06∗∗∗(0.03) ln(TA) -0.02∗∗∗(0.01) -0.01 (0.01) -0.04∗∗∗(0.01) 0.01 (0.01) Lev 0.005 (0.01) 0.02 (0.02) 0.02 (0.01) 0.02 (0.01) Constant 0.08∗∗(0.04) -0.09 (0.06) 0.32∗∗∗(0.07) -0.18∗∗(0.07) Observations 423 423 423 423 R2 0.11 0.03 0.13 0.04 Adjusted R2 0.09 0.01 0.11 0.02 Residual Std. Er. (df = 413) 0.16 0.29 0.33 0.29 F Statistic (df = 9; 413) 5.80∗∗∗ 1.63 6.94∗∗∗ 1.93∗∗ Notea: ∗p<0.1;∗∗p<0.05;∗∗∗p<0.01
All the interaction variables are negative, and none are statistically significant at any level, with the exception of NA*SS in the regression for ∆ROA. For the regressions for ∆ROA and ∆ROCE, the Johnson-Neyman procedure yields intervals that contain the value 0, but not 1, for a p value of 5%. More precisely, the coefficients on NA are positive and statistically significant at a 5% level for ∆ROA and ∆ROCE, but this only applies in the situation when the transaction is between companies in different industries (SS = 0) that are incorporated in the same country (CC = 0). My sample has 137 such observations (32% of the total sample). In the aforementioned scenario, acquirers buying a green target incorporated in North America have, all else equal, on average realized a 6 percentage point and 11 percentage point higher change in ROA and ROCE, respectively, relative to Europe. This is consistent with the results from Table 9 and Table 10.
Lastly, I conduct a cross-sectional OLS analysis which includes a triple interaction term for "NA*SS*CC" (see Table 12). NA*SS*CC is a dummy variable that takes the value of 1 if the target is incorporated in North America and is registered in the same Industry Group as its acquirer and incorporated in a different country than its acquirer, and 0 otherwise. Including NA*SS*CC hardly effects the coefficients, standard errors or the interpretation of the regression results − with the obvious exception that the variable NA appears to narrowly drop from a 5% significance level to a 10% significance level for ∆ROA, ∆ROE and ∆ROCE. However, the Johnson-Neyman procedure still confirms that when SS = 0 and CC = 0, the variable NA is significant at a 5% level for ∆ROA and ∆ROCE with coefficients of 0.05 and 0.10, respectively.
This means that yet another OLS analysis indicates positive effects for heterogeneous companies acquiring green firms domestically in North America relative to Europe, underpinning the findings from the previous analyses. In this case, buyers in green M&A transactions have, all else equal, on average realized a 5 percentage point and 10 percentage point higher change in ROA and ROCE, respectively, when acquiring targets in North America relative to Europe. The
Dependent variable:
∆ROA ∆ROE ∆ROS ∆ROCE
NA 0.05∗(0.03) 0.11∗(0.05) 0.03 (0.05) 0.10∗(0.06) SS 0.02 (0.02) -0.004 (0.04) 0.01 (0.05) 0.06 (0.04) CC 0.04∗(0.02) 0.11∗∗(0.04) 0.16∗∗∗(0.05) 0.10∗∗(0.04) NA*SS -0.07∗∗(0.03) -0.03 (0.06) -0.02 (0.07) -0.04 (0.06) NA*CC -0.01 (0.04) -0.07 (0.08) -0.07 (0.09) -0.02 (0.08) NA*SS*CC -0.001 (0.05) -0.03 (0.08) 0.06 (0.11) -0.12 (0.09) ln(DV) 0.01∗(0.01) 0.01 (0.01) -0.002 (0.01) -0.01 (0.01) Cash -0.04∗∗∗(0.01) -0.05∗(0.03) -0.09∗∗∗(0.03) -0.06∗∗(0.03) ln(TA) -0.02∗∗∗(0.01) -0.01 (0.01) -0.04∗∗∗(0.01) 0.01 (0.01) Lev 0.004 (0.01) 0.02 (0.02) 0.02 (0.01) 0.02 (0.01) Constant 0.08∗∗(0.04) -0.09 (0.06) 0.32∗∗∗(0.07) -0.18∗∗(0.07) Observations 423 423 423 423 R2 0.11 0.03 0.13 0.04 Adjusted R2 0.09 0.01 0.11 0.02 Residual Std. Er. (df = 412) 0.16 0.29 0.33 0.29 F Statistic (df = 10; 412) 5.21∗∗∗ 1.47 6.27∗∗∗ 1.91∗∗ Notea: ∗p<0.1;∗∗p<0.05;∗∗∗p<0.01
Noteb: Standard errors and F statistics are robust to heteroskedasticity
F statistic for ∆ROE remains insignificant and too low to ascribe this particular regression any significant meaning, and NA is still not significant for ∆ROS.
Basse-Mama et al. (2013) and Yoo et al. (2013) find that homogeneous firms perform better than heterogeneous firms in green M&A transactions. They argue that this is because the operational synergies homogeneous firms can gain outweigh the diversification effects heterogeneous firms can achieve. As discussed in Chapter 2.4, the focus on CSR and ESG is more advanced in Europe compared to North America (Doh and Guay, 2006). This means European firms on average are more focused on ESG, and would likely have more operational synergies to offer than a green target in North America. This in turn may explain why my sample indicates no statistically significant effects for targets incorporated in North America in the regressions for ∆ROS.
The positive effects of acquiring a green company in a different country (CC = 1) remain throughout all the OLS analyses, which is to be expected as acquirers are willing to consistently
pay higher premiums in cross-boarder transactions (Mateev and Andonov, 2017). The positive effects of cross-boarder transactions appear to trump any differences between North America and Europe, as NA remains insignificant when CC equals 1. When excluding this effect (CC = 0), my sample indicates that heterogeneous (SS = 0) buyers acquiring green targets have, all else equal, on average realized a 5 percentage point and 10 percentage point higher change in ROA and ROCE, respectively, in North America relative to Europe (see Table 12).
The focus for heterogeneous firms is on diversification, something North American firms with lower ESG scores (Nordea Markets, 2018) can achieve more of. As North American companies underperform European ones with respect to average ESG scores, this also means North American firms have the most potential for improvement, starting from a lower relative level. Once the dominating cross-boarder effect is excluded, it follows that the average non-green North American company has more to gain in terms of buying a green company domestically, than a non-green European company would. My sample indicates that this is the case, which is corroborated by previous research suggesting that buying a green company results in improved performance in the first place (e.g. Eisenbach et al., 2011, and Yoo et al., 2013).
Summarized, my sample indicates that buying a green company in North America is more beneficial than in Europe, all else equal, but this is only statistically significant at a 5% level for ∆ROA and ∆ROCE when excluding the effects of the target being registered in the same Industry Group as its acquirer, and incorporated in a different country. Further, I find contradicting evidence when comparing these results with those from ∆ROE and ∆ROS. There is no significant effect of NA in the regressions for ∆ROS, suggesting that the target’s geographical location does not affect changes in operational margins. In addition, the F statistics for ∆ROE are too low to be assigned any conclusions. As such, I cannot confirm my second hypothesis that acquirers in green M&As perform better when buying targets in North America relative to Europe (H2).
7
Conclusion
Throughout this thesis, I examine the effects on acquirers’ post-acquisition performance when buying a green company. My first hypothesis is that acquirers buying green firms will exhibit a positive change in performance based on accounting-based measures (H1), in line with the findings of previous research. Eisenbach et al., 2011, Basse-Mama et al., 2013, and Yoo et al., 2013, study the effects of buying green companies using the event-study methodology, and conclude that acquiring environmentally-focused firms yields positive results.
However, my sample indicates mixed findings. The average change in ROS from one year before the acquisition to three years after is positive (0.093) and statistically significant at a 1% level. According to Cording et al. (2010), ROS reflects operational performance and synergies that may arise from an acquisition. The M&A deals I examine thus indicate that acquiring a green company improves operating margins for the bidders. But the average changes in ROE and ROCE are negative (−0.039 and −0.050, respectively), and statistically significant at a 1% level. This in turn suggests that whatever operational improvements acquirers may be able to accomplish are not benefiting shareholders and debtholders. This is surprising, as several researchers find a clear relationship between an increased environmental focus and a lower cost of capital (e.g. Sharfman and Fernando, 2008, and Ng and Rezaee, 2015), and can in turn suggest that acquirers are overpaying for the green targets in my sample. Aggarwal and Garg (2019) argue that unless a transaction leads to an improved profitability position for the firm, it cannot be deemed a success. As such, I cannot confirm my first hypothesis that acquirers buying green companies exhibit a positive change in performance based on accounting-based measures.
I also highlight the differences between the change in acquirers’ returns based on if they purchase a company in North America or Europe, under the second hypothesis that the positive change
in performance will be larger for bidders that are buying a target in North America relative to Europe (H2). Basic statistical tests do not allow me to reject any null hypotheses of equal means between the two continents. However, using cross-sectional OLS analyses with interaction variables yields some significant results. The coefficients for NA in the regressions ∆ROA and ∆ROCE are positive (0.05 and 0.10, respectively − see Table 12). These findings are statistically significant at a 5% level when the dummy variables SS and CC equal 0. When the same dummy variables equal 1, the results are still positive, but not significant at a 5% level.
It should be noted that the F statistics for ∆ROE are not significant, so the results from these regressions must not be overemphasized. Further, the variable NA is not significant in the regressions for ∆ROS, and only significant for ∆ROA and ∆ROCE in certain situations. As such, I cannot confirm my second hypothesis that the change in performance will be more positive for acquirers buying targets in North America rather than Europe. However, my findings do suggest that even though acquirers are forced to pay higher transaction premiums in North America compared to Europe (Renneboog, 2006), they are mostly getting value for their money when they buy green companies across the pond − it is just not statistically significant in all instances.
Assessing my study reveals certain weaknesses that may have impacted the results. First, I base my performance measures on accounting information. Financial ratios calculated from accounting numbers are affected by several factors, not all of which are related to the acquisition I wish to measure. In addition, accounting figures can be manipulate by management (Chakravarthy, 1986). Second, I only use one time-period (change from one year before the acquisition to three years after). This is the most common practice in the literature (Cording et al., 2010) and in line with Salvi et al. (2018). However, Morosini et al. (1998) argue that a time frame of two years should be utilized1, as this is the most critical period after a merger and is
Third, there may be issues related to the methodology and treatment of data. A potential problem is that of omitted variable bias (Wooldridge, 2013). This occurs when a relevant, explanatory variable is omitted from the regression model. While I use the same variables as Salvi et al. (2018) and conduct successful Ramsey RESET tests, there are no guarantees that I have not left out any relevant variables. Further, I winsorize the data to [2.5% , 97.5%], in line with what is common practice (Adams et al., 2018). However, Heckman (1979) argues that trimming and dropping variables can introduce sample selection problems and biased coefficient estimates.
For further research, it would be interesting to look at a similar topic, but for the performance of target companies. However, this would in many cases require access to private data which is more difficult to get a hold of. It would also be useful to conduct a similar analysis that includes deals in Asia, as an increasing number of green M&As are taking place there. Further, my methodology could be improved, or changed, to include more appropriate variables in an attempt to better explain the relationship between acquiring green companies and post-acquisition performance. Lastly, while the financial synergies involved in green M&A transactions have been researched in detail (e.g. Sharfman and Fernando, 2008, Ghoul et al., 2011, and Ng and Rezaee, 2015), operational synergies in green M&A deals have, as far as I know, not been investigated explicitly. This is an interesting topic to look at in more detail; one which I leave for future research.
Summarized, I do not find statistically significant evidence that acquiring green firms create value for bidders measured by the change in accounting ratios from one year before the deal to three years after. Further, my sample indicates that acquiring a green target in North America is more beneficial than Europe, but this is only statistically significant in certain scenarios and not definitive. Hence, it appears value creation from M&As is more complex than simply buying a green firm in North America − and instead comes down to deal and firm-specific characteristics.
References
Adams, John, Hayunga, Darren, Mansi, Sattar, Reed, David, and Verardi, Vincenzo. 2018. “Identifying and Treating Outliers in Finance.” Financial Management, 48(2): 345-384.
Aggarwal, Puja, and Garg, Sonia. 2019. "Impact of Mergers and Acquisitions on Accounting-based Performance of Acquiring Firms in India." Global Business Review, 1-19.
Andrade, Gregor, Mitchell, Mark, and Stafford, Erik. 2001. "New Evidence and Perspectives on Mergers." Journal of Economic Perspectives, 15(2): 103-120.
Barnes, Beau, Harp, Nancy, and Oler, Derek. 2014. “Evaluating the SDC Mergers and Acquisitions Database.” Financial Review, 49(4): 793-822.
Basse-Mama, Houdou, Koch, Nicolas, Bassen, Alexander, and Bank, Theo. 2013. "Valuation effects of corporate strategic transactions in the cleantech industry." Journal of Business Economics, 83(6): 605-630.
Bettinazzi, Emanuele, and Zollo, Maurizio. 2017. "Stakeholder Orientation and Acquisition Performance." Strategic Management Journal, 38: 2465-2485.
Bhojraj, Sanjeev, Lee, Charles, and Oler, Derek. 2003. "What’s My Line? A Comparison of Industry Classification Schemes for Capital Market Research". Journal of Accounting Research, 41(5): 745-774.
Brambor, Thomas, Clark, William, and Golder, Matt. 2006. "Understanding Interaction Models: Improving Empirical Analyses." Political Analysis, 14: 63-82.
Bromiley, Philp, Govekar, Michele, and Marcus, Alfred. 1988. “On Using Event-Study Methodology in Strategic Management Research.” Technovation, 8: 25-42.
Brounen, Dirk, de Jong, Abe, and Koedijk, Kees. 2004. "Corporate Finance in Europe: Confronting Theory with Practice." Financial Management, 33(4): 71-101.
Campa, José, and Hernando, Ignacio. 2004. "Shareholder Value Creation in European M&As." European Financial Management, 10(1): 47-81.
Caprotti, Federico. 2011. "The cultural economy of cleantech: environmental discourse and the emergence of a new technology sector." Transactions of the Institute of British Geographers, 37(3): 370-385.
Chakravarthy, Balaji. 1986. “Measuring Strategic Performance.” Strategic Management Journal, 7: 437-458.
Chew, Donald. 1997. Studies In International Corporate Finance and Governance Systems.: A Comparison of the US, Japan, and Europe. London: Oxford University Press
Cording, Margaret, Christman, Petra, and Weigelt Carmen. 2010. “Measuring theoretically complex constructs: the case of acquisition performance.” Strategic Organizational, 8: 11-41. D’Alonzo, Karen. 2004. "The Johnson-Neyman Procedure as an Alternative to ANCOVA." Western Journal of Nursing Research, 26(7): 804-812.
and NGO Activism in Europe and the United States: An Institutional-Stakeholder Perspective." Journal of Management Studies, 43(1): 47-73.
Eisenbach, Sebastian, Ettenhuber, Christoph, Schiereck, Dirk, and von Flotow, Paschen. 2011. "Beginning Consolidation in the Renewable Energy Industry and Bidders’ M&A-Success." Technology and Investment, 2: 81-91.
Ellabban, Omar, Abu-Rub, Haitham, and Blaabjerg, Frede. 2014. "Renewable energy resources: Current status, future prospects and their enabling technology." Renewable and Sustainable Energy Reviews, 39: 748-764.
Friede, Gunnar, Busch, Tim, and Bassen, Alexander. 2015. "ESG and financial performance: aggregated evidence from more than 2000 empirical studies." Journal of Sustainable Finance and Investment, 5(4): 210-233.
Gaughan, Patrick. 2017. Mergers, acquisitions, and corporate restructurings, 7th Edition. New Jersey: Wiley Corporate F&A.
Ghoul, Sadok El, Guedhami, Omrane, Kwok, Chuck, and Mishra, Dev. 2011. “Does corporate social responsibility affect the cost of capital?” Journal of Banking & Finance, 35: 2388-2406. Heckman, James. 1979. "Sample Selection Bias as a Specification Error." Econometrica, 47(1): 153-161.
Heron, Randall, and Lie, Erik. 2002. "Operating Performance and the Method of Payment in Takeovers." Journal of Finance and Quantitative Analysis, 37(1): 137-155.
Hu, Nan, Li, Lu, Li, Hui, and Wang, Xing. 2020. “Do mega-mergers create value? The acquisition experience and mega-deal outcomes.” Journal of Empirical Finance, 55: 119-142. IHS Markit. 2019. "ESG on the Rise: Making an Impact in M&A." Ipreo Q1 2019 Newsletter. International Monetary Fund. 2019. World Economic Outlook: Global Manufacturing Downturn, Rising Trade Barriers. Washington, DC: International Monetary Fund.
Jensen, Michael, and Ruback, Richard. 1983. “The Market for Corporate Control: The Scientific Evidence.” Journal of Economic Finance, 11: 5-50.
Keller, Gerald. 2012. Managerial Statistics 9th Edition. Mason, Ohio: Cengage Learning. King, David, Dalton, Dan, Daily, Catherine, and Covin, Jeffrey. 2004. "Meta-Analysis of Post-Acquisition Performance: Indications of Unidentified Moderators." Strategic Management Journal, 25(2): 187-200.
Kwon, Sol., Welsh, Heidi, Lukomnik, Jon, and Young, Robin. 2018. “State of sustainability and integrated reporting 2018.” Investor Responsibility Research Center Institute.
La Porta, Rafael, Lopez-De-Silanes, Florencio, Shleifer, Andrei, and Vishny, Robert. 1997. The Journal of Finance, 52(3): 1131-1150.
Leone, Andrew, Minutti-Meza, Miguel, and Wasley, Charles. 2017. “Influential Observations and Inference in Accounting Research.” The Accounting Review, 94(6): 337-364.
Le Leslé, Vanessa. 2012. "Bank Debt in Europe: Are Funding Models Broken?" IMF Working Paper.
Mateev, Miroslav, and Andonov, Kristiyan. 2017. "Do European bidders pay more in cross-border than in domestic acquisitions? New evidence from Continental Europe and the UK." Research in International Business and Finance, 45: 529-556.
Morningstar. 2019. “Sustainable Funds U.S. Landscape Report 2018”. Morningstar Research. Morosini, Piero, Shane, Scott, and Singh, Harbir. 1998. "National Cultural Distance and Cross-Border Acquisition Performance." Journal of International Business Studies, 29(1): 137-158. Nordea Markets. 2018. “ESG.” Research Insights 14 September 2018.
Ng, Anthony, and Rezaee, Zabihollah. 2015. “Business sustainability performance and cost of equity capital.” Journal of Corporate Finance, 34: 128-149.
Pernick, Ron, and Wilder, Clint. 2007. The Clean Tech Revolution. New York: Collins.
Rajan, Raghuram, and Zingales, Luigi. 2003. "Great Reversals: The Politics of Financial Development in the Twentieth Century." Journal of Financial Economics, 69(1): 5-50.
Renneboog, Luc. 2006. Advances in Corporate Finance and Asset Pricing. Amsterdam: Elsevier B.V.
Renshaw, Anthony. 2018. “ESG’s Evolving Performance: First, Do No Harm.” Axioma Whitepaper – Index Solutions July 2018.
Salvi, Antonio, Petruzzella, Felice, and Giakoumelou, Anastasia. 2018. “Green M&A Deals and Bidders’ Value Creation: The Role of Sustainability in Post-Acquisition Performance.” International Business Research, 11(7): 96-105.
Shalizi, Cosma. 2015. "Lecture 10: F-Tests, R2, and Other Distractions." Paper presented at the statistics class Modern Regression on 16 October 2015 at Carnegie Mellon University, Pittsburgh, PA.
Sharfman, Mark, and Fernando, Chitru. 2008. “Environmental Risk Management and the Cost of Capital.” Strategic Management Journal, 29: 569-592.
Thanos, Ioannis, and Papadakis, Vassilis. 2012. “The use of accounting-based measures in measuring M&A performance: A review of five decades of research.” Advances in Mergers and Acquisitions, 10: 105-121.
Vatcheva, Kristina, Lee, MinJae, McCormick, Joseph, and Rahbar, Mohammad. 2016. "Multicollinearity in Regression Analyses Conducted in Epidemiologic Studies." Epidemiol, 6(2): 227-235.
Wooldridge, Jeffrey. 2013. Introductory Econometrics: A Modern Approach, Fifth Edition. Mason, Ohio: Cengage Learning.
Yoo, Kyungjin, Lee, Youah, and Heo, Eunnyeong. 2013. "Economic effects by merger and acquisition types in the renewable energy sector: An event study approach." Renewable and Sustainable Energy Reviews, 26: 694-701.
Zephyr. (2013). “Zephyr Cleantech Report – August 2013.” Bureau van Dijk Technical Report. Zollo, Maurizio, and Meier, Degenhard. 2008. “What is M&A Performance?” Academy of Management Perspectives, 22(3): 55-77.
acquisition strategies and integration capability in U.S. bank mergers.” Strategic Management Journal, 25(13): 1233-1256.