UNIVERSIDADE DA BEIRA INTERIOR
Engenharia
Business Model for Air Transportation
in Specific Market Segments
Airships for Logistics Case Study
Inês Ramos da Cruz
Dissertação para obtenção do Grau de Mestre em
Engenharia Aeronáutica
(Ciclo de estudos integrado)
“A journey of a thousand miles begins with a single step” Famous Chinese proverb ascribed to Laozi
Acknowledgements
First of all, I would like to express my deepest appreciation to Professor Jorge Miguel dos Reis Silva for having accepted to embark on my last academic journey. Without his guidance and persistent help, this dissertation would not have been possible.
I have a great sense of gratitude towards Engenheira Maria Emília Baltazar, who aided me by providing all the necessary tools and advice for me to build a strong foundation for this thesis. A profuse thank you to all the proudly called “NITeiros” who were always the first to lend a helping hand and share knowledge.
My sincere thankfulness to Doutor Miguel Ribeirinho and Doutor Pedro Carvalho.
It is a pleasure to acknowledge my thanks and gratitude to my friends Maria Cunha, Pedro Batista, Sofia Soares, Rita Marques, Mariana Costa and Beatriz Leal who were able to keep my sanity above average during this “expedition”.
For me it is an honour and proud privilege to thank my parents, Natália and José for being my first mentors and guiders in life, for always helping me to the best of their abilities and providing me with all I need to get this far and fulfil this milestone, I sincerely thank you. Last but certainly not the least, I would like to give my special thanks to my sister Catarina who was my pillar during this process. Thank you for all the encouragement, never allowing me to give up and for “stepping forward” to read this work.
Resumo
Desde os tempos mais primordiais, o Homem teve a necessidade de transportar bens, pessoas ou animais.
Com os avanços e mudanças da tecnologia, também a procura de transporte por parte dos utilizadores sofreu alterações. Neste sentido surgiram novos meios de transporte e os dirigíveis, por exemplo, começaram a ser alvo de um crescente nível de atenção, sobretudo devido ao facto de as entidades aeronáuticas terem uma maior preocupação com a adoção de tecnologias amigas do ambiente.
Neste século, os dirigíveis começaram a ter a sua quota-parte nos mais diversos usos: publicidade, vigilância, monitorização, investigação e turismo. Nesta dissertação foi analisado um outro uso, o transporte de carga, para perceber se este poderia ser uma alternativa prática relativamente ao transporte rodoviário e se assim se poderia contrariar algumas das restrições encontradas no que toca à logística tais como: vias rodoviárias em mau estado de conservação, interdições à circulação de alguns tipos de veículos em certas áreas, e congestionamento de tráfego.
Neste trabalho mostrou-se como a utilização de dirigíveis para o transporte de carga e, consequentemente, o seu papel em termos da logística de distribuição, é exequível. Para tal, foram analisados os elementos essenciais a um modelo e plano de negócios, estudadas as metodologias de otimização em rede de possíveis rotas, e abordado um caso de estudo com base na operação real de uma empresa no mercado nacional. Os resultados confirmaram a viabilidade dos pressupostos iniciais corroborando as vantagens (mas também os desafios) da utilização de dirigíveis na cadeia logística do transporte de carga.
Palavras-chave
Resumo alargado
Introdução
Serve a presente secção para explicar e demonstrar resumidamente o trabalho de MSc efetuado.
Primeiramente é descrito o enquadramento da dissertação, consecutivamente são explicados os casos de estudo e finalmente são indicadas as conclusões e quais as perspetivas de trabalhos futuros.
Enquadramento da dissertação
A intensidade do tráfego e congestionamento nas cidades, principalmente em áreas mais centrais, são os principais responsáveis pela redução das deslocações diárias e pelo aumento do seu tempo, aumentando assim também o custo do transporte e pondo em causa a venda a retalho.
A entrega de produtos, especialmente na indústria alimentar, é feita por diferentes operadores nos mesmos dias da semana o que resulta em congestão de bens, devido a múltiplas cargas e descargas a acontecer simultaneamente. Em zonas mais centrais a morfologia urbana dificulta o fluxo de tráfego e as cargas/descargas, além de causar interdição de acesso a veículos a tentarem alcançar alguns estabelecimentos aí localizados. As companhias de transporte vêm-se obrigadas a alterar o vêm-seu horário de entregas e a organização das mesmas de modo a mitigar as dificuldades existentes, o que por si só resulta em mais despesas.
Uma das hipóteses que permite preencher a lacuna apresentada são os dirigíveis visto que são o ponto mediano entre velocidade e o consumo de combustível. Apesar de já terem a sua quota--parte de história, são inovadores pela tecnologia que utilizam. Grandes empresas começaram já a investir neste nicho de mercado.
Objetivos
O objetivo deste trabalho é analisar e avaliar a viabilidade técnica e económica do modelo de negócio resultante da utilização de um dirigível para logística. No entanto há um leque de sub-objetivos a serem cumpridos de modo a satisfazer a proposta, como avaliar o tipo de dirigível, avaliar o impacto económico que pode trazer a implementação desta solução, e se, de acordo com a tecnologia atual, será a solução mais adequada para corresponder aos problemas da logística.
Caso de estudo
o modo rodoviário), analisámos três cenários: dois utilizando apenas o dirigível, e um terceiro em que este veículo partilhava a operação logística com o modo rodoviário.
Nos casos de estudo tidos em conta a escolha da empresa teve que ser muito refletida pois a carga teria que ser relativamente homogénea e paletizável. Assim sendo a escolha recaiu numa empresa nacional de comercialização e transporte de café para toda a Península Ibérica. Os três casos de estudo, que englobam 4 cidades portuguesas – incluindo a sede da empresa, foram os seguintes:
Caso de estudo 1 – o dirigível é usado cinco dias por semana de modo a igualar o sistema de transporte de carga normalmente entregue pela empresa;
Caso de estudo 2 – o dirigível faz o transporte de carga não só nos dias uteis, mas 7 dias por semana;
Caso de estudo 3 – a distribuição de café é feita de um modo que combina o transporte feito por camião (entre a sede da empresa e um depósito numa das cidades) e aquele feito com recurso a dirigíveis (desse depósito para as outras duas cidades).
Aplicando algoritmos de otimização em rede e usando os resultados obtidos para a elaboração de um plano de negócio, o cenário que oferece o decréscimo mais significativo dos custos é o referente ao Caso de estudo 2 (Tabela 1). Senão, vejamos:
No caso de estudo 1 os parâmetro mensais foram 10.760 km percorridos que correspondem a cerca de 73 horas de voo (a velocidade cruzeiro do dirigível é 148 km/h). Se o custo por hora que o dirigivel voa for 180 €, o custo mensal equivale a 13.140 € (este caso não inclui custos de armazenamento). Em transporte rodoviário a empresa dispende, mensalmente, cerca de 13.810 € (incluido despesas de armazenamento). Neste caso, em particular, a distancia percorrida é de 6.600 km (o que se traduz em aproximadamente 66 horas). Tendo em conta esta informação, é claro que pela implementação da solução do caso de estudo 1 o tempo dispendido aumentaria 10%, o custo do transporte diminuiria 4%, e a distância percorrida sofreria um aumento de 63%;
No caso de estudo 2 os parâmetros obtidos foram 9.184 km percorridos em 62 horas e um custo de 11.160 € (este caso também não implica custos de armazenamento). Isto significa que o dirigível voa 10% menos quando comparado ao tempo dispendiso pelo transporte rodoviário, e há ainda uma diminuição de 20% nos custos associados à sua utilização; no entanto, há um acréscimo na ordem dos 39% no que diz respeito à distância percorrida;
No caso de estudo 3, observa-se um total de 5.640 km voados em 38 horas com um custo de 14.490 € (ao contrário dos casos anteriores este implica custos de armazenamento). A implementação desta solução resultaria numa redução quer das horas de voo (42%) que dos quilómetros viajados (15%), mas também implicaria um aumento de 5% em termos de custos.
Tabela 1 – Comparação entre parâmetros relativos à solução atualmente em vigor e os obtidos para cada caso de estudo. Elaboração própria.
Tempo (h) Custo (€) Distância (km) Tempo Relativo Custo Relativo Distância Relativa Modo Rodoviário 66 13.810 6.600 Caso de Estudo 1 73 13.140 10.760 ↑10% ↓4% ↑63% Caso de Estudo 2 62 11.160 9.184 ↓6% ↓20% ↑39% Caso de Estudo 3 38 14.490 5.640 ↓42% ↑5% ↓15%
Principais conclusões
De acordo com os estudos mais recentes a população global tem um crescimento previsto de 9.1 mil milhões até 2050 e os habitantes de zonas urbanas terão um aumento na ordem dos 50 a 70% do total da população mundial. Isto irá certamente traduzir-se num crescimento exponencial da procura em transporte e assim acentuar todos os problemas relacionados com logística.
De acordo com a análise efetuada, foram obtidos resultados promissores de modo a demonstrar a viabilidade do estudo quando financiado por acionistas e desde que o preço por hora de voo não exceda 180 €, estas condições garantirá um lucro de 52.67% sobre as receitas.
Perspetivas de trabalhos futuros
No entanto há ainda algumas tarefas a serem cumpridas de modo a tornar esta proposta o mais completa e precisa possível:
Estudo de mercado e procura; Análise da atratividade;
Análise de sensibilidade operacional e económicas;
Abstract
Since the beginning of times, humanity has needed transportation of goods, people or animals. As technology advanced and changed, the user's demand was modified. Hence new means of transportation started arising and airships, for instance, have been getting an increasing amount of attention, mostly due to the fact that aeronautical entities have been concerned with adopting environmentally friendly technologies.
In this century, airships started to have their fair share of distinct uses: advertisement, surveillance, monitoring, investigation and tourism. In this dissertation another use was analysed, this was logistics freight transportation to inquire if it would be a practical alternative to road transportation and if it could counter some of the nowadays’ restraints found in logistics such as poor street conditions, interdiction to the circulation of some vehicles in certain areas, and traffic congestion.
In this thesis, it was shown how using airships for freight and consequently its role in terms of logistics’ distribution is feasible. To do so, the vital elements of a business plan and model were analysed, the network route optimisation methodologies were studied and an approach to a case study based on a real company’s operation in the national market was made. The results confirmed the viability of the initial assumptions corroborating the advantages (along with the challenges) of using airships in the logistics chain of freight transportation.
Keywords
Table of Contents
Acknowledgements ... v Resumo ... vii Resumo alargado ... ix Abstract... xiii Table of Contents ... xvList of Tables ... xix
List of Acronyms ... xxi
Chapter 1 ... 1
Introduction ... 1
1.1 Motivation ... 3
1.2 Object and Objectives ... 5
1.3 Dissertation Structure and Methodology... 5
Chapter 2 ... 7
State of the Art – Literature Review ... 7
2.1 Introduction ... 9
2.2 Business Models ... 9
Osterwalder and Pigneur’s Business Model Canvas ... 10
Business Plan ... 12
2.3 Logistics ... 12
Introduction ... 12
Market Segments ... 13
Market Regulation ... 14
Agents and Stakeholders ... 15
2.4 Air Cargo Transportation ... 17
Introduction ... 17 Special Cargo ... 17 Goods ... 18 2.5 Airships ... 19 History Note ... 19 Types ... 22 Application Examples ... 23 2.6 Conclusion ... 26 Chapter 3 ... 27
Operational Performance and Cost Structure Optimisation ... 27
3.1 Introduction ... 29
3.4 Conclusion ... 35 Chapter 4 ... 37 Case Study ... 37 4.1 Introduction ... 39 4.2 Airship Characteristics ... 39 4.3 Business Model ... 41 Cargo ... 41
Business Model Canvas ... 41
4.3.2.1. Customer Segments ... 41 4.3.2.2. Key Resources ... 41 4.3.2.3. Key Partners ... 42 4.4 Solution Implementation ... 42 Introduction ... 42 Case Study 1 ... 44 Case Study 2 ... 47 Case Study 3 ... 48 Conclusion ... 51 4.5 Business Plan ... 52 Cost Structures ... 54 Revenue Streams ... 55 4.6 Conclusion ... 55 Chapter 5 ... 57 Result Analysis ... 57 5.1 Introduction ... 59 5.2 Business Plan ... 59 Costs ... 59 Revenues ... 60 Profits ... 61
5.3 Comparison Between Actual Transportation and Airship Transportation ... 61
5.4 Conclusion ... 63
Chapter 6 ... 65
Conclusions ... 65
6.1 Dissertation Summary ... 67
6.2 Concluding Remarks ... 68
6.3 Prospects for Future Work ... 68
References ... 71
Annex 1 ... 75
List of Figures
Figure 1. 1 - Usage of petroleum in the different fields in the USA. ... 3
Figure 1. 2 - Boeing world air cargo forecast 2016-2017. ... 4
Figure 1. 3 - Fuel consumption and speed according to each type of transportation. ... 4
Figure 1. 4 - Scheme of this thesis methodology. ... 6
Figure 2. 1 – Business Model Canvas. ... 11
Figure 2. 2 – Top challenges faced by shippers. ... 13
Figure 2. 3 - Agents and stakeholders in freight logistics. ... 15
Figure 2. 4 - Value, shelf life, and dominant transport modes in intercontinental movements of food products and ornamentals. ... 19
Figure 2. 5 - History of airships according to their type from 1850 until 1960 divided by structure types: rigid (a), semi-rigid (b) and non-rigid (c). ... 21
Figure 2. 6 – Companies that manufacture airships according to their flying altitude. ... 22
Figure 2. 7 – Airships division according to their structure. ... 22
Figure 2. 8 – Lifting gases comparison in its 100% purity state. ... 23
Figure 2. 9 – Sky Station platform proposal. ... 25
Figure 3. 1 – Distances between cities. ... 31
Figure 3. 2 – Case 1 (left) and Case 2 (right). ... 31
Figure 3. 3 – Solution for the placement of a depot in city 1 according to the TSP. ... 32
Figure 3. 4 – Final path when applied the TSP... 32
Figure 3. 5 – Costs of travelling from each city to another. ... 34
Figure 3. 6 – Final results from implementing the Clarke and Wright algorithm. ... 35
Figure 4. 1 – Scheme representing the lift types in airships. ... 39
Figure 4. 2 – Airlander 10 by the British company HAV. ... 40
Figure 4. 3 – Business model canvas filled. ... 42
Figure 4. 4 – Current transportation path taken by company’s lorries. ... 43
Figure 4. 5 - Approximate results of each city’s demand for coffee per day. ... 44
Figure 4. 6– Explanation of how the Clarke and Wright Algorithm works. ... 45
Figure 4. 7 – Representation of the solution for Case Study 1. ... 46
Figure 4. 8 – Distance between each point. ... 47
Figure 4. 9 - Scheme of the solution for Case Study 2. ... 48
Figure 4. 10 – Explanation of the case study in question. ... 49
Figure 4. 11 – Scheme of the path where the TSP will be used on. ... 49
Figure 4. 12 – Economic model representation. ... 52
Figure 5. 1 – Representation of the different components and their percentages in the cost structure in a leasing financing case. ... 59 Figure 5. 2 - Representation of the different components and their percentages in the cost
Figure 5. 3 – Graphical representation of the components that add up to the revenues. ... 60 Figure 5. 4 - Summary of the comparison of the data regarding costs and distance travelled. 64 Figure 5. 5 - Summary of the comparison of the data regarding time travelled. ... 64
List of Tables
Table 2. 1 – Different definitions given by the authors concerning business models. ... 9
Table 2. 2 - Comparison between physical characteristics of different means of transportation. ... 24
Table 2. 3 - Comparison between non-physical characteristics of different modes of transportation. ... 24
Table 2. 4 – Airship application scenarios, evaluated by the level of operational capacity. ... 24
Table 4. 1 – Detailed technical data from Airlander 10. ... 40
Table 4. 2 - Road freight distances between each point in km. ... 43
Table 4. 3 - Distances between each point in a straight line in km. ... 43
Table 4. 4 – Tons of extra coffee freighted per week. ... 50
Table 4. 5 – Distances in kilometres for the first 10 months of Case Study 3. ... 51
Table 4. 6 - Costs and Revenues of using the Airlander 10 as a logistics solution. ... 54
Table 4. 7 – Summary of the results delivered by the business plan. ... 56
Table 5. 1 - Results from the comparison of each case study to the company’s used road transportation. ... 62
Table 5. 2 - Costs and Revenues of the using the Airlander 10 as a logistics solution with 682 flight-hours per year. ... 62
List of Acronyms
CWA Clarke and Wright Algorithm
CC Coffee Company
DELAG Deutsche Luftschiffahrts-Aktiengesellschaft
GCD Great Circle Distance
HAV Hybrid Airship Vehicles
LEMV Long Endurance Multi-intelligence Vehicle
NNR Nearest Neighbor Rule
TSP Travelling Salesman Problem
UAVs Unmanned Aerial Vehicles
USA United States of America
Chapter 1
Introduction
1.1 Motivation
1.2 Object and Objectives
1.1 Motivation
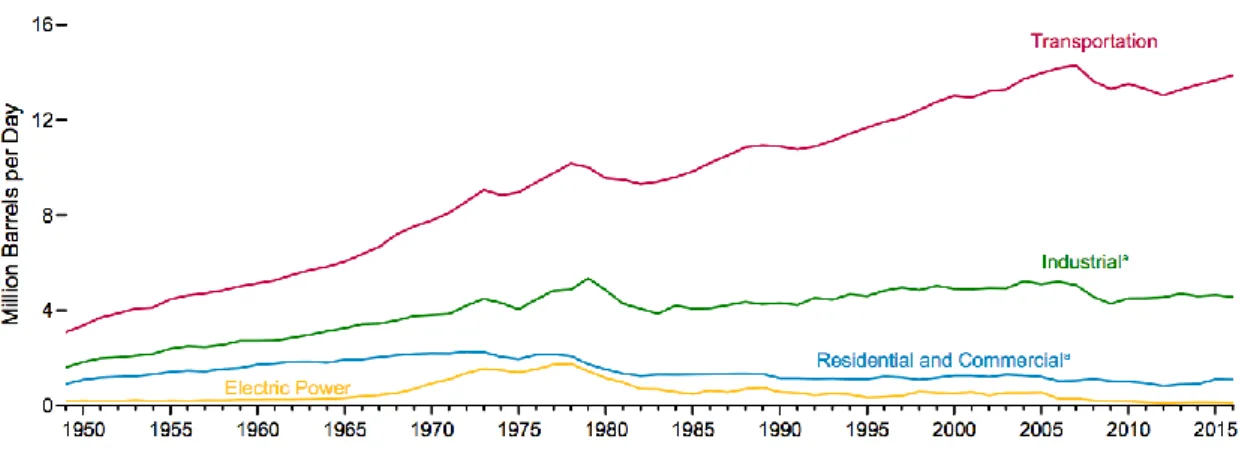
Nowadays people are faced with information that they should avoid as much as possible fossil fuels. The most used one is petroleum which is the major origin of environmental problems like acid rains, global warming, oil spills and ocean acidification which end up causing devastation both in fauna and flora and decrease our life’s longevity and quality. As depicted from Figure 1.1 transportation is where the main problem resides. Therefore it must be the first one to be analysed.
Figure 1. 1 - Usage of petroleum in the different fields in the USA. Source: [1].
The traffic intensity in cities, especially in the central areas, is the main responsible for the reduction of daily dislocations and the increase of their timing, therefore raising the cost of transportation and jeopardising the retailing.
The product delivery, mainly in the food industry, is made by different operators in the same days of the week, privileging the morning periods which will then result in a traffic congestion of goods, because of multiple loading/unloading happening at the same time. In specific periods of the year (with emphasis on Christmas), the passengers and goods’ circulation, which will worsen even more its distribution. In more central areas the urban morphology will difficult the traffic’s flow and the loading/unloading; thus, causing an access interdiction to vehicles trying to reach some establishments located there.
Freight companies are forced to change the delivery’s schedule and organisation to mitigate the difficulties, resulting in more expenses.
A forecast made by Boeing in 2016-2017 shows that the RTKs1 will triple in 20 years (Figure
1.2). Thus bound to the fact that the world’s population is increasing rapidly and therefore logistic problems will grow, the question is: What can be done regarding transportation to solve this issue, while still responding to the boost of the population and therefore freight logistics?
Figure 1. 2 - Boeing world air cargo forecast 2016-2017. Source: [2].
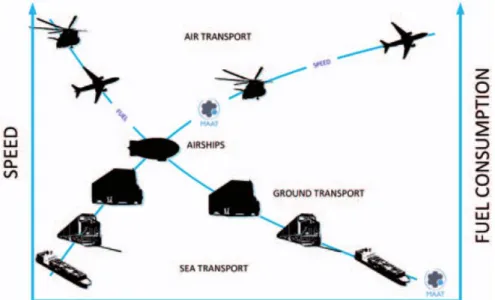
By addressing this question and based on Figure 1.3 the obvious answer to fill the gap presented is airships as they are the midpoint regarding speed and fuel consumption. Although they are not exactly a new type of transportation and have been around for some time, they are innovative and major companies have started to invest and notice this market niche of the market.
Figure 1. 3 - Fuel consumption and speed according to each type of transportation. Source: [3].
1RTKs are a standard industry metric used to quantify the amount of revenue generating payload carried,
considering the distance flown. RTKs comprise the passengers, freight and mail carried multiplied by the Great Circle Distance (GCD), which is a standard published distance between two airports.
1.2 Object and Objectives
The object of this work is an airship for logistics; the objective is to analyse and evaluate the technical and economic viability of a business model for this scenario. There are a certain number of sub-objectives to be accomplished to attain this, such as the airship type assessment, to evaluate the economic impact it may have when it is implemented, and according to the existing technology if it is adequate to today’s freight logistics demands in a market niche.
1.3 Dissertation Structure and Methodology
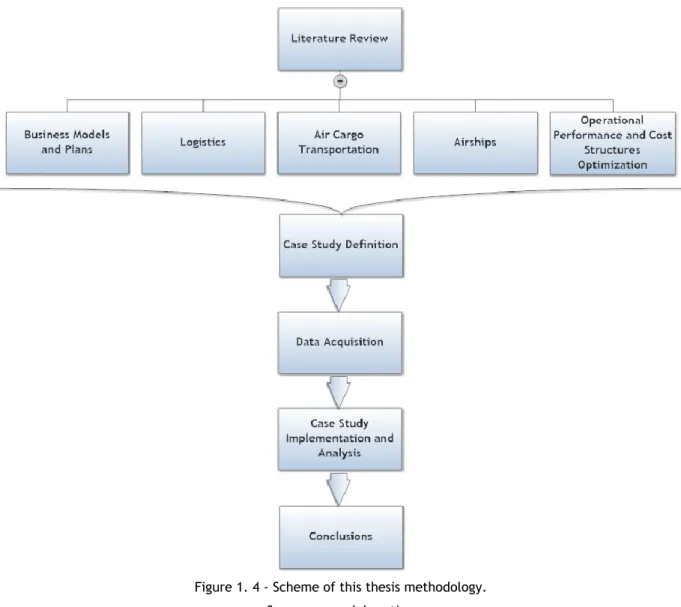
This dissertation is divided into six chapters.
The first chapter consists of an introduction to the theme, as well as a description of the objects and objectives, including an explanation of the methodology used.
Chapter two focus a state of the art and literature review regarding business modelling, freight logistics, air cargo transportation and airships.
The third chapter presents and explains the most suitable algorithms for a network optimisation that will be used to sustain the case study, mainly: the Travelling Salesman Problem, and the Clarke and Wright Algorithm.
Chapter four depicts the results attained that will determine if our proposal is a successful business, both technically and financially, based on several critical parameters: the main airships’ characteristics and cargo type, the business model and plan, and the contextualization of the case study and optimal solutions to be adopted.
The fifth chapter focused on the results analysis, mainly: the business plan, and the comparison between road and airship solutions for the transportation of goods.
Chapter six presents the dissertation conclusions, including some final remarks and few recommendations for future research.
Figure 1. 4 - Scheme of this thesis methodology. Source: own elaboration.
Chapter 2
State of the Art – Literature Review
2.1 Introduction
2.2 Business Models
2.2.1 Osterwalder and Pigneur’s Business Model Canvas
2.2.2 Business Plan
2.3 Logistics
2.3.1 Introduction
2.3.2 Market Segments
2.3.3 Market Regulation
2.3.4 Agents and Stakeholders
2.4 Air Cargo Transportation
2.4.1 Introduction
2.4.2 Special Cargo
2.4.3 Goods
2.5 Airships
2.5.1 History Note
2.5.2 Types
2.5.3 Application Examples
2.1 Introduction
This chapter provides a general state of the art and literature review concerning business models and plans linked to the airships use for logistics. It starts with a brief introduction to air cargo transportation focusing on airships and their role in today’s freight transportation. Considerations regarding logistics and business models and plans were taken to achieve so and how to construct a better solution to test that hypothesis. Linking all these concepts together is a major step in recognising the importance of the airships to start a business as is suggested. The original idea was to adopt an airship for freight in a broad logistics concept, that is in an urban environment, with several cargo types. Nonetheless, the idea revealed itself not so feasible when we began trying to disaggregate cargo, and the short travelling legs of the distribution network were not appropriated to fit the expected (even preliminary) results. Therefore, the urban logistics concept was abandoned, and a logistics chain with the distribution of a unique cargo type was chosen.
2.2 Business Models
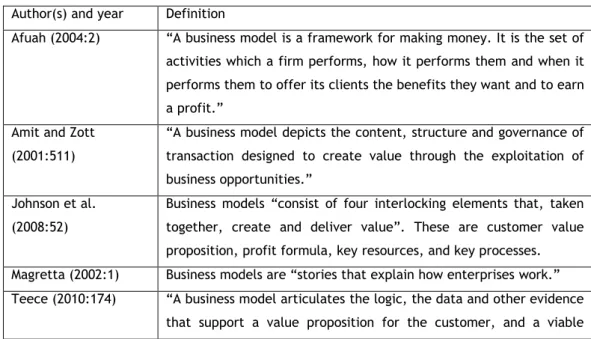
Although it has become a generalised expression in the aftermath of the dot.com companies’ boom, it is not easy to find a consensual definition of what a Business Model should be. [4:662] for instance consider it as a cause “trying to differentiate a business model as a term from a strategy notion”; on the other hand [5:206] states that one of its probable causes is the “interest in the concept by a vast number of segments that can relate to this term”. Nonetheless, the only foregone conclusion one can have is that there is no universal definition of this concept, as seen in Table 2.1.
Table 2. 1 – Different definitions given by the authors concerning business models. Source: adapted from [4].
Author(s) and year Definition
Afuah (2004:2) “A business model is a framework for making money. It is the set of activities which a firm performs, how it performs them and when it performs them to offer its clients the benefits they want and to earn a profit.”
Amit and Zott (2001:511)
“A business model depicts the content, structure and governance of transaction designed to create value through the exploitation of business opportunities.”
Johnson et al. (2008:52)
Business models “consist of four interlocking elements that, taken together, create and deliver value”. These are customer value proposition, profit formula, key resources, and key processes. Magretta (2002:1) Business models are “stories that explain how enterprises work.” Teece (2010:174) “A business model articulates the logic, the data and other evidence
structure of revenues and costs for the enterprise delivering that value.”
Osterwalder & Pigneur (2010:4)
“A business model describes the rationale of how an organisation creates, delivers and captures value.”
Chesborough and Rosenbloom (2002:1)
The business model is “the heuristic logic that technical potential with the realisation of economic value.”
Osterwalder and Pigneur’s Business Model Canvas
Osterwalder and Pigneur defend that “the starting point of any good discussion, meeting or business innovation related workshops must be a common knowledge what a business model really is”. They even defend that it is necessary to define a “model”, in a “way for everyone to understand it”, i.e., a model which is simultaneously “simple, relevant and intuitive”[6:15]. Osterwalder and Pigneur have developed a business model description method composed of “nine basic blocks that show how a company intends to make money. The nine blocks cover the four main areas of business: customer, offer, infrastructure and financial viability”[6:15]. The nine basic blocks are as follows[6:15]:
Customer Segments: Everyone in the organisation which serves and creates benefits. (“For whom are we creating value? Who are our most important customers?”);
Value Propositions: Seeks to solve customer’s problems satisfying their needs with value propositions, that is products and services create benefits for clients. (“What do we deliver to the customer? Which one of our customers’ problems are we helping to solve? Which customer needs are we satisfying? What bundles of products and services are we offering to each customer segments?”);
Channels: Value propositions delivered to customers through communication channels, distribution, and sales. (“Through which channels do our customer segments want to be reached? How are we reaching them now? How are our Channels integrated? Which ones work best? Which ones are the most cost-efficient? How are we integrating them with customer routines?”);
Customer Relationships: Relationships established and maintained with each customer segment. (“What type of relationship does each of our customer segments expect us to establish and maintain with them? Which ones have we established? How costly are they? How are they integrated with the rest of our business model?”);
Revenue Streams: Result from value propositions successfully offered to customers. (“For what value are our customers really willing to pay? For what do they currently
pay? How are they currently paying? How would they prefer to pay? How much does each revenue stream contribute to the overall revenues?”);
Key Resources: Assets required to offer and deliver the previously described elements. (“What key resources do our value proposition require? Our distribution channels? Customer relationships? Revenue streams?”);
Key Activities: Activities which undeniably will have to present a good performance, by accomplishing some key activities. (“What key activities do our value propositions require? Our distribution channels? Customer relationships? Revenue streams?”); Key Partnerships: Several activities are negotiated with third parts, and some resources
are (or can be) acquired outside the company. (“Who are our key partners? Who are our key suppliers? Which key resources are we acquiring from partners? Which key activities do partners perform?”);
Cost Structures: The business model’s elements are the result of cost structures. (“What are the most important costs inherent in our business model? Which key resources are the most expensive? Which key activities are most expensive?”).
These nine blocks, when aggregated, depict a business tool called “Business Model Canvas” (Figure 2.1).
Figure 2. 1 – Business Model Canvas. Source [6].
Business Plan
Business plans are a written narrative that describes what the new activity intends to fulfil. They normally have two different uses: inside and outside the company. Inside the company, the plan helps to develop a “roadmap” with the steps to follow while the plan and strategies are implemented. Outside the company, it gives to the potential investors and stakeholders the business opportunity that the company strives for and how it plans to do so [7].
When well-perceived, the business plan provides a path for any new or pre-existing business to profit. There are essentially three benefits of having a carefully written business plan [8]:
It serves as a guide for the business as it provides the tools that allow a business analysis and implementation of changes to make the business as profitable as possible and should be kept updated;
It is crucial as documentation for financing as it contains a detailed strategy of what the stakeholder proposes to do to improve the company’s profitability; it is also essential for the leader if he/she had access to other company’s statistic data to understand if the own proposed projections are reasonable;
It is essential to expand into foreign markets as it demonstrated how the business could compete with existing ones in the global economy; this should not be overlooked since it has potential to make the company grow and further increase success.
2.3 Logistics
Introduction
The definition of logistics is “the process of coordinating the flow, material and information, for point dealer to point consumer, effectively and efficiently, according to customer needs”[9:2]. Alternatively, it can be seen as o mean to “target the analysis, planning, and management of integrated and coordinated physical, informational, and decisional flows within a potentially multi-partner value network” [10:2].
Logistics is a tool that optimises the already existing production and distribution based on applying management techniques for promoting an increase in efficiency and the companies’ competitiveness. Transportation is the main influence in logistics it occupies one-third of the companies’ costs in logistics. Transportation is required in the entire procedure from the producer to the final consumer and back to the company, which explains why only an excellent cooperation between logistics and transportation can bring advantages to both the company and the customer [11].
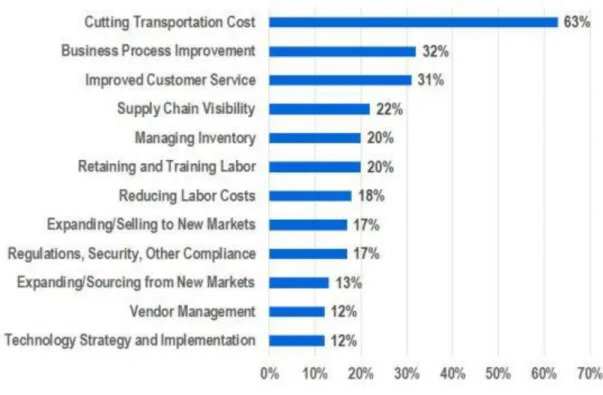
The chart in Figure 2.2 depicts the challenges that shippers are facing. Most of the respondents indicated a concern regarding costs cutting in transportation which as expected represents a significant part of the companies’ expenses. The study also shows the demand for the new technology and innovation while remaining cost-conscious [12].
Figure 2. 2 – Top challenges faced by shippers. Source: [12]
The logistics industry is exponentially growing which shows its importance as it induces more international investments and business. Counter-wise, an inadequately planned logistics might decrease the company’s profit.
Market Segments
Many economic sectors need to be harmonised for the city’s day to day work life. Some of them present the same type of transportation characteristics, as follows [13]:
Retail – It is divisible in chain retailing (like supermarkets) who get “served through centralised distribution systems” [13:280], and smaller to medium-sized stores. The last ones have a different supplying system since they are not centralised, thus increasing the number of deliveries when compared to the chain retailing (approximately three times superior);
Consumer shopping trips – This represents any public or private transportation the customers may use from the retailer to their house; it makes up a noteworthy share of
Couriers, Express and Parcel (CEP) – These are mainly responsible for the transportation of parcels and documents (usually no bigger than 30kg) to each customer’s house. However, this type of segments as some problems associated such as “high delivery failures, empty trip rates and a lack of critical mass in areas with limited demand” [13:280];
Hotel, Restaurants and Catering (HoReCa) – This also embodies a big share of the urban freight traffic as this segment is accountable for the preparation and delivery of foods and beverages to hotels, bars, canteens, and restaurants;
Construction – Everyday any city has building and repairing activities in offices, houses, roads, and thus the demand is higher for irregular deliveries;
Waste – All the activities in a city produce waste which needs transportation to be recycled. Recycling waste needs special means of transportation;
Industrial and terminal haulage – Besides being places of consumption there are goods and materials produced in cities that need distribution. Therefore there is the existence of production and distribution accommodations. “These facilities are commonly found close to ports, airports and rail terminals, which are transit points to regional or global transport networks” [13:281].
In this dissertation, the focus will lie in the first-mentioned market segment, that is, in the retail chain.
Market Regulation
Since the beginning of Humanity, food has been an important aspect of humans’ life and health. Thus legislation regarding this matter has become more rigorous due to a more demanding and interested society.
The Portuguese legislation, as well as the international one, for the transportation of food products, states that the freight must be made by an adequate vehicle prepared for such or placed in a convenient container.
When transporting perishable goods (like fresh meat and fish, fresh fruits and vegetables) one must consider low temperatures (below 5 ºC) as it is harder for any dangerous bacteria to proliferate in colder environments.
Transporting nonperishable goods offers fewer problems and less necessary extreme cares as they are not as easily contaminated as those above. The main consideration is when storing,
keeping them in a dry place with little to no likelihood of temperature oscillations, responsible for causing container sweat2.
As far as goods transportation is concerned, the Portuguese legislation is harmonised with the European ones: Regulations (EC) 852/2004 and 178/2002 [14]–[16].
Agents and Stakeholders
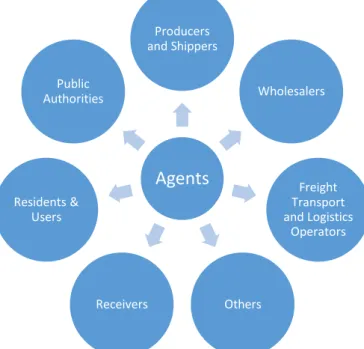
In spite being overlooked, Agents and Stakeholders are important concepts in logistics as they can impact (most of the times negatively) on urban freight (Figure 2.3) as follows [17]:
Figure 2. 3 - Agents and stakeholders in freight logistics. Source [17].
Public Authorities: There are three levels of authorities: local government, national government, and an international government (like the European Commission). A local government may refer to a set of regional/metropolitan agencies and municipalities; if so their coverage will be bigger than just one municipality and thus they should cooperate to ensure an excellent logistics service. The international and national authorities create adequate legislation and promote the cooperation between national and international regions and municipalities;
Producers & Shippers: They prepare the goods, that is, by packing and delivering them. As stakeholders, they impact logistics as “they may rework their packaging styles in cooperation with transport companies, resulting in higher loading capacity” [17:15]; in
Agents
Producers and Shippers Wholesalers Freight Transport and Logistics Operators Others Receivers Residents & Users Public Authoritiesthe cases of running an exclusive fleet of vehicles they can account up to 30% of urban deliveries;
Wholesalers: Being a stakeholder in-between Producers and Receivers they are responsible for buying large quantities of goods in bulk and re-selling them to the retailers. Wholesalers are accountable for the “rationalisation of the number of vehicles and transport kilometres since they promote the concentration of flow in a reduced number of locations”[17:15]. Liable for freight flow control, these are the most knowledgeable stakeholders in what the market is concerned;
Freight Transport and Logistics Operators: These are answerable for the physical movement of goods between locations; simultaneously they work as invoices and billing placers, warehouses providers and inventory managers. The stakeholders mentioned above can be like wholesalers as they “collect and bundle freight flows from different producers”[17:15] before making its distribution. This market of freight transportation tends to be heterogeneous as the size of the enterprises ranges from small family-run companies (with a small fleet of vehicles) to large international companies (with fleets of hundreds of vehicles);
Receivers: They are dispersed in the urban and non-urban areas and are directly linked to logistics services; as small retailers, often they have vehicles to attend to the wholesalers. These vehicles are also used for leisure and business travels. Nonetheless the receivers “are not responsible for freight transport since shipments are organised and paid for by the shipper”[17:16];
Residents and Users: These stakeholders are people who spend most of their time in the urban area whether it is in leisure activities, shopping or working. Unfortunately, logistics services come with many unwanted results such as emissions, smells, noises and vibrations, which don’t go up to the quality life of these residents’ expectations. Lately, a new trend is rising, e-commerce and home delivery which worsen all the problems mentioned above;
Others: This class contains the “so-called resource supply stakeholders, including investors, infrastructure providers, and managers […], landowners, and providers of vehicles or information technologies (IT) support systems.” [17:17].These stakeholders are directly linked to the investments and innovations that allow the possibility for freight transport to evolve.
2.4 Air Cargo Transportation
Introduction
After World War II there was an increase in the volume of goods freighted, which was due to a boom in the globalisation of the world’s economy thus providing more attention to the ways the freight was made.
In the specific case of air transportation freight, the three top groups responsible for this activity are airlines, integrators and forwarders [18].
Airlines do not deal directly with customers, and so they can be divided into two broad categories: combination and all-cargo carriers. Combination carriers transport either passengers or freight on the main deck of an aircraft. All-cargo carriers include integrated freight and dedicated freight carriers (airlines that operate only freight aircraft with no scheduled passenger services).
Integrators are the ones who handle shipment from origin to destination and deal directly with customers. They combine all operations of freight shipping into one business (includes road carriage, freight forwarding and air transportation.
Lastly, forwarders are an intermediary who connects the importer, exporter or other involved companies or persons in shipping goods and organising the transportation in a safe and cost-efficient way. They are essentially the middle-man who link the shipper, the airline and the consignee (the entity responsible for receiving the shipment) [19].
Special Cargo
In freight, it is recurrent that not all the items are consistent regarding size and weight, and the fact that they differ dictates that a different transportation method should be applied to particular (special) cargos.
There are many and distinct reasons why sometimes cargo can be considered difficult to transport, whether it is due to rural destinations having improvised means of access or simply not fitting for a normal plane, lorry, or ship. Some freight companies have been faced with very difficult, near impossible, cargo that requires special planning and arrangements.
Global Shipping Services is an example of the difficulties mentioned above: it has had some complicated cases such as moving large and heavy compressors and coolers from Texas (USA) to Mumbai (India) in a schedule as tight as four working days using a lorry and ship freight to accomplish this mission [20]. Others special cargo included moving two Cobra Attack
shifting overhead gantry cranes from West Bengal (India) to Illinois (USA) using the same freight combo as mentioned above [22].
CAL Cargo Airlines is another example of specialised airline in special cargo freighting by air, whether it is perishables, live animals, pharmaceuticals, dangerous goods, valuables, or oil and gas engines. In some of the cases, the temperature is critical in maintaining the properties of such products (this is a special characteristic of pharmaceuticals, live animals and perishables). The maximum payload is also an important attribute to consider when shipping an oversized or overweighed item like turbines, helicopters, yachts, electric poles, luxurious automobiles or Unmanned Aerial Vehicles (UAVs). Another unusual cargo that needs particular attention while being manoeuvred and transported are dangerous goods as they range from magnetic to radioactive, corrosive to explosive, flammable liquids to infectious substances; the handler needs to be certified to obtain the least amount of tarmac time3 possible[23].
Goods
The first ever goods market was the spice trade from as early as 3000 BC between Asia, Northeast Africa and Europe. Firstly made by camel caravans and later exchanged to sailing ship, there was an improvement in this trade between Europe and East Asia. Hundreds of years later steam-powered marine transportation enabled a faster connection between continents. Subsequently, it allowed the advancement of freight railways and refrigerators enabled the trade of frozen meats and dairy products globally.
The air transportation of perishable goods was the last type to enter this distribution market, and although it is important, mostly in long-distance markets (shipment of fresh flowers, seafood, and high valued tropical fruits), the share of volumes of air shipments of perishable goods are smaller when compared to the world production.
Figure 2.4 depicts the relation between product values and shelf life and relates it to the most appropriate means of transportation. Thus the fresher and more perishable the cargo the faster it needs to be shipped, so air transportation (nowadays made by aeroplane) is the preferred means of transportation. On the other hand, items with longer shelf life such as grains, root crops and some fruits are transported via ships; this leaves a gap for some fresh fruits and meats which find themselves in-between the spectrum of transportation, thus the consideration of airships as an answer to this problem.
Figure 2. 4 - Value, shelf life, and dominant transport modes in intercontinental movements of food products and ornamentals.
Source: [24] as cited by [25].
2.5 Airships
History Note
An airship is a “form of mechanically driven aircraft, lighter-than-air, having a means of controlling the direction of its motion” [26] as cited by [27:17].
The earliest stated events of this kind of “flight” include the Kongming lanterns from the Three Kingdoms Era. These events took place in China from 220-280 AD, and they were simple airborne hot air lanterns used for military signalling.
Airship shaped vehicles were employed in experiences like the one conducted by the Brazilian-Portuguese Jesuit priest and scientist Bartolomeu de Gusmão, in 1709, who is pointed out as the first airship builder. Though many opinions outside the Portuguese and Brazilian communities do not recognise this claim, his work was so remarkable that 75 years later it was used by the Montgolfier brothers; Étienne Montgolfier was the first human being ever to fly (although it was a tethered4 flight).
The first dirigible airship was built in 1856 by Henri Giffard (Figure 2.5); until then airships depended quite exclusively on climate conditions for steering. Almost half a century was spent in experiences until Alberto Santos-Dumont built and flew the “Number 6”, the first-ever gasoline propelled airship.
The creation of the first airline, in 1909, is as well due to airships; its name was Deutsche Luftschiffahrts-Aktiengesellschaft (DELAG), a German Airship Travel Corporation. As the World War I (WWI) just began, there was a burst of the airships business and construction. Mainly they were used for reconnaissance (playing over 1000 missions), even though soon there was the realisation that they were extremely vulnerable to ground fire at low altitudes and, therefore not crucial in a war scenario. Even so, they were still responsible for over 500 deaths in bombing raids all over Great Britain.
The WWI reaches its end, in 1918, and so do with the German military airships; nevertheless soon (one year later) the passengers’ transportation using airships began between Friedrichshafen and Berlin.
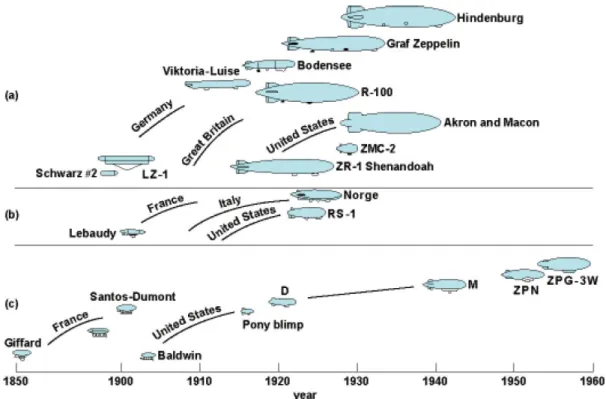
In 1929 the first long-awaited circumnavigation trip was completed, which took about 21 days. The world’s biggest and best-known airship, Hindenburg or LZ 129, unfortunately, crashed on May 6th, 1937 causing a total of 36 casualties, just one year after its first flight. This airship was being used as a transatlantic transporter, and the disaster was considered the end of airships. The biggest problem with this event was the fact that at that time, the gas used to fill the airships was hydrogen (highly flammable) instead of helium. Goodyear precisely did so since 1925, but the USA had the monopoly of the helium production since before the war. In the last decade of the XX century, the Zeppelin NT delivered a semi-rigid airship used mainly for aerial tourism, environmental research, and advertising purposes. In 2016 news was flooded about airships because Hybrid Airship Vehicles (HAV) developed the Airlander 10 (formerly a project for the USA military sector) that crashed against the floor in Bedfordshire during its second flight.
Figure 2. 5 - History of airships according to their type from 1850 until 1960 divided by structure types: rigid (a), semi-rigid (b) and non-rigid (c).
Types
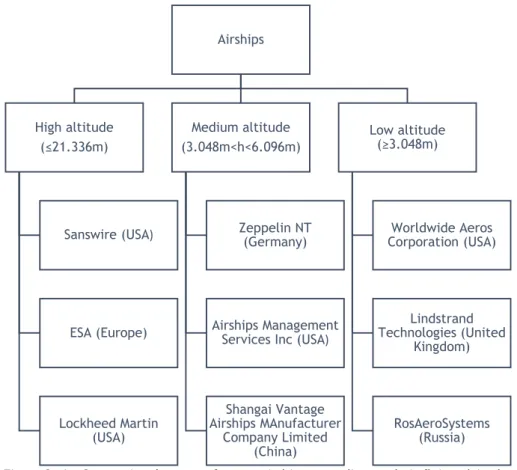
Airships can be classified regarding the altitude they can reach and the internal structure shape. According to its operation altitude, the airships will have different applicability as stated in Figure 2.6.
Figure 2. 6 – Companies that manufacture airships according to their flying altitude. Source: [29].
According to the internal structure, shape airships can be divided into three categories as depicted in Figure 2.7: rigid, semi-rigid and non-rigid.
Figure 2. 7 – Airships division according to their structure. Source: [29].
Rigid airships can keep their shape with the help of a full framework structure made of metallic spars and ribs; these will hold most loads placed in the airship instead of in the envelope, which makes the envelope’s material less likely to tear, thus providing more liability and fewer
Airships High altitude (≤21.336m) Sanswire (USA) ESA (Europe) Lockheed Martin (USA) Medium altitude (3.048m<h<6.096m) Zeppelin NT (Germany) Airships Management Services Inc (USA)
Shangai Vantage Airships MAnufacturer Company Limited (China) Low altitude (≥3.048m) Worldwide Aeros Corporation (USA) Lindstrand Technologies (United Kingdom) RosAeroSystems (Russia) Airships
chances of happening any accident. The main problem with this type of airship structure is the weight associated, alongside with the price and the complexity of the manufacturing process. Semi-rigid airships are the in-between class. They can be classified as the best of both worlds as they have structure and internal gas pressure keeping its shape. They have a rigid keel where the gondola, the fins (stabilisers) and the hull are usually attached. The usage of ballonets is necessary to control the internal pressure and thus it is possible to change the airship’s altitude as the gas bags inflate or deflate according to the pilot’s needs.
Non-rigid airships also referred to as blimps, have nothing but overpressure (made possible by gas inflation), keeping its shape. These are the less expensive and less time-consuming airships regarding production and manufacturing, but this simplicity also brings more safety issues since it is less trustworthy and more unstable. The “hot air” airships differ from the non-rigid ones as the inflating gas is heated air instead of helium or hydrogen.
Excluding the “hot air” airships all the others tend to use helium as inflating gas, mainly because helium is the second most lifting of the seven-gases considered (Figure 2.8). The hydrogen is a dangerous option as it is very flammable; hydrogen was the cause of several accidents like that of Hindenburg in late thirties [28].
Figure 2. 8 – Lifting gases comparison in its 100% purity state. Source: [28].
Application Examples
Nowadays perhaps amongst all the means of transportation, the airship seems to be the least mentioned one. However, some governments and companies appear to be interested in the advantages that these air vehicles can provide; the fact that every year new related projects keep arising is a clear sign that times are changing for airships. Looking at the following tables (Table 2.2, Table 2.3, and Table 2.4), we can deliver several reasons to be optimistic about the future of such a mean of transportation.
Table 2. 2 - Comparison between physical characteristics of different means of transportation. Source: [30].
Lorry Railway Ship Airplane Helicopter Airship
Cost of vehicle 2 4 4 5 3 3
Speed 2 3 2 5 4 4
Capacity 2 5 5 3 1 4
Range 2 3 5 4 3 4
Fuel consumption per km. 3 3 2 5 4 2
Infrastructure requirements 5 4 3 3 2 1
Green House Gases
requirements 4 2 1 5 5 2
Maintenance Cost 4 3 3 4 4 2
Life Time 2 4 4 3 3 4
Scale: 1- Very Low 2- Low 3- Medium 4- High 5- Very High
Table 2. 3 - Comparison between non-physical characteristics of different modes of transportation. Source: [31].
Lorry Railway Ship Airplane Helicopter Airship
Use in publicity 3 1 1 1 1 5 Reliability 2 3 3 5 2 4 Usability in urban areas 4 3 1 2 4 5 Number of competitors 5 2 3 2 4 1 Traffic 5 3 2 2 2 1 Noise pollution 5 3 1 2 2 1
Scale: 1- Very Low 2- Low 3- Medium 4- High 5- Very High
Table 2. 4 – Airship application scenarios, evaluated by the level of operational capacity. Source: [29].
Application Scenarios High Altitude Airship Medium Altitude
Airship Low Altitude Airship
Defence High Medium High
Anti-Ballistics Platform High Low Medium
Research and Data
Transmission High High High
Telecommunication High High High
Wireless Communications,
GPS, etc. High Medium High
Surveillance High High High
Monitoring High High High
Patrol Medium High Medium
Tourism and Publicity High Medium
Cargo and Passengers’
Transportation High Low
One of the first stated uses for airships, other than surveillance or weapons transportation, was aircraft carrying as done by USS Macon: this airship had a hook attached to its envelope that would hold up to five Curtiss F9C Sparrowhawk (a biplane fighter aircraft).
Another problem that can be solved with airships is the case of using a tethered aerostat to provide internet access to remote areas. A study was conducted by “having a central base village providing internet connectivity to neighbouring villages” [32:6] to test out if it was feasible technically and economically. The fact that the system would be relocatable, translates into far fewer installations required, and there is only the Archimedes Principle keeping its height (no additional energy supply required) [32].
In respect to tourism, a study was conducted in Portugal, where airborne eco-tourism between the city of Braga and the Parque Natural da Peneda-Gerês was considered proving its viability both technically (evidence of potential clients) and economically (ticket prices determined in comparison with alternative transportation means) [33].
Furthermore, another example of possible use of airships is as an alternative to communication satellites. In this case, airships will be transformed into high-altitude platforms, solar-powered, unmanned, and capable of long endurance missions (at least seven months). Companies like the American Sky Station International (Figure 2.9) and the British Advanced Technology Group have already started planning airships for these activities [34].
Figure 2. 9 – Sky Station platform proposal. Source: [34].
Nowadays CargoLifter offers airship-like solutions to problems such as [35]:
disaster-relief (an airship “costs a fraction of one helicopter and can be in operation for days”, and it can lift the debris from ruins of earthquakes, rescue people from trees and roofs and provide food, water, tents and medical care);
ship-to-shore transportation (when harbours are too small or too shallow, it aids in “unloading straight from the ship-to-shore at some point close to destination”); construction and renovation (airships can replace tower cranes when they are not tall
enough, or their maximum lifting power is inadequate to a company’s needs to, for instance, lift a beam); and
wind turbine transportation solution (a conventional wind turbine consists of a 65 meter and three 36 meter blades for a total of 164 tons, depicting how needless it would be road stretching and/or closing).
2.6 Conclusion
This chapter presents the most important studies and approaches to each concept included in the execution of this project.
The first present concept was business models (which also included business plans) stating its importance in the implementation of any new service, the suggestion given by [6] as it allows a practical and concise application.
The fact that transportation (mainly freight) has been increasing alongside with problems associated with it, has introduced the logistics concept which shed a light on the challenges faced by shippers and how market segments and stakeholders can heavily influence new logistics solutions.
One of those solutions can be using air transportation as an answer to logistics’ problems, therefore, a thorough research was made to understand what has been done so far in terms of goods’ transportation via air.
A different path in terms of the considered classic air transportation was followed and airships were found relevant, being that they are not a new concept a research regarding its different types and structures along with the existing applications of this technology and how it could fit the necessities of today’s logistics.
Linking all these concepts together is crucial to prove the feasibility of this project and what has been done or studied so far.
Chapter 3
Operational Performance and Cost Structure
Optimisation
3.1 Introduction
3.2 Travelling Salesman Problem Algorithm
3.3 Clarke and Wright Algorithm
3.1 Introduction
“Combinatorial analysis is the mathematical study of the arrangement, grouping, ordering, or selection of discrete objects, usually finite in number. Traditionally, combinatorialists have been concerned with questions of existence or of enumeration. That is, does a particular type of arrangement exist? Or, how many such arrangements are there?”[36:1].
The feature that distinguishes discrete or combinatorial optimisation from the linear one is that some variables are part of a discrete set, typically, a subset of integers. It is also known as integer and combinatorial programming [37].
The network analysis emerged as useful in formulating and solving operational research, for instance in communication network (railways, electrical energy, telephones, etc.), task planning and some production or distribution problems as the representation of a system through a network allows a better understanding of the correlations between its elements [38].
3.2 Travelling Salesman Problem
The Travelling Salesman Problem (TSP) considers a set of cities - in one of which the salesman leaves (city-based or depot). He must visit all the cities or a subset of them, and the goal is to optimise one or more objectives (as referred later) mainly the route (distance travelled or the associated costs). TSP is defined in directed and non-directed graphs [37].
There are different heuristics procedures to solve the TSPs: The Nearest Neighbour Rule (NNR);
The nearest insertion rule; The Lin’s r-optimal heuristic; Christofide’s Heuristic.
The NNR was chosen for this dissertation as it delivers the minimal distance travelled.
Formulation
Considering a complete directed or non-directed graph G=(N, A) being (N) a set of n vertexes and (A) a set of (m) arcs.
Let Cij be the cost or length associated with the arc (i,j) according to one’s needs (whether
there is the need to minimise cost or distance). The distance of the circuit is the sum of the lengths associated with the arcs:
𝑃𝐴 { min ∑ ∑ 𝑐𝑖𝑗𝑥𝑖𝑗 𝑛 𝑗=1 𝑛 𝑖=1 𝑠. 𝑡. ∑ 𝑥𝑖𝑗 𝑛 𝑖=1 = 1 ∀ 𝑗 ∈ 𝑁 ∑ 𝑥𝑖𝑗 𝑛 𝑗=1 = 1 ∀ 𝑖 ∈ 𝑁 𝑥𝑖𝑗 ∈ {0,1} ∀ 𝑖, 𝑗 ∈ 𝑁 (1) (2) (3) (4)
Xij must form a tour (5)
The last constraint can be written in one of the following forms:
∑ ∑ 𝑥𝑖𝑗 ≥ 1 ∀𝑆𝑡⊂ 𝑁 𝑗∈𝑆𝑡 𝑖∈𝑆𝑡 (5.a) ∑ ∑ 𝑥𝑖𝑗 ≤ |𝑆𝑡| − 1 ∀𝑆𝑡⊂ 𝑁 𝑗∈𝑆𝑡 𝑖∈𝑆𝑡 (5.b) ∑𝑖,𝑗∈𝛷𝑥𝑖𝑗 ≤ |𝑆𝑡| − 1 ∀𝑆𝑡⊂ 𝑁 𝑎𝑛𝑑 𝑎𝑙𝑙 𝛷 ∈ 𝜒(𝑆𝑡) (5.c) Thus,
𝑆𝑡= 𝑁 − 𝑆𝑡 and |𝑆𝑡| is the cardinality of 𝑆𝑡.
𝜒(𝑆𝑡) is the family of all Hamiltonian circuits of the induced sub-graph. Let 𝐾𝑡= (𝑆𝑡, 𝑆𝑡) be the set of arcs (i,j) with I ∈ 𝑆𝑡 and j ∈ 𝑆𝑡.
The (5a) constraint states that at least one arc in the TSP tour must belong to any arc-cut set 𝐾𝑡 of G.
Regarding the constraints (5.b) and (5.c) they are both the expressions of the fact that no sub tour through the subset of vertexes defined by 𝑆𝑡 can exist as part of the TSP solution.
The Nearest Neighbour Rule
When applying this rule, one must start with an arbitrary vertex and proceed to form a path by joining the vertex just added to its nearest neighbouring vertex (hence the name) which is not yet on the path, until all the vertexes are visited. In each case, the two end vertexes of the Hamiltonian path are joined to form the TSP solution. The following example illustrates a more practical application of the method.
Example
Considering five different cities with the distances in kilometres between them as represented in Figure 3.1.
Choosing, randomly, to place a depot in city 1, according to the Nearest Neighbour Rule one must check the closest distanced city - which is city 2.
Figure 3. 1 – Distances between cities. Source: own elaboration.
Then, starting from city 2 the next closest city would be city 4. When getting to city 4 the user faces a problem as both cities 3 and 5 are far from the same distance - 22 km. Therefore both hypothesis must be tested, thus dividing the route’s solution into two different ones as depicted in Figure 3.2.
In case 1, since the travelling salesman must attend all the cities and go back to the city-depot, he automatically goes to city 3 and returns from there to city 1. A total of 169 km is achieved.
Figure 3. 2 – Case 1 (left) and Case 2 (right). Source: own elaboration.
Following the rule above, in the case 2, from city 3 the salesman goes to city 5 and ends its path back to the depot. A total of 158 km is achieved.
Comparing the results obtained the most distance effective path is the one shown in Figure 3.3 as it is the one with less distance travelled; it is important to mention that the direction the path is travelled isn’t important as it is mathematically the same.
Figure 3. 3 – Solution for the placement of a depot in city 1 according to the TSP. Source: own elaboration.
Based on NNR it is necessary to experiment all the cities as depot-based to search for the best solution. Following we have the results for each one, including the related sub-routes:
Depot in 2: associated distances (in km) = 161, 169, 170, 158 Depot in 3: associated distances (in km) = 158, 158
Depot in 4: associated distances (in km) = 158, 156, 158 Depot in 5: associated distance (in km) = 156, 169
Analysing the results, a depot in cities 4 or 5 would be ideal as they represent the shortest path – 156 km. The final path is portrayed in Figure 3.4.
Figure 3. 4 – Final path when applied the TSP. Source: own elaboration.
3.3 Clarke and Wright Algorithm
Vehicle routing problems are concerned with the delivery of some commodities from one or more depots to some customer locations with known demand. Such problems arise in many physical systems dealing with distribution networks. For example, delivery of commodities such as mail, food, newspapers, etc.. The specific issue which rises is dependent upon the type of constraints and management objective [39].
A single commodity is to be distributed from a single depot to customers with known demand;
Each customer’s demand is served by one vehicle; Each vehicle has the same capacity and makes one trip;
The total distance travelled by each vehicle cannot exceed a specified limit; Each customer must be serviced within a specified time window;
The objective is to minimise the total distance travelled by all vehicles.
Formulation
K set of identical vehicles Qivehicles’ capacity
qjcargo
Pjdistribution points
P0depot/warehouse
Ci,jcost/distance between points (vertexes)
k vehicle
Considering an oriented graph G=(N, E) where N=C Ս {0,n+1} being the last part the vertexes that represent the warehouse and E={(i,j): i,j ∈ N, i≠j, j≠n+1} representing E the arcs associated with the connections between the vertexes.
x
ij{
1 if the vehicle k runs the (i,j) arc, ∀ k ∈ K, ∀ (i,j) ∈ E0 otherwiseNonetheless, if Qi ≥ ∑ 𝑞𝑗 the case is no longer a Clarke and Wright Algorithm one, if not a Travelling Salesman Problem instead.
The equations associated with the resolution of this algorithm are:
min ∑ ∑ 𝑐𝑖𝑗𝑥𝑖𝑗𝑘 (𝑖,𝑗)∈𝐸 𝑘∈𝐾 (6) ∑ ∑ 𝑥𝑖𝑗𝑘= 1, ∀ 𝑖 ∈ 𝐶 𝑗∈𝑁 𝑘∈𝐾 (7) ∑ 𝑑𝑖∑ 𝑥𝑖𝑗𝑘≤ 𝑄, ∀ 𝑘 ∈ 𝐾 𝑗∈𝑁 𝑖∈𝐶 (8) ∑ 𝑥𝑖ℎ𝑘− ∑ 𝑥ℎ𝑗𝑘= 0, ∀ ℎ ∈ 𝐶 𝑗∈𝑁 , ∀ 𝑘 ∈ 𝐾 𝑖∈𝑁 (9) ∑ 𝑥𝑖ℎ𝑘− ∑ 𝑥ℎ𝑗𝑘= 0, ∀ ℎ ∈ 𝐶, ∀ 𝑘 ∈ 𝐾 (10)