Characterization of the scour cavity evolution around a complex
bridge pier
Pedro Xavier Ramos
1, Ana Margarida Bento
1, Rodrigo Maia
1e João Pedro
Pêgo
11Civil Engineering Department, University of Porto – Faculty of Engineering, Porto,
Portugal and CIIMAR - Interdisciplinary Centre of Marine and Environmental Research
E-mail: [email protected]
Abstract
A study on the time development of local scour around a complex pier was developed using a small-scale model embedded in a sediment bed. A total of 15 laboratorial tests were performed at the Hydraulics Laboratory of the Faculty of Engineering of the University of Porto. The duration of each experiment was previously established to progressively characterize the scour cavity. After each experiment, the flume was gradually emptied to facilitate the application of close -range photogrammetry. The scour depth values resulting from the application of photogrammetry at the pile cap front agree well with the values obtained experimentally. The temporal development of the scour cavity is presented and discussed. Empirical formulas for the scour cavity time development and for the relation of scour depths to scour cavity volumes were obtained. The obtained three-dimensional models can also be used for calibration and validation of numerical models.
Keywords: Complex bridge pier; Local scour; Scour cavity; P hotogrammetry , Sediment transport
Introduction
Local scour around piers is the main cause of structural collapse of bridges, due to failure of piles foundations in riverbeds. In the recent decades, many researchers have
investigated the flow and the scour patterns around bridge piers.
A large number of studies focused essentially in the prediction of the scour depth in the base of piers (Breusers et al. 1977; Breusers and Raudkivi 1991; Melville and Coleman, 2000). These studies were mostly done by experimental means, resulting in semi-empirical equations for the evaluation of the maximum scour depth (Dargahi, 1990). For a better understanding of the flow field around piers, several researchers have studied the flow field around cylinders and piers (Dargahi, 1989; Graf and
Yulistiyanto, 1998; Ettema et al. 2006; Dey and Raykar, 2007). Most of the mentioned studies have only analysed the local scour around single piers. However, bridge design commonly leads to the consideration of complex pier foundations, most usually integrating a bottom pile on the top of a pile group, in which the direct application of the results derived from single piers is most often unreliable (Landers and Mueller, 1996). Researchers as Coleman (2005), Ataie-Ashtiani et al. (2010) and Moreno et al. (2012) have focused their studies on the prediction of the maximum scour depth around pile groups and complex piers.
The prediction of in situ scour at bridge piers using empirical formulas should be done with caution since they were derived mainly from small-scale laboratory
experiments. This led to the development of mathematical models capable of simulating the scouring process at bridge piers, known in the literature as Computational Fluid Dynamics (CFD) tools. Olsen and Melaaen (1993) developed a 3D model of scour around a circular single pier. A comparison with experimentally measured scour
patterns revealed good agreement. Tseng et al. (2000) performed 3D calculations of the flow around a vertical wall-mounted cylinder using large-eddy simulation (LES), validating the results against Dargahi’s (1989) experimental data. Abdelaziz (2011) simulated the flow and the sediment transport around a circular pier to compare with the
velocity fields and the topographic data experimentally obtained by Unger and Hager (2006).
For a well-calibrated numerical model, good experimental data is essential. To the authors’ knowledge, there are no detailed time measurements of the scour cavity geometry development in the vicinity of a complex pier (see Figure 1).
The main goal of the present study is the three-dimensional characterization of the scour evolution around a complex pier by close-range photogrammetric means. The application of photogrammetry in this field is still in the beginning (Rapp and Eder, 2012), but it has proved to provide reliable insights into the whole scour cavity geometry, leading to a deeper understanding of such phenomena. It has mostly been used to measure the scour cavity around single piers (Pfleger et al. 2010; Eder et al. 2011, Rapp et al. 2012). The proposed methodology will lead to an original
experimental dataset as well as a set of empirical relations of the scour patterns to be later used as a useful input for numerical simulations.
Experimental Setup
Experimental apparatus
The experiments were performed in a 32.2 m long and 1 m wide recirculation flume, located in the Hydraulics Laboratory of the Faculty of Engineering of the University of Porto (FEUP). Figure 2 illustrates a general longitudinal view of the experimental setup. The side-walls are made of glass to enable the visualization of the flow. The water is recirculated from a reservoir by means of a centrifugal pump group. The inflow discharge was manually regulated and controlled by means of two electromagnetic flowmeters at the channel entrance. In the upstream reach of the flume, some channel bed macrorugosities were designed to ensure a turbulent flow development. The flow
depth was adjusted by means of an electric gate at the downstream end of the flume. The approach flow velocity (u = 0.327 ms-1) was set to be 97% of the critical flow
velocity calculated by Neil’s formula (Neil, 1967). Therefore, a flow depth of 0.18 m and a flow discharge of 0.059 m3s-1 were imposed, guaranteeing clear-water flow
conditions for the experiments performed. The flume bottom was built upon the original concrete flume bottom in order to obtain two sediment boxes: one, to create a sand pit where the complex pier was installed and, the other one to create a sand trap where the eroded sediments were retained (both sediment boxes 0.35 m deep and 3.40 m long). The sand material was characterized by a median diameter, D50, of 0.86 mm, a
gradation coefficient of the sediment size distribution, σd, of 1.4 and a density, ρ, of
2650 kgm-3.
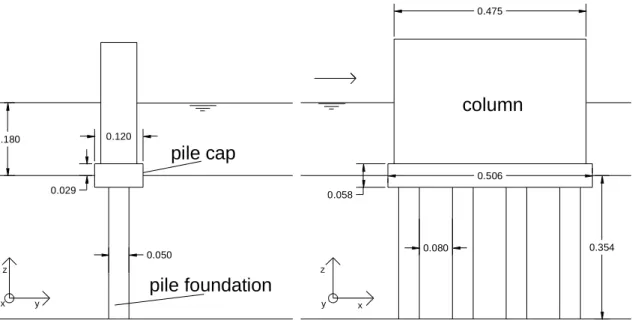
The geometric characteristics and the position relative to the initial river bed of the complex pier used in the performed experiments is depicted in Figure 3. The model was built for this purpose with the column and the pile cap made of acrylic glass and the four foundation piles of Polyvinyl chloride (PVC). The column and the pile cap have rounded edges. The studied pier was placed in the sand pit on the channel midplane and positioned in order to expose half of the pile cap height (0.029 m) to the flow current (the positive x-axis indicates the direction of the flow). In agreement with Teixeira (2013) the highest scour depths occurred for this configuration of the complex pier. According to Moreno et al. (2012), the contraction and wall effects were negligible to the scouring process, since ratios of B/Dpc ≥10 and B/h≥5 were guaranteed (B being the
flume width, Dpc the pile cap diameter and h the flow depth).
Experimental procedure
The experimental tests required the following previous steps: (i) installation of the complex pier; (ii) filling of the box pit with sand until the adjacent concrete bed level
was reached; (iii) coverage of the complex pier vicinity initial bed level area with thin geotextile, coupled to a metallic grid, to preclude undesirable scour at the beginning of the experiment; (iv) gradual opening of the valves until the desired water depth and inflow discharge was reached; and, (v) removal of the geotextile plaques with the aid of two lateral wires. Hence, the experiment was immediately initiated. In total, 15
experiments were performed to characterize the scour cavity evolution. Each test corresponded to a previously designated time duration, in accordance to pre-defined time steps of the scouring process. Before each experiment run, the sand bed was adjusted and levelled at 0.029 m above the pile cap bottom. In every experiment, the tridimensional reconstruction of the scour hole was performed after the flow was stopped and the flume was slowly made empty.
Experimental methodology
The objectives of this investigation included the measurement of the scour depths at different positions and the characterization of the scour cavity geometry. The former was performed by means of a limnimeter, enabling to measure the scour depth at the pile cap front (cross in Figure 4), and by reading off the scale attached to each individual foundation pile; the latter was possible by close-range photogrammetric means, enabling the quantification of the spatial distribution of scour around the complex pier components.
For the application of photogrammetry, the scour hole and the surrounding affected area were photographed with a single digital camera (Canon PowerShot SX 160 IS), successively positioned in different spots to cover the whole area of interest. To enable the spatial reference accomplishment, a set of ground control points (circles in Figure 4) was considered.
The camera captures were taken from a horizontal platform, relatively close to the sediment bed (at a distance of approximately 0.60 m), after each experiment. Due to the different duration of the experiments, the number of photos and the location of the ground control points were adjusted according to the areal extent and depth of the scour hole. The ground control points consisted in specific (and symmetrical) points on two lateral rulers (see Figure 4). The photogrammetric processing software, used in this research was Agisoft PhotoScan Professional, Version 1.0.4 (Agisoft 2014b).Unlike to traditional photogrammetry, this software neither requires the tridimensional location and orientation of the camera at image capture, nor the tridimensional location of the control points prior to the scene reconstruction. However, the control point coordinates are still required in post-processing to transform the model from relative to absolute coordinates (Westoby et al. 2012).
The digital elevation models (DEMs) were extracted and imported into Global Mapper (Version 15.0), a GIS Data processing software. The Global Mapper software allowed to perform the calculation of the bed elevation and the measurement of the scour cavity volume as well as to perform a comparison with the scour depths directly read in the laboratory.
Results and Discussion
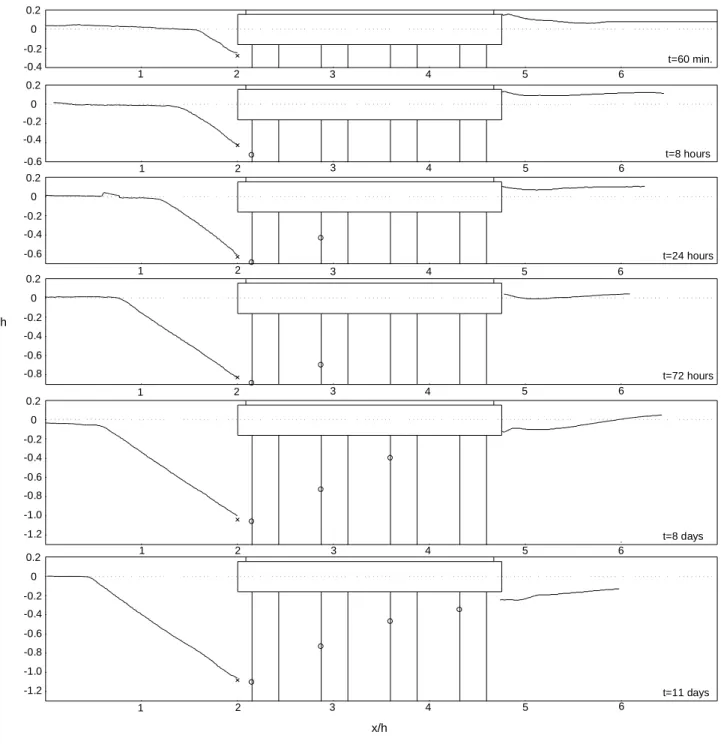
Figure 5 illustrates the development of the bed level configuration profiles along the centreline of the complex pier after 60 min., 8 hours, 24 hours, 72 hours, 8 days and 11 days., normalized by the flow depth (constant, h=0.18 m). These profiles were obtained by photogrammetry; the cross dots refer to the scour depth measured by the limnimeter (at the pile cap front, for each of the experiments) and the circle dots denote the scour depths obtained by means of reading the ruler scales at the foundation piles (when possible). Significant conclusions can be drawn from the analysis of the upstream
stretch of the bed profile time evolution (Figure 5) such as its maximum slope to compare with the angle of repose of the sand bed. The maximum slope of the upstream stretch reached a value of 74%, corresponding to an angle of 36.5°. This angle is about 20% higher than the typical value of 30° for wet sand. Researchers as Roulund et al. (2005) also reported that during the development of a scour cavity, some areas at the upstream side show higher local bed slopes than the angle of repose. Two main reasons were identified to explain this phenomenon: the backward flow at the base of the pile eroding the foot of the upstream slope of the scour cavity, and the continuous sediment supply of sediments into the scour cavity.
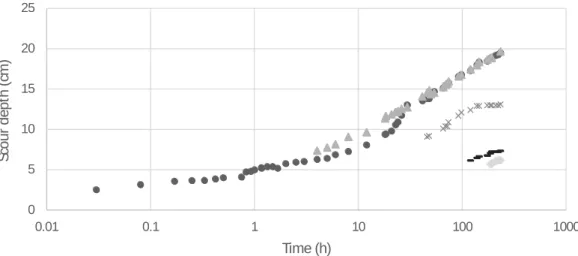
Regarding the time duration required for the series’ end experiment, the criterion of Melville and Chiew (1999) was used. It corresponds to the time at which the rate of increase of scour does not exceed 5% of the foundation pile length and the flow depth in a 24 hours period (in the present case, 0.05 m and 0.18 m, respectively). In the present case, the end scour stage was reached after 264 hours (11 days) with a maximum scour depth of 19.8 cm at the front of the first foundation pile (Figure 6). It should be referred that the foundation piles were numbered from upstream (pile 1) to downstream (pile 4). As stated before, only the scour measurements at the pile cap front could (and were) performed at the beginning of each experiment. The scour measurements at the foundation piles were only registered as soon as the process of the scour cavity
development reached the front of each of the piles, where a ruler was glued. A reduction of the scour depth rate after approximately 50 hours (pile 1 in Figure 6) may be
explained by a potential sliding of the upstream slope of the scour cavity. On the present study, the scour depths measured after eleven days were: 19.48 cm along the pile cap
front alignment, 19.8 cm at the first foundation pile front, 13.1 cm at the second and 7.5 cm and 6.2 cm at the third and fourth, respectively. This same
complex pier configuration had been studied by Teixeira (2013). This author computed the values suggested for this configuration by two scour depth prediction methods referenced in the literature, Richardson and Davis (2001) and FDT (2010). The former suggests a maximum scour depth of around 19.8 cm while the latter gives a value of 20.5 cm. These values are very close to the experimental ones obtained in this work. Figure 7 compares the scour depth temporal development for the end of the series experiment (duration = 11 days) with the scour depth achieved for each of the other (14) experiments (referred to as “other tests”), obtained by limnimeter
measurements and by means of photogrammetry at the pile cap front.
The graph suggests that the interruption of the experimental tests and the emptying of the flume (for the photogrammetry application) do not interfere with the scouring process since it yielded a good agreement between the three set of points represented in Figure 7.
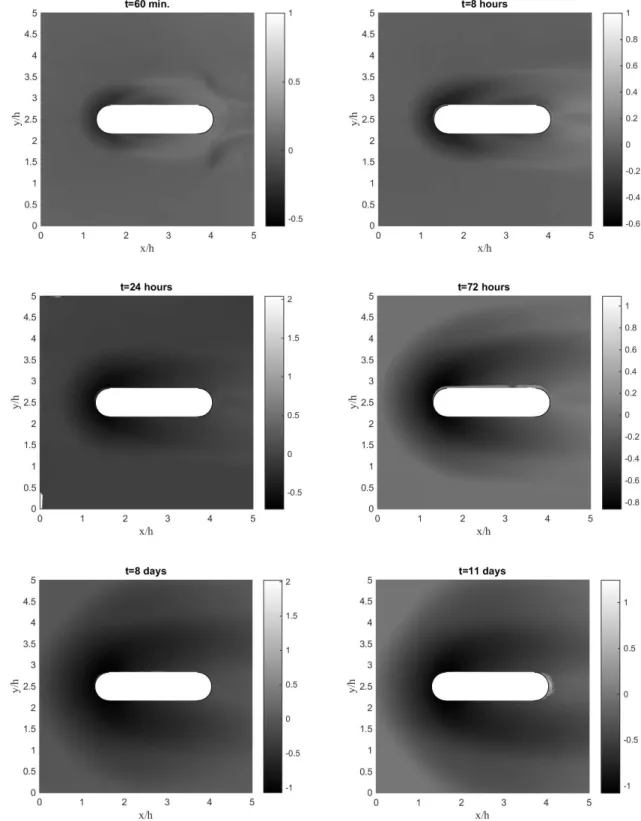
In order to study the generation and time evolution of the scour cavity, digital elevation models were produced after each experimental run and adequately treated. The corresponding graphs to the instants considered in Figure 5 are presented in Figure 8 as a function of bed elevation-to-flow depth ratio. The bed elevation with respect to the x-y-plane appears in a grey-scale range depending on the level of each point (normalized with the flow depth – h=0.18 m).
Although many studies were dedicated to investigate the temporal evolution of the scour depth in the vicinity of a complex pier, very few studies have addressed the three-dimensional characterization of the scour cavity. To achieve this goal, the digital elevation model results were used to compute the volume of the scour cavity. Figure 9 shows the cavity’s scour rate volume temporal evolution with respect to the time duration of the end of the series experiment (te=11 days).
As expected, considerable transport of sediments occurred during the first time steps of the scouring process (with scour rates of 63.4 and 54.4 cm3min-1, for the first
two points on the far left in Figure 9). Then, the scour rate decreased asymptotically to a value of 4 cm3min-1 at the final scour stage. The cavity’s volume scour rate (S) time
development data, represented in Figure 9, could fit with a high correlation coefficient (r2=0.9668) to an exponential function (Equation 1):
𝑆 = 𝜆 (𝑡
𝑡𝑒) −0.336
(1)
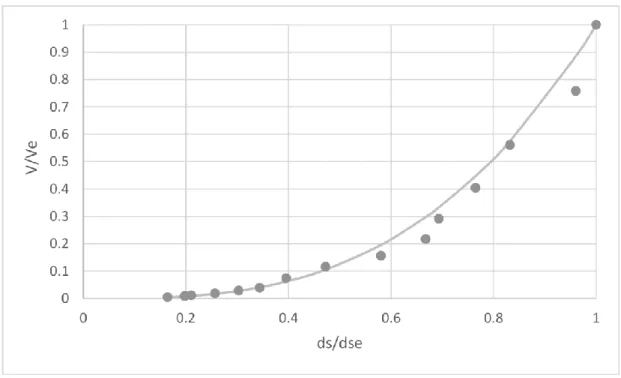
where λ assumes the value of 3.43 in the present study. Figure 10 shows the relation of the scoured cavity volume, V, with the maximum scoured depth, ds, at any scouring stage. These variables were normalized with respect to the corresponding end stage, Ve and dse. The curve, expressed by equation (2), confirms that the scoured volume is proportional to the power of 3 of the scour depth, as verified by many experiments. 𝑉 𝑉𝑒 = ( 𝑑𝑠 𝑑𝑠𝑒) 3 (2) From Figure 10, it is clear that the maximum scour depth approaches much faster the corresponding end stage than the cavity volume. The same parameters are plotted in Figure 11 with respect to the time normalized with the duration of the final series experiment (t/te); the corresponding graphs enhance the previous
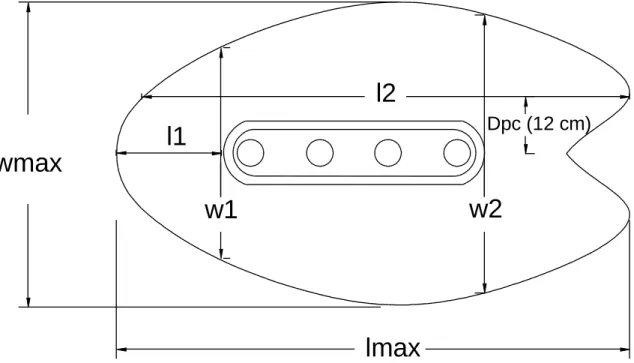
conclusion.Besides the scour cavity volume considerations another important analysis performed concerns the geometric characterization of the scour cavity. By the end of each experiment, for the scour cavity obtained, three different length and width measurements were conducted: four of them in specific locations (l1, l2, w1 and w2) and the other two at the locations where the maximum width and length occurred (lmax
with the typical cavity areal configuration; the corresponding values are presented in Table 1.
The analysis of Table 1 reveals that the shape of the cavity at the initial bed level surface (cavity “mouth”) varies very strongly in the first few hours of the scouring process, as expected. After a period corresponding to about 20% of the end experiment this pattern changes to an asymptotic behaviour. Although few similarities, a striking discrepancy between the time cavity “mouth” width and length characteristics does occur: while the length continues to grow with time, the width reaches much more rapidly a state of stability, with a value almost constant after 25% of the time
correspondent to the end experiment. This could be very helpful to define the area of influence of the scouring around a pier, in the direction transversal to the flow.
Conclusions
A set of 15 laboratory experiments were conducted to characterize the temporal
evolution of the scour cavity around a complex bridge pier. The analysis comprised the determination of the maximum scour depth and the geometric parameters of the scour cavity with close-range photogrammetric means, for determined instants.
The present paper proved that the interruption of the inlet flow and the gradual emptying of the flume after each run in order to enable the application of close-range photogrammetry, did not influence the scouring process significantly since it yielded good agreement. For each experiment, a direct but intrusive technique was also used, allowing the validation of the scour depth values obtained by photogrammetric means; a good agreement was found. The data derived from the successful implementation of the close-range photogrammetry revealed significant insights for an extensive
Empirical relations for sediment transport rates, scoured volume rates and scour depths were derived for the complex pier under study.
A complete dataset of the geometrical characteristics of the scour cavities was constructed, which will be a good basis for further investigations. Therefore, the study of scour around complex piers is still ongoing, being the next task the implementation of a numerical model to evaluate the same scour patterns here analysed. The numerical simulations will be validated and calibrated using the presented results.
Acknowledgements
This study was supported by the European Regional Development Fund (FEDER) through the funds of the Competitiveness Factors Operational Programme (COMPETE) and with national funds from the Portuguese Foundation for Science and Technology (FCT) under the project “Numerical and experimental study of the flow around complex bridge piers” [EXPL/ECM-HID/1663/2013].
The underlying research materials for this article can be accessed at web.fe.up.pt/ ∼ numpiers/.
References
Abdelaziz, A. A. 2011. Minimizing of scour downstream hydraulic structures [M.Sc. dissertation]. Benha: Benha University.
AgiSoft LLC. 2014b. Agisoft PhotoScan User Manual: Professional Edition, Version 0.9.0. Retrieved July 2, 2014.
Ataie-Ashtiani, B.; Baratian-Ghorghi, Z. and Beheshti, A. 2010. Experimental investigation of clear-water local scour of compound piers. J. Hydraul. Eng. 136 (6) 343– 351.
Breusers, H., Niccollet, G. and Shen, H. 1977. Local scour around cylindrical piles. J. Hydraul. Res. 15 (3) 211–252.
Breusers, H. and Raudkivi, A. 1991. Scouring: Volume 2, IAHR Hydraulic Design Manual, Rotterdam: Balkema.
Coleman, S. 2005. Clearwater local scour at complex piers, J. Hydraul. Eng. 131 (4) 330– 334.
Dargahi, B. 1989. The turbulent flow field around a circular cylinder. Exp. Fluids 8 1– 12.
Dargahi, B. 1990. Controlling mechanism of local scouring, J. Hydraul. Eng. 116 (10) 1197–1214.
Dey, S. and Raikar, R. 2007. Characteristics of horseshoe vortex in developing scour holes at piers, J. Hydraul. Eng. 133 (4) 399–413.
Eder, K., Rapp, C., Kohl, V., Hanrieder, B. and U. Stilla 2011. Photogrammetric monitoring of underwater erosion in the vicinity of cylindrical bridge piers . Munich: International Archives of the Photogrammetry, Remote Sensing and Spatial Information Sciences.
Ettema, R., Kirkil, G., & Muste, M. 2006. Similitude of large -scale turbulence in experiments on local scour at cylinders. Journal of Hydraulic Engineering,132(1), 33-40. FDT. 2010. Bridge Scour Manual. Florida: Florida Department of Transportation. Graf, W. and Yulistiyanto, B. 1998. Experiments on flow around a cylinder: the velocity and vorticity fields. J. Hydraul. Res. 36 (4) 637–653.
Landers, M. and Mueller, D. 1996. Channel scour at bridges in the United States. McLean, Virginia, Turner Fairbanks Hwy. Res. Ctr.
Melville, B.W. and Chiew, Y.M. 1999. Time scale for local scour at bridge piers. Journal of Hydraulic Engineering, AS CE, 125 (1), 59–65.
Melville, B.W. and Coleman, S. 2000. Bridge Scour. Colorado: Water Resources Publications LLC, Highlands Ranch, Colorado, USA.
Moreno, M., Maia, R., Couto L. and Cardoso. H. 2012. Evaluation of local scour depth around complex bridge piers. River Flow - International Conference on Fluvial Hydraulics, San Jose (Costa Rica).
Neil, C.R. 1967. Mean Velocity criterion for scour of coarse uniform bed material, Proceedings of the XII IAHR, Fort Collins, Colorado.
Olsen, N.R.B. and Melaan, M.C. 1993. “Three dimensional calculation of scour around cylinders”. J. Hyd. Eng., ASCE, 119(9), 1048-1054.
Pfleger, F., Rapp, C. and Manhart, M. (2010) Analysis of the temporal evolution of the sediment movement in the vicinity of a cylindrical bridge pier. In S. E. Burns, S.
K. Bhatia, C. M. C. Avila, and H.B.E. (Eds.), Proceedings to the Fifth International Conference on Scour and Erosion, San Francisco, pp. 658– 667. Geotechnical Special Publication No.210.
Rapp, C. and Eder, K. 2012. 3D determination of the sour evolution around a bridge pier by photogrammetric means. Proc. Int. Conf. River Flow 2012, 943-950, R.M. Munoz, eds.
Rapp, C., Eder, K. and Stilla, U. 2012. 3D determination of the scour evolution around a bridge pier by photogrammetric means. In R. Murillo, editor, Proceedings of the International Conference on Fluvial Hydraulics: River Flow, volume 2, pages 943 -950, San Jose, Costa Rica. Taylor and Francis Group, London. ISBN: 978-0-415-62129-8. Richardson, E. and Davis, S. 2001. Evaluating Scour at Bridge – Fourth Edition. Hydraulic Engineering Circular Nº18, Publication, Nº FHWA NHI 01 -001, U.S. Department of Transportation, USA.
Roulund, A., Sumer, B. M., Fredsøe, J., & Michelsen, J. 2005. Numerical and experimental investigation of flow and scour around a circular pile. Journal of Fluid Mechanics, 534, 351-401.
Teixeira, J. 2013. Modelação experimental de erosões localizadas junto de pilares complexos (Physical modelation of local scour near complex pier) [MSc Dissertation] Faculty of Engineering of University of Porto, Portugal.
Tseng, M.H., Yen, C.L. Song, C.C.S. 2000. Computation of three-dimensional flow around square and circular piers. Intl J. Numer. Methods Fluids 34, 207–227.
Unger, J., and Hager, W. H. 2006. Temporal flow evolution of sediment embedded circular bridge piers. River Flow 2006, 1, pp. 729-739, Taylor & Francis Group, London (U.K.).
Westoby, M.J., Brasington, J., Glasser, N. F., Hambrey, M. J. and Reynolds, J. M. 2012. ‘Structure-from-Motion’ photogrammetry: A low-cost, effective tool for geoscience applications. Geomorphology, 179(0), 300-314.
Table 1: Geometrical characterization of the scour cavities (dimensions in meters).
Test Duration w1 w2 wmax l1 l2 lmax
1 5 min. 0.224 - 0.229 0.054 0.092 0.180 2 10 min. 0.227 - 0.258 0.072 0.127 0.212 3 30 min. 0.236 - 0.280 0.089 0.170 0.267 4 60 min. 0.285 - 0.332 0.095 0.273 0.364 5 120 min. 0.295 - 0.369 0.101 0.321 0.524 6 4 h 0.320 - 0.378 0.104 0.376 0.487 7 8 h 0.305 0.200 0.420 0.120 0.460 0.598 8 12 h 0.410 0.400 0.447 0.140 0.612 0.561 9 24 h 0.452 0.450 0.492 0.165 0.674 0.627 10 36 h 0.523 0.495 0.584 0.183 0.775 0.682 11 48 h 0.540 0.550 0.618 0.204 0.905 0.853 12 72 h 0.653 0.750 0.752 0.223 0.995 0.888 13 5 d 0.695 0.760 0.791 0.248 1.020 0.953 14 8 d 0.845 0.850 0.946 0.275 1.222 1.020 15 11 d 0.860 0.960 1.000 0.285 1.470 1.503
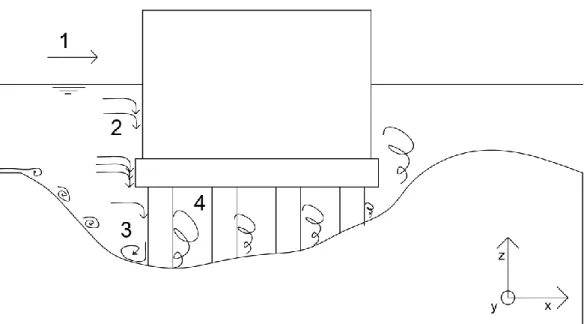
Figure 1:Flow pattern around a complex pier: 1- approach flow; 2 - downflow; 3 - horseshoe vortex; 4 - wake vortex (adapted from Moreno et al., 2012).
Figure 2: Side view of the experimental setup (dimensions in meters). flow direction
concrete sand pit sand trap
1.00
Figure 3: Geometric characteristics and position relative to the initial riverbed of the complex pier (dimensions in meters).
Figure 4: Scheme of the experimental data collection. Camera positions (square boxes), ground control points (circles) and limnimeter measuring point (cross).
0.029 0.050 0.475 0.506 0.120 0.058 0.080 column pile cap pile foundation z y x 0.180 z y x 0.354
Figure 5: Bed profile configuration time evolution along the complex pier centreline. 1 2 3 4 5 6 -0.2 0 0.2 -0.4 t=60 min. 1 2 3 4 5 6 -0.2 0 0.2 -0.4 t=8 hours -0.6 1 2 3 4 5 6 -0.2 0 0.2 -0.4 t=24 hours -0.6 1 2 3 4 5 6 -0.2 0 0.2 -0.4 t=72 hours -0.6 -0.8 1 2 3 4 5 6 -0.2 0 0.2 -0.4 t=8 days -0.6 -0.8 -1.0 -1.2 1 2 3 4 5 6 -0.2 0 0.2 -0.4 t=11 days -0.6 -0.8 -1.0 -1.2 x/h z/h
Figure 6: End experiment (11 days): Scour depth evolution at the pile cap front and at the piles front.
Figure 7: Comparison of the experimental approaches: scour depths at the pile cap.
0 5 10 15 20 25 0.01 0.1 1 10 100 1000 Sc o u r d e p th ( cm ) Time (h)
pile cap pile 1 pile 2 pile 3 pile 4
0 5 10 15 20 25 0.01 0.1 1 10 100 1000 Sc o u r d e p th ( cm ) Time (h)
series' end experiment
other series of tests, by means of limnimeter measurements other series of tests, by means of photogrammetry
Figure 9: Cavity’s volume scour rate time evolution.
Figure 11: Relation between maximum scour depth and volume rates to the end experiment.
Figure 12: Scheme of the typical scour cavity and characteristic geometric dimensions. 0 0.2 0.4 0.6 0.8 1 1.2 0.0001 0.001 0.01 0.1 1 t/te ds/dse V/Ve