Probabilistic control of HIV latency and transactivation
by the Tat gene circuit
Youfang Cao (曹又方)a,b,1,2, Xue Lei (雷雪)c, Ruy M. Ribeiroa,d, Alan S. Perelsona, and Jie Liang (梁杰)c,1
aTheoretical Biology and Biophysics, Los Alamos National Laboratory, Los Alamos, NM 87545;bCenter for Nonlinear Studies, Los Alamos National Laboratory, Los Alamos, NM 87545;cDepartment of Bioengineering, University of Illinois at Chicago, Chicago, IL 60607; anddLaboratório de Biomatemática, Faculdade de Medicina, Universidade de Lisboa, 1649–028 Lisboa, Portugal
Edited by Ken A. Dill, Stony Brook University, Stony Brook, NY, and approved October 24, 2018 (received for review July 6, 2018)
The reservoir of HIV latently infected cells is the major obstacle for eradication of HIV infection. The “shock-and-kill” strategy pro-posed earlier aims to reduce the reservoir by activating cells out of latency. While the intracellular HIV Tat gene circuit is known to play important roles in controlling latency and its transactivation in HIV-infected cells, the detailed control mechanisms are not well understood. Here we study the mechanism of probabilistic control of the latent and the transactivated cell phenotypes of HIV-infected cells. We reconstructed the probability landscape, which is the probability distribution of the Tat gene circuit states, by directly computing the exact solution of the underlying chemical master equation. Results show that the Tat circuit exhibits a clear bimodal probability landscape (i.e., there are two distinct proba-bility peaks, one associated with the latent cell phenotype and the other with the transactivated cell phenotype). We explore poten-tial modifications to reactions in the Tat gene circuit for more effective transactivation of latent cells (i.e., the shock-and-kill strategy). Our results suggest that enhancing Tat acetylation can dramatically increase Tat and viral production, while increasing the Tat–transactivation response binding affinity can transactivate latent cells more rapidly than other manipulations. Our results further explored the“block and lock” strategy toward a functional cure for HIV. Overall, our study demonstrates a general approach toward discovery of effective therapeutic strategies and drug-gable targets by examining control mechanisms of cell phenotype switching via exactly computed probability landscapes of reaction networks.
HIV
|
Tat circuit|
latency reversing|
gene regulation network|
probability landscapeH
IV infection is a global epidemic and currently over36 million people worldwide live with the virus (1). Present antiretroviral therapies (ARTs) can effectively suppress HIV viral replication by disrupting the viral life cycle at multiple stages. However, they do not eradicate HIV infection. The major barrier for complete eradication of HIV from the host is the reservoir of latently infected CD4+T cells. These cells are not recognized by the immune system and their persistence is not affected by ART. Latency transactivation is the process of transition from the latent state, in which HIV gene transcription is largely inactive, to the transactivated state with active HIV gene transcription and viral replication. Latent cells can sto-chastically transactivate to actively produce new virions, resulting in viral rebound once ART is interrupted. To eradicate HIV from the host, the latent reservoir must be eliminated.
The HIV latent reservoir is extremely stable, with an estimated half-life of ∼44 mo (2–4). Given the large number (>106) of latently infected cells within a host, it would take∼70 y for the loss of all latent cells, even if no new latently infected cells were generated due to the administration of ART (2, 3). The “shock-and-kill” strategy was proposed to eradicate the latent reservoir by activating latently infected cells using latency reversing agents (LRAs) (5–8), so they can be eliminated either by the immune system or by viral cytopathic cell death. However, recent clinical
trials and experiments with histone deacetylase inhibitor (HDACi)-based LRAs did not show effective reductions in the latent reservoir (5–8). Novel LRAs are needed for more effective activation and killing of latently infected cells.
To eliminate the HIV latent reservoir, it is important to un-derstand the mechanisms that control the stability of HIV la-tency, so strategies can be designed to destabilize latency and thereby help eliminate the latent reservoir. The latency of HIV-infected cells and their transactivation are stochastically con-trolled by the HIV Tat gene circuit (9–11). Tat, the trans-activator of transcription, is a critical regulatory protein encoded in the HIV genome and is under the control of a single HIV promoter, the LTR. The Tat gene circuit was experimentally found to be sufficient to generate bimodal phenotypes of latency and transactivation independent of the CD4+T cell resting state (9, 12). While circuits of genetic switches with bimodal control have been extensively studied in systems such asEscherichia coli (13) and phage lambda (14–17), the HIV Tat gene circuit is different. The Tat circuit consists of a single positive feedback loop and does not contain any double-negative feedbacks (9, 12). In addition, it exhibits no cooperativity (9, 12). Mathematical models have shown that simple positive feedback loops without cooperativity cannot maintain a stable off-state and therefore do not have deterministic bistability (18–20). However, it is well
Significance
The reservoir of HIV latently infected cells is the major obstacle for complete eradication of HIV infection. Latency and its transactivation in HIV-infected cells are controlled by the in-tracellular HIV Tat gene circuit. By reconstructing the proba-bility landscape of the circuit through exact solution of the underlying chemical master equation we examined the de-tailed mechanism of probabilistic intracellular control of la-tency and transactivation. We show that while the Tat circuit lacks deterministic bistability its probability landscape exhibits bimodality. Moreover, by exploring changes in the probability landscapes under different perturbations, our study suggests
effective therapeutic targets for strategies of“shock and kill”
to eliminate latently infected cells and“block and lock” to
en-force deep latency.
Author contributions: Y.C., R.M.R., A.S.P., and J.L. designed research; Y.C. and X.L. per-formed research; Y.C. and J.L. contributed new reagents/analytic tools; Y.C., X.L., R.M.R., A.S.P., and J.L. analyzed data; and Y.C., X.L., R.M.R., A.S.P., and J.L. wrote the paper. The authors declare no conflict of interest.
This article is a PNAS Direct Submission. Published under thePNAS license.
1To whom correspondence may be addressed. Email: [email protected] or jliang@
uic.edu.
2Present address: Quantitative Pharmacology and Pharmacometrics, Department of
Phar-macokinetics, Pharmacodynamics and Drug Metabolism, Merck & Co., Kenilworth, NJ 07033.
This article contains supporting information online atwww.pnas.org/lookup/suppl/doi:10. 1073/pnas.1811195115/-/DCSupplemental.
Published online November 19, 2018.
BIOPHYSIC S AND COMPUTAT IONAL BIOLOGY
known that bistability can be induced by stochasticity in small-volume systems, such as cells, (21–23) or by stochastic gene regulatory networks (9, 12, 20, 24–27), contrary to what is pre-dicted by corresponding deterministic models (e.g., based on mass action). How the bimodality of latency and transactivation is controlled through the Tat gene circuit and which reactions are the controlling ones remain unanswered questions.
Cell phenotypes are controlled by intracellular reaction net-works that are intrinsically stochastic. Understanding the regu-latory mechanism of cell phenotypes relies on effective models and efficient algorithms to predict the correct cell behavior from the underlying reaction networks. Accurate characterization of the probability landscape of intracellular reaction networks provides a powerful approach to study the probabilistic control and switching of cell phenotypes, and significant progress has been made in this field (14, 28–33). Here we systematically investigate the stochastic control of HIV latency and trans-activation by characterizing the full probability landscape of the Tat circuit under different conditions. This is achieved by directly solving the underlying chemical master equation (CME) using the accurate CME (ACME) method (14, 31–33). By taking ad-vantage of the strong coupling among reactions, the ACME method can dramatically reduce the size of the required state space and therefore allows exact computation of the probability landscapes with mathematically derived error bounds (32, 33) for many stochastic networks that were otherwise infeasible (14, 31– 33). Importantly, the rate of HIV phenotype switching between latency and transactivation can be accurately calculated using the ACME method (32, 33).
In this study, we first characterize the full probability land-scape of the wild-type HIV Tat circuit at steady state and then compute the landscapes with different model parameters to in-vestigate the stability and regulatory mechanisms that control the latency phenotype. We further identify potential therapeutic targets based on probability landscapes and compute phenotype switching rates for effectively reversing the latent state of HIV-infected cells and thereby facilitating depletion of the HIV latent reservoir.
Materials and Methods
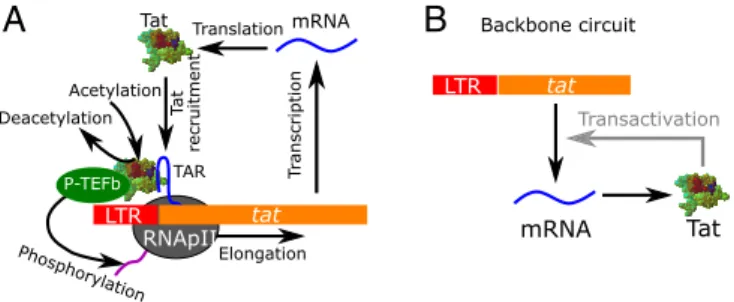
The reaction scheme of the HIV Tat gene circuit used in this study is shown in Fig. 1A (9, 11, 12, 34–36). The detailed reactions are listed inSI Appendix, Table S1. Among proteins encoded by the HIV genome, the Tat protein is essential for HIV production (11). In the absence of Tat, the basal tran-scription of HIV genes, including tat, can initiate from the LTR region but cannot elongate efficiently. Upon initiation, the RNA polymerase II tran-scription complex pauses at the promoter proximal location (11, 37–40). Further elongation only occurs at an extremely low basal transcription rate (kb0). The premature HIV mRNA fragment generated from the initiated
transcription forms the HIV transactivation response (TAR) element, which is a highly stable RNA stem–loop structure (41). When Tat is available, it binds the TAR element in the paused transcription complex at binding rate kbto
recruit the positive transcription elongation factor (P-TEFb), an essential host
transcription regulator in eukaryotes, to the paused transcription complex to form the Tat–TAR–P-TEFb (TTP) complex. The Tat protein in the TTP complex can be acetylated at lysines 25, 50, and 51 (42, 43) at rate kaand represented
as acTTP (SI Appendix, Table S1). After Tat acetylation, the P-TEFb complex is released to hyperphosphorylate the C-terminal domain of the RNA poly-merase II (44), so that the paused transcription complex can transition to productive elongation and a mature HIV mRNA can be synthesized at a transactivated rate kf. Tat is then released from the complex after
elonga-tion and is available for another cycle of transactivaelonga-tion. By recruiting P-TEFb to speed up transcription, the HIV Tat gene circuit forms a Tat-dependent positive feedback loop in the transactivation of HIV (Fig. 1B). In this circuit, Tat can be produced from two different modes: either from slow Tat-independent basal production or from rapid Tat-dependent transactivated production. These two modes have substantially different production rates of Tat, and implicitly of other HIV proteins. Values of parameters for the Tat circuit (SI Appendix, Table S1) were obtained from the literature. For those parameters with no accurate experimental measurements, we used values from previous modeling studies (9, 12, 24, 36) and complemented them with detailed exploration of the sensitivity of our results to the choice of these parameter values. Additional justifications for parameter choices and details of the ACME method can be found inSI Appendix.
Results
HIV Tat Circuit Exhibits Stochastic Bimodality of Latency and Activation.We computed the steady-state probability landscape of the HIV Tat circuit and projected it onto the 2D space of Tat mRNA and Tat protein (Fig. 2A, top view and Fig. 2B, side view). Our results show that the Tat circuit exhibits bimodality (i.e., has two distinct probability peaks) (Fig. 2). The first peak, which corresponds to latency, is located at zero copies of both Tat mRNA and Tat protein with a maximum probability of 0.98 (Fig. 2). The second peak located at 3 copies of mRNA and 93 copies of Tat protein, with a small peak probability of 3.2× 10⁻⁵ (Fig. 2), corresponds to the transactivated cell phenotype. We define the stochastic separatrix state as the state with the lowest probability between the two probability peaks. For the wild-type Tat circuit, the separatrix state has 1 copy of Tat mRNA and 34 copies of Tat protein (Fig. 2A, yellow square). For easier com-parison, we further project the probability landscape onto the 1D space of Tat protein copy number (SI Appendix, Fig. S1A), in which the separatrix state is at 16 copies of Tat protein (SI
Ap-pendix, Fig. S1A, dashed red line). The latency probability peak is
high, sharp, and narrow (Fig. 2B and SI Appendix, Fig. S1A), which explains the high stability of HIV latency. That is, once a cell is in latency, it is difficult to become spontaneously reac-tivated. In contrast, the peak of transactivation is very broad and shallow (Fig. 2A and SI Appendix, Fig. S1A); the variance-to-mean ratio for Tat copy number in transactivated cells with greater than 16 copies of Tat protein is calculated to be 29.
LTR tat mRNA Tat Transactivation LTR tat mRNA Tat RNApII Translation T ranscription Ta t recruitment TAR Acetylation Deacetylation Phosphorylation Elongation
A
B
Backbone circuit P-TEFbFig. 1. The HIV Tat circuit. (A) Detailed molecular interactions in the Tat gene circuit (SI Appendix, Table S1). (B) The backbone positive feedback logic in the Tat circuit.
0 2 4 6 8 10 0 1 00 200 mRNA Ta t
A
−10 −9 −8 −7 −6 −5 −4 −3 −2 −1 0 mRNA 0 2 4 6 8 Tat 0 50 100 150 200 250 log10 Prob . −8 −6 −4 −2 0 −10 −9 −8 −7 −6 −5 −4 −3B
Fig. 2. Bimodal steady-state probability landscape of HIV Tat circuit. (A) Top view of the 2D steady-state landscape. The contour lines show the proba-bility in log scale. The yellow triangle indicates the location of probaproba-bility peak of latency, the yellow circle indicates the location of the probability peak of activation, and the yellow square indicates the stochastic separatrix state. (B) Perspective view of the 2D steady-state landscape. The yellow tri-angle in the bottom left corner of A corresponds the high peak of latency shown in red in B.
Positive Feedback Is Essential for Transactivation. To study the contribution of the positive feedback loop in the control of HIV latency and transactivation, we first disrupted the positive feedback by blocking Tat–TAR binding, that is, by setting kb= 0 in the model,
and found that the probability peak of transactivation disappears (SI
Appendix, Figs. S1B and S2A). Although a small probability
shoul-der remains at around 20 copies of Tat protein, which suggests that it is still possible to transactivate from the latent state, however it may not be able to efficiently sustain transactivation events, where a large copy number of Tat protein may be required (SI Appendix,
Figs. S1B and S2A). This unimodal probability landscape suggests
that upon inhibition of Tat–TAR binding, latency is the only stable cell phenotype (SI Appendix, Figs. S1B and S2A). The effect of disrupting the positive feedback through blocking Tat acetylation (by settingka= 0) yields a probability landscape that exhibits the
same qualitative behavior (SI Appendix, Fig. S2B).
To further characterize the role of the positive feedback loop in the Tat circuit, we compare the behavior of the wild-type and the two differently perturbed circuits by examining their rates of transactivation from latency, rates of returning to latency from the activated state and their 95 percentile amplitudes of Tat copy number in activated cells. Detailed procedures for obtaining the phenotype switching rates are described inSI Appendix. While the Tat circuit is modeled in single cells, its steady-state probability landscape is the distribution of all possible cell phenotypes in a population of cells carrying the identical Tat circuit. Therefore, the computed rates correspond to the transition rates between the la-tent reservoir and the transactivated cell population.
The computed transactivation rate with the wild-type Tat circuit is 4.5× 10⁻⁴ d−1(SI Appendix, Table S2). For a population
of latently infected cells with identical parameters, this corre-sponds to a half-life of 51 mo (SI Appendix, Table S2). The rate corresponds to the occurrence of 450 independent Tat circuit transactivation events per day from a latent reservoir of size 106.
The rate of returning to latency is computed to be 0.065 per day
(SI Appendix, Table S2), which is 1,400-fold larger than the
la-tency transactivation rate and shows the low stability of the transactivated state. The rates are shown inSI Appendix, Table S1. The number of Tat circuit transactivation events per day not only depends on the transactivation rate but also on the size of the latent reservoir (SI Appendix, Table S1).
Compared with the wild-type Tat circuit, a Tat circuit without positive feedback would have much smaller latency trans-activation rates (3.4× 10⁵d−1, roughly 10-fold smaller than the
wild-type Tat circuit,SI Appendix, Table S2) with extremely long latent reservoir half-lives (SI Appendix, Table S2). The circuits also have a much higher rate of returning to latency and much smaller Tat copy numbers in transactivated cells (SI Appendix,
Table S2). Overall, these results show that the positive feedback
is essential in transactivating the Tat circuit in latently infected cells. Without positive feedback, the Tat circuit in latently in-fected cells cannot be effectively transactivated.
Tat Acetylation and Tat–TAR Binding Control Bimodal Phenotype.
Depending on parameters, the Tat circuit can exhibit three differ-ent types of probability landscapes at steady state: (i) unimodality at latency, which has a single probability peak at zero copies of Tat mRNA and protein, (ii) unimodality at transactivation, which has a single probability peak at nonzero copies of Tat mRNA and protein, and (iii) stochastic bimodality, which has two probability peaks, one at zero Tat copy number and the other at high Tat copy number. We study the effect of changing the rates of different reactions in the Tat circuit that may be potential drug targets to disrupt the bimodality and induce transactivation. We perturb the basal transcription rate (kb0), the nuclear import and export rates (keandki), the Tat–TAR
binding and unbinding rates (kbandku), and the Tat acetylation and
deacetylation rates (kaand kd). We examine the effect of
pertur-bations of these reactions on the steady-state probability landscape. Since perturbing the basal transcription rate does not eliminate the transactivation peak (SI Appendix, Fig. S3) and perturbing Tat mRNA export and Tat protein import does not eliminate the latency peak (SI Appendix, Figs. S4 and S5), we focus on the perturbations of Tat acetylation/deacetylation rates and Tat–TAR binding/unbinding rates. The results are summarized inSI Appendix, Table S3.
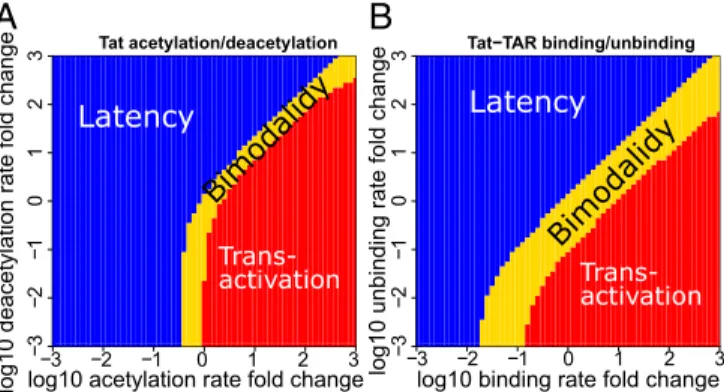
Perturbations of Tat acetylation/deacetylation rates and Tat– TAR binding/unbinding rates dramatically disrupt the bimodal probability landscape (SI Appendix, Figs. S6 and S7). When the Tat acetylation rate,ka, is large, or the deacetylation rate,kd, is
small, the Tat circuit exhibits only one probability peak at the transactivation state (red region in Fig. 3A andSI Appendix, Fig. S6). When the acetylation rate is small and the deacetylation is large, the Tat circuit exhibits only one probability peak at latency (blue region in Fig. 3A andSI Appendix, Fig. S6). Interestingly, between the regions of unimodal latency and unimodal trans-activation there is a narrow region in which the Tat circuit ex-hibits bimodality (yellow region in Fig. 3A) with the presence of probability peaks corresponding to latency and transactivation
(SI Appendix, Fig. S6). That is, both phenotypes are possible
under conditions defined by this narrow region. Perturbing the Tat–TAR binding and unbinding rates have similar effects (SI
Appendix, Fig. S7), but with a wider region of bimodality (Fig.
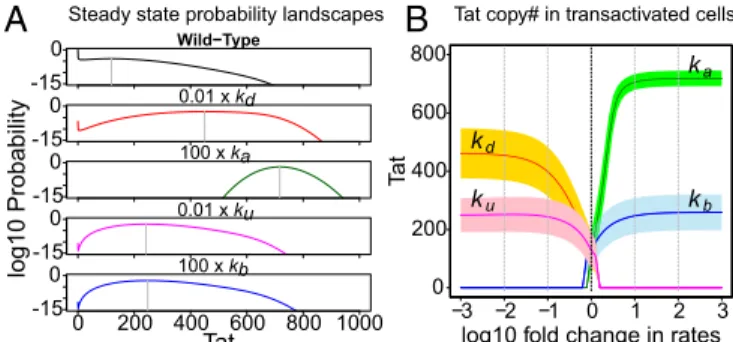
3B). In addition, perturbations in reactions can also change the shape of the probability landscapes. Increasing the Tat acetyla-tion rate can dramatically shift the peak of transactivaacetyla-tion to a much higher Tat copy number (SI Appendix, Fig. S6), while perturbing other parameters has little effect on the mode of the transactivation peak (SI Appendix, Figs. S3, S4, and S7).
Tat Acetylation and Tat–TAR Binding Control Intracellular Tat Copy Number and Transactivation Rate.We examined how Tat acetylation/ deacetylation and Tat–TAR binding/unbinding affect the pro-duction of Tat protein during latency transactivation. We first identified the peak of transactivation, which is separated from the peak of latency in the steady-state probability landscape by the stochastic separatrix (e.g., red dashed line inSI Appendix, Fig. S1A). The mean and variance of the Tat copy number in the trans-activation peak were calculated at different model conditions. Re-sults show that altering the Tat acetylation and deacetylation rates will result in a significantly larger mean copy number of Tat protein than altering the Tat–TAR binding/unbinding rates (Fig. 4 andSI
Appendix, Table S4), while both are larger than the wild-type Tat
−3− −2 −1 0 1 2 3 3 − 2 − 1 0123 Tat acetylation/deacetylation −3 −2 −1 0 1 2 3 − 3 − 2 − 1 0123 Tat−TAR binding/unbinding
Latency
Trans-activation Trans-activationBimodalidy
Latency
Bimodalidy
log10 binding rate fold change
log10 unbinding rate fold change
log10 acetylation rate fold change
log1 0 deacet ylat ion ra te fold chang e
A
B
Fig. 3. Phase diagrams of cell phenotypes when perturbing the Tat acety-lation/deacetylation rates and the Tat–TAR binding/unbinding rates. Distri-bution of unimodal and bimodal cell phenotypes in the Tat acetylation and deacetylation parameter space (A) and in the Tat–TAR binding and un-binding parameter space (B). Blue region: unimodality at latency. Red re-gion: unimodality at transactivation. Yellow rere-gion: stochastic bimodality with both latent and transactivated cell phenotypes possible.
BIOPHYSIC S AND COMPUTAT IONAL BIOLOGY
circuit. The variance of the Tat copy number at the transactivation peak is also altered.
The rate of latency transactivation and the rate of returning to latency can be significantly impacted by the rates of Tat acetylation/ deacetylation and Tat–TAR binding/unbinding. In comparison, de-creasing the Tat deacetylation rate is less effective in inde-creasing the latency transactivation rate than increasing the Tat–TAR binding rate. A 100-fold decrease in the Tat deacetylation rate only increases latency transactivation by 1.4-fold and reduces the half-life of the latent reservoir by 31% (SI Appendix, Fig. S8 and Table S4), whereas a 100-fold increase of the Tat–TAR binding rate can increase the rate of latency transactivation by about 1.8-fold and it reduces the half-life of the latent reservoir by 45% (SI Appendix, Fig. S8 and
Table S4). Additionally, the rate of returning to latency is
dramat-ically reduced by all four reaction perturbations, which makes la-tency transactivation almost irreversible (SI Appendix, Table S4). Discussion and Conclusions
Current ART can effectively suppress within-host HIV replication, but it does not eradicate HIV infection. The long-term persistence of the HIV latent reservoir forms the major barrier for the complete eradication of HIV. Latency transactivation is the process of tran-sition from the latent state, in which HIV gene transcription is largely inactive, to the transactivated state with active HIV gene transcription and viral replication. In the transactivated state la-tently infected cells can be killed by viral cytopathic effects or be recognized and killed by immune system effector cells. While the shock-and-kill strategy has been proposed to reduce the size of the latent reservoir, a shock using HDACi-based LRAs has so far failed to reduce the latent reservoir (5, 7, 8, 45, 46).
The intracellular Tat circuit is known to play an important role in controlling latency and its transactivation in HIV-infected cells (9–12, 47). However, it has not been targeted for latency reversal. In this study, we characterized the maintenance and the transition kinetics between the cellular phenotypes of latency and transactivation through computational modeling of the HIV Tat circuit. Using this model, we further identified potential targets in the Tat circuit for therapeutic interventions toward latency reversal. To simplify the model, we only consider spon-taneous transactivation of latently infected cells and not trans-activation due to antigen stimulation. We also assume latently infected cells have quiescent HIV transcription and thus do not express HIV epitopes that can lead to their recognition and death by immune-mediated mechanisms. As the transitions from latency to the activated state are rare events, for which simula-tion methods such as the Gillespie algorithm (48) are not ef-fective, quantifying the probabilistic behavior of the Tat circuit is
technically challenging. In this study, we directly computed the probability landscapes of the Tat circuit and the rate of latency transactivation using the ACME method (14, 31–33).
Our results revealed the probabilistic bimodal control mecha-nism of HIV latency and transactivation. Our results showed that the steady-state probability landscape of HIV-infected cells con-trolled by the Tat circuit can simultaneously exhibit two distinct probability peaks corresponding to latent and transactivated cell phenotypes. The latency peak is high and narrow, indicating a stable latent state. The transactivation peak is low and broad, in-dicating a less-stable state with a highly fluctuating copy number of Tat protein in transactivated cells. This high level of Tat fluctua-tion likely contributes to the observed large variability in the amount of HIV produced from activated cells (49). The stability of the latent state in the wild-type HIV Tat circuit is maintained by both the slow transition from the latent state to the transactivated state and the faster transition from the transactivated state back to the latent state (SI Appendix, Table S2).
Based on the computed latency transactivation rate, the computed 51-mo half-life of latent reservoir with identical wild-type Tat circuit parameters is close to the current estimate of ∼44 mo based on clinical data (3, 4). Hill et al. (50) estimated the frequency of successful transactivation from latent reservoir that lead to viral rebound after cessation of ART to be approximately four per day, whereas Pinkevych et al. (51) estimated the fre-quency to be one in every 5–8 d. Assuming 106latently infected
cells in the latent reservoir, that is, a total of 1011CD4+T cells in
a HIV-1–infected individual with 10 in a million being latently infected, our model predicts 450 independent Tat circuit trans-activations per day. The size of the latent reservoir can vary by orders of magnitude among patients and the frequency of pre-dicted transactivation events will then also vary (52). Following Tat circuit transactivation many other events need to occur be-fore viremia would be observed. An activated cell might die bebe-fore producing any virus or the virus released may be cleared before infecting another cell. Our model does not predict the frequency of successful transactivation events as in Hill et al. (50) and Pinkevych et al. (51); rather, it only predicts the number of events in which the Tat copy number exceeds a predefined threshold needed for transactivation. Therefore, the predicted Tat circuit transactivation frequency of 450 d−1 is necessarily greater than the frequency of successful transactivation that eventually led to viral rebound.
The transactivation rate was computed based on the trans-activation events from the wild-type Tat circuit without taking into consideration other factors, such as necessary host factors (53, 54), the organization and structure of chromatin (55–57), epigenetics and DNA and chromatin modification (56), and the metabolic state of the host cell (58). These factors are required but may not be available in latently infected resting memory CD4+ T cells for successful transactivation and viral replication. Thus, the actual rate of transactivation may be lower and the reservoir half-life longer than we estimated above. Moreover, antigen-induced activation of latently infected CD4+ T cells would be expected to shorten the half-life. Since these factors may affect the half-life of latent reservoir, a computation of half-life based solely on the Tat circuit may be inaccurate but is a necessary first step in gaining insight into the required processes and their kinetics.
We identified potential targets for therapeutic interventions toward reversing latency. While transactivation events occur in a probabilistic fashion, exact quantification of the probability landscape of the Tat circuit enables prediction of the effects of possible circuit modifications on the overall expected behavior of the cell. We set out to identify specific reactions in the circuit whose alteration can tilt the probability landscape in such a way that the HIV latent reservoir can be depleted more effectively.
Our results showed that perturbing Tat acetylation/deacetylation and the Tat–TAR binding/unbinding can effectively eliminate
-15 0 Wild−Type -15 0 -15 0 -15 0 0 200 400 600 800 1000 -15 0 Tat log10 Probability
Steady state probability landscapes
log10 fold change in rates
Ta t 0 200 400 600 800 −3 −2 −1 0 1 2 3 kd ku kb ka
Tat copy# in transactivated cells
0.01 x kd 100 x ka 0.01 x ku 100 x kb
A
B
Fig. 4. Effects of individual perturbations of four parameters to trans-activate the Tat circuit: Tat acetylation/deacetylation and Tat–TAR binding/ unbinding. (A) The steady-state probability landscapes of the Tat circuit for wild-type parameters and the four perturbations. (B) The steady-state Tat protein mean copy number and SD (shaded area) in transactivated cells when perturbing the four parameters.
latency or suppress the transactivation. To compare the effectiveness of manipulating these different reactions, we compared the mean intracellular Tat copy number in transactivated cells and the rate of latency transactivation at the same levels of change in the re-action rate. Our results suggest that both manipulations of Tat– TAR binding/unbinding and Tat acetylation/deacetylation can induce higher intracellular copy number of Tat protein than the wild-type Tat circuit in transactivated cells. However, the in-tracellular Tat copy number when manipulating Tat acetylation/ deacetylation can be much higher than when manipulating Tat– TAR binding/unbinding. Due to the role of Tat in transactivating HIV replication, higher intracellular Tat may lead to higher pro-duction of HIV proteins, which can help immune cells to target and destroy infected cells. However, high intracellular Tat may also induce higher production of HIV virions, which can further lead to reseeding of the HIV latent reservoir and compromise the effect of reservoir depletion, unless potent ART is given that can suppress nearly all de novo viral infection (59). While the intracellular Tat copy number is higher with Tat acetylation/deacetylation manipu-lations than with Tat–TAR binding/unbinding manipumanipu-lations, we found surprisingly that the latency transactivation rate with nipulations of Tat–TAR binding/unbinding is faster than with ma-nipulation of Tat acetylation/deacetylation. However, the lower intracellular Tat protein level in Tat–TAR binding/unbinding ma-nipulation may result in weaker immune response and cell killing rate in a shock-and-kill strategy. Therapies based on a combination of increase in Tat acetylation and Tat–TAR binding rates are likely to be more effective.
HDACis, such as vorinostat (60, 61), panobinostat (6), and romidepsin (62), have been tried as LRAs, though unsuccessful clinically (5, 7, 8, 62), due to their effects on opening chromatin structure and exposing HIV genes for active transcription. Since deacetylation of Tat is a critical step in the Tat circuit, deacetylase inhibitors can potentially affect Tat deacetylation (43, 63) and therefore directly interfere with Tat-mediated transactivation. Overall, to activate latently infected cells for shock and kill, our model suggests that if agents can be found to effectively and spe-cifically increase Tat acetylation rate and Tat–TAR binding rate to the same level as HDAC inhibitors do for the deacetylation rate they might be more effective LRAs than HDACis.
In addition to shock and kill, our results can also help evaluate the strategy toward a functional cure. The ability of long-term viral suppression after termination of ART provides an impor-tant treatment strategy alternative to eradication. Our model showed that transactivation of the Tat circuit can be strongly suppressed by disrupting the Tat positive feedback loop through inhibition of Tat acetylation or Tat–TAR binding to the degree that the activated cells are forced back into a“deep latent” state with a diminished transactivation rate. According to our model, the positive feedback loop is essential for the bimodal phenotype and effective transactivation. Several recently discovered small molecules might be able to block the positive feedback. For ex-ample, didehydro-cortistatin A (dCA) can strongly inhibit Tat– TAR binding (64–66). Neomycin can also inhibit Tat–TAR binding and increase the unbinding rate (67). A synthetic oli-gonucleotide complementary to the HIV-1 TAR RNA apical
stem–loop was also found to strongly inhibit Tat–TAR interaction (68). Our results showed that although complete removal of the positive feedback eliminates the distinct probability peak of transactivation from the probability landscape, the residual tail probability at large Tat copy number (SI Appendix, Fig. S1) may still support transactivation with low probability. Based on the probability landscapes, the model predicted the removal of posi-tive feedback reduces the latent cell transactivation rate by roughly 10-fold. For a host with a large (∼106) latent reservoir, a 10-fold reduction may not effectively suppress activation from latency. Hence, our model suggests one ought to be cautious about the effectiveness of“block and lock.”
Our study on the Tat circuit behavior in individual cells pro-vides important insights into understanding the intracellular probabilistic control of HIV latency. However, there are many factors beyond the Tat circuit that are not currently incorporated in this model. First, since we do not model intercellular inter-actions, such as new infections and viral replication; the current model only explains the behavior of an HIV latent reservoir with identical Tat circuit parameters in an ART-suppressed patient. Second, the toggling of the ON and OFF state of HIV promoter may also play a role in controlling the latency–transactivation bimodality (12, 24). Without explicitly modeling the ON/OFF toggling of HIV promoter, the interpretations of our model are bound to assumptions that either the HIV promoter is constantly turned on, or the slow promoter ON/OFF toggling is implicitly encoded in the slow basal transcription rate. Third, our model does not incorporate the constraining factors in resting memory CD4+T cells for maintaining the state of latency, which might be important since a large fraction of latently infected cells are resting memory CD4+ T cells (2, 69). Finally, the immune re-sponse against infected cells forms an additional layer of com-plexity for strategies such as shock and kill (70–72). These mechanisms all likely have important roles in the control of viral latency and transactivation. Incorporating these mechanisms in future modeling studies will lead to improved understanding of HIV latency and transactivation control.
Overall, our results showed that by studying the detailed in-tracellular transcriptional control of HIV latency and trans-activation one can discover more effective therapeutic targets from the underlying reaction network for HIV latency reversal. This approach can also be used to explore alternative strategies for an HIV cure, such as a functional cure based on the block-and-lock strategy (66) that attempts to enforce a state of“deep latency.” The ACME method provides a powerful approach for accurately studying the probabilistic behavior of cell phenotypes controlled by the underlying stochastic gene regulatory networks.
ACKNOWLEDGMENTS. We thank Drs. Rob de Boer, Leor S. Weinberger, Daniel I. S. Rosenbloom, and Brandon Razooky for their helpful comments. Part of this work was supported by US Department of Energy Contract DE-AC52-06NA25396. This work was also supported by NIH Grants CA204962, R35-GM127084, and GM126558 (to J.L.) and R01-AI028433 and R01-OD011095 (to A.S.P.). Y.C. was partially supported by the Center for Nonlinear Studies at the Los Alamos National Laboratory. This work used the Extreme Science and Engineering Discovery Environment, which is supported by National Science Foundation Grant ACI-1053575.
1. UNAIDS (2017) UNAIDS data 2017 (Joint United Nations Programme on HIV/AIDS, Geneva). Available at www.unaids.org/sites/default/files/media_asset/20170720_Data_book_2017_en.pdf. Accessed November 5, 2018.
2. Siliciano JD, et al. (2003) Long-term follow-up studies confirm the stability of the latent reservoir for HIV-1 in resting CD4+ T cells. Nat Med 9:727–728.
3. Siliciano JM, Siliciano RF (2015) The remarkable stability of the latent reservoir for HIV-1 in resting memory CD4+ T cells. J Infect Dis 212:1345–1347.
4. Crooks AM, et al. (2015) Precise quantitation of the latent HIV-1 reservoir: Implica-tions for eradication strategies. J Infect Dis 212:1361–1365.
5. Elliott JH, et al. (2014) Activation of HIV transcription with short-course vorinostat in HIV-infected patients on suppressive antiretroviral therapy. PLoS Pathog 10:e1004473. 6. Tsai P, et al. (2016) In vivo analysis of the effect of panobinostat on cell-associated HIV
RNA and DNA levels and latent HIV infection. Retrovirology 13:36.
7. Archin NM, et al. (2017) Interval dosing with the HDAC inhibitor vorinostat effectively reverses HIV latency. J Clin Invest 127:3126–3135.
8. Margolis DM, Archin NM (2017) Proviral latency, persistent human immunodeficiency virus infection, and the development of latency reversing agents. J Infect Dis 215(Suppl 3):S111–S118.
9. Weinberger LS, Burnett JC, Toettcher JE, Arkin AP, Schaffer DV (2005) Stochastic gene expression in a lentiviral positive-feedback loop: HIV-1 Tat fluctuations drive pheno-typic diversity. Cell 122:169–182.
10. Weinberger LS, Dar RD, Simpson ML (2008) Transient-mediated fate determination in a transcriptional circuit of HIV. Nat Genet 40:466–470.
11. Karn J (2011) The molecular biology of HIV latency: Breaking and restoring the Tat-dependent transcriptional circuit. Curr Opin HIV AIDS 6:4–11.
BIOPHYSIC S AND COMPUTAT IONAL BIOLOGY
12. Razooky BS, Pai A, Aull K, Rouzine IM, Weinberger LS (2015) A hardwired HIV latency program. Cell 160:990–1001.
13. Gardner TS, Cantor CR, Collins JJ (2000) Construction of a genetic toggle switch in Escherichia coli. Nature 403:339–342.
14. Cao Y, Lu HM, Liang J (2010) Probability landscape of heritable and robust epigenetic state of lysogeny in phage lambda. Proc Natl Acad Sci USA 107:18445–18450. 15. Arkin A, Ross J, McAdams HH (1998) Stochastic kinetic analysis of developmental
pathway bifurcation in phage lambda-infected Escherichia coli cells. Genetics 149: 1633–1648.
16. Aurell E, Brown S, Johanson J, Sneppen K (2002) Stability puzzles in phage lambda. Phys Rev E Stat Nonlin Soft Matter Phys 65:051914.
17. Zhu XM, Yin L, Hood L, Ao P (2004) Robustness, stability and efficiency of phage lambda genetic switch: Dynamical structure analysis. J Bioinform Comput Biol 2: 785–817.
18. Ferrell JE, Xiong W (2001) Bistability in cell signaling: How to make continuous pro-cesses discontinuous, and reversible propro-cesses irreversible. Chaos 11:227–236. 19. Ferrell JE, Jr (2002) Self-perpetuating states in signal transduction: Positive feedback,
double-negative feedback and bistability. Curr Opin Cell Biol 14:140–148. 20. Razooky BS, Weinberger LS (2011) Mapping the architecture of the HIV-1 Tat circuit:
A decision-making circuit that lacks bistability and exploits stochastic noise. Methods 53:68–77.
21. Qian H, Shi PZ, Xing J (2009) Stochastic bifurcation, slow fluctuations, and bistability as an origin of biochemical complexity. Phys Chem Chem Phys 11:4861–4870. 22. Bishop LM, Qian H (2010) Stochastic bistability and bifurcation in a mesoscopic
sig-naling system with autocatalytic kinase. Biophys J 98:1–11.
23. Zhang Y, Ge H, Qian H (November 11, 2010) van’t Hoff-Arrhenius analysis of meso-scopic and macromeso-scopic dynamics of simple biochemical systems: Stochastic vs. non-linear bistabilities. arXiv:1011.2554.
24. Razooky BS, et al. (2017) Nonlatching positive feedback enables robust bimodality by decoupling expression noise from the mean. PLoS Biol 15:e2000841.
25. Aull KH, Tanner EJ, Thomson M, Weinberger LS (2017) Transient thresholding: A mechanism enabling noncooperative transcriptional circuitry to form a switch. Biophys J 112:2428–2438.
26. Hornos JE, et al. (2005) Self-regulating gene: An exact solution. Phys Rev E Stat Nonlin Soft Matter Phys 72:051907.
27. Feng H, Han B, Wang J (2011) Adiabatic and non-adiabatic non-equilibrium stochastic dynamics of single regulating genes. J Phys Chem B 115:1254–1261.
28. Wang J, Xu L, Wang E (2008) Potential landscape and flux framework of non-equilibrium networks: Robustness, dissipation, and coherence of biochemical oscil-lations. Proc Natl Acad Sci USA 105:12271–12276.
29. Wang J, Zhang K, Wang E (2010) Kinetic paths, time scale, and underlying landscapes: A path integral framework to study global natures of nonequilibrium systems and networks. J Chem Phys 133:125103.
30. Wang J (2015) Landscape and flux theory of non-equilibrium dynamical systems with application to biology. Adv Phys 64:1–137.
31. Cao Y, Liang J (2008) Optimal enumeration of state space of finitely buffered sto-chastic molecular networks and exact computation of steady state landscape prob-ability. BMC Syst Biol 2:30.
32. Cao Y, Terebus A, Liang J (2016) Accurate chemical master equation solution using multi-finite buffers. Multiscale Model Simul 14:923–963.
33. Cao Y, Terebus A, Liang J (2016) State space truncation with quantified errors for accurate solutions to discrete chemical master equation. Bull Math Biol 78:617–661. 34. Reddy B, Yin J (1999) Quantitative intracellular kinetics of HIV type 1. AIDS Res Hum
Retroviruses 15:273–283.
35. Kim H, Yin J (2005) Robust growth of human immunodeficiency virus type 1 (HIV-1). Biophys J 89:2210–2221.
36. Althaus CL, De Boer RJ (2010) Intracellular transactivation of HIV can account for the decelerating decay of virus load during drug therapy. Mol Syst Biol 6:348. 37. Palangat M, Meier TI, Keene RG, Landick R (1998) Transcriptional pausing at+62 of
the HIV-1 nascent RNA modulates formation of the TAR RNA structure. Mol Cell 1: 1033–1042.
38. Rahl PB, et al. (2010) c-Myc regulates transcriptional pause release. Cell 141:432–445. 39. Kim YK, Mbonye U, Hokello J, Karn J (2011) T-cell receptor signaling enhances transcriptional elongation from latent HIV proviruses by activating P-TEFb through an ERK-dependent pathway. J Mol Biol 410:896–916.
40. Zhou Q, Li T, Price DH (2012) RNA polymerase II elongation control. Annu Rev Biochem 81:119–143.
41. Karn J, Stoltzfus CM (2012) Transcriptional and posttranscriptional regulation of HIV-1 gene expression. Cold Spring Harb Perspect Med 2:a0069HIV-16.
42. Kaehlcke K, et al. (2003) Acetylation of Tat defines a cyclinT1-independent step in HIV transactivation. Mol Cell 12:167–176.
43. Shirakawa K, Chavez L, Hakre S, Calvanese V, Verdin E (2013) Reactivation of latent HIV by histone deacetylase inhibitors. Trends Microbiol 21:277–285.
44. Phatnani HP, Greenleaf AL (2006) Phosphorylation and functions of the RNA poly-merase II CTD. Genes Dev 20:2922–2936.
45. Ke R, Lewin SR, Elliott JH, Perelson AS (2015) Modeling the effects of vorinostat in vivo reveals both transient and delayed HIV transcriptional activation and minimal killing of latently infected cells. PLoS Pathog 11:e1005237.
46. Rasmussen TA, Tolstrup M, Søgaard OS (2016) Reversal of latency as part of a cure for HIV-1. Trends Microbiol 24:90–97.
47. Yukl SA, et al. (2018) HIV latency in isolated patient CD4+T cells may be due to blocks in HIV transcriptional elongation, completion, and splicing. Sci Transl Med 10: eaap9927.
48. Gillespie DT (1977) Exact stochastic simulation of coupled chemical reactions. J Phys Chem 81:2340–2361.
49. Bui JK, Mellors JW, Cillo AR (2015) HIV-1 virion production from single inducible proviruses following T-cell activation ex vivo. J Virol 90:1673–1676.
50. Hill AL, Rosenbloom DI, Fu F, Nowak MA, Siliciano RF (2014) Predicting the outcomes of treatment to eradicate the latent reservoir for HIV-1. Proc Natl Acad Sci USA 111: 13475–13480.
51. Pinkevych M, et al. (2015) HIV reactivation from latency after treatment interruption occurs on average every 5-8 days–Implications for HIV remission. PLoS Pathog 11: e1005000.
52. Eriksson S, et al. (2013) Comparative analysis of measures of viral reservoirs in HIV-1 eradication studies. PLoS Pathog 9:e1003174.
53. Friedrich BM, et al. (2011) Host factors mediating HIV-1 replication. Virus Res 161: 101–114.
54. Bushman FD, et al. (2009) Host cell factors in HIV replication: meta-analysis of genome-wide studies. PLoS Pathog 5:e1000437.
55. Lusic M, Giacca M (2015) Regulation of HIV-1 latency by chromatin structure and nuclear architecture. J Mol Biol 427:688–694.
56. Lieberman PM (2016) Epigenetics and genetics of viral latency. Cell Host Microbe 19: 619–628.
57. Gürsoy G, Xu Y, Kenter AL, Liang J (2014) Spatial confinement is a major determinant of the folding landscape of human chromosomes. Nucleic Acids Res 42:8223–8230. 58. Palmer CS, Cherry CL, Sada-Ovalle I, Singh A, Crowe SM (2016) Glucose metabolism in
T cells and monocytes: New perspectives in HIV pathogenesis. EBioMedicine 6:31–41. 59. Conway JM, Perelson AS (2016) Residual viremia in treated HIV+ individuals. PLoS
Comput Biol 12:e1004677.
60. Archin NM, et al. (2012) Immediate antiviral therapy appears to restrict resting CD4+ cell HIV-1 infection without accelerating the decay of latent infection. Proc Natl Acad Sci USA 109:9523–9528.
61. Lucera MB, et al. (2014) The histone deacetylase inhibitor vorinostat (SAHA) increases the susceptibility of uninfected CD4+ T cells to HIV by increasing the kinetics and efficiency of postentry viral events. J Virol 88:10803–10812.
62. Søgaard OS, et al. (2015) The depsipeptide romidepsin reverses HIV-1 latency in vivo. PLoS Pathog 11:e1005142.
63. Lauffer BE, et al. (2013) Histone deacetylase (HDAC) inhibitor kinetic rate constants correlate with cellular histone acetylation but not transcription and cell viability. J Biol Chem 288:26926–26943.
64. Mousseau G, et al. (2012) An analog of the natural steroidal alkaloid cortistatin A potently suppresses Tat-dependent HIV transcription. Cell Host Microbe 12:97–108. 65. Mousseau G, et al. (2015) The Tat inhibitor didehydro-cortistatin A prevents HIV-1
reactivation from latency. MBio 6:e00465.
66. Kessing CF, et al. (2017) In vivo suppression of HIV rebound by didehydro-cortistatin A, a“block-and-lock” strategy for HIV-1 treatment. Cell Rep 21:600–611. 67. Wang S, Huber PW, Cui M, Czarnik AW, Mei HY (1998) Binding of neomycin to the
TAR element of HIV-1 RNA induces dissociation of Tat protein by an allosteric mechanism. Biochemistry 37:5549–5557.
68. Mestre B, et al. (1999) Oligonucleotide inhibition of the interaction of HIV-1 Tat protein with the trans-activation responsive region (TAR) of HIV RNA. Biochim Biophys Acta 1445:86–98.
69. Jaafoura S, et al. (2014) Progressive contraction of the latent HIV reservoir around a core of less-differentiated CD4+memory T cells. Nat Commun 5:5407.
70. Perelson AS, Ribeiro RM (2013) Modeling the within-host dynamics of HIV infection. BMC Biol 11:96.
71. Conway JM, Perelson AS (2015) Post-treatment control of HIV infection. Proc Natl Acad Sci USA 112:5467–5472.
72. Cao Y, Cartwright EK, Silvestri G, Perelson AS (2018) CD8+ lymphocyte control of SIV infection during antiretroviral therapy. PLoS Pathog 14:e1007350.