FACULDADE DE CIÊNCIAS
Departamento de Biologia Vegetal
Production of therapeutic Plasmid DNA by Lactic Acid Bacteria
Sílvia Marina de Jesus Andrade
DISSERTAÇÃO
MESTRADO EM BIOLOGIA MOLECULAR E GENÉTICA
FACULDADE DE CIÊNCIAS
Departamento de Biologia Vegetal
Production of therapeutic Plasmid DNA by Lactic Acid Bacteria
Sílvia Marina de Jesus Andrade
DISSERTAÇÃO
MESTRADO EM BIOLOGIA MOLECULAR E GENÉTICA
Orientadores:
Professora Dr.ª Helena Caria FCUL/BioFig
Professor Dr. Gabriel Monteiro IST
ii “O único bem é o conhecimento
e o único mal a ignorância.”
Sócrates (469-399 a.C)
iii AGRADECIMENTOS / ACKNOWLEDGMENTS
Primeiramente gostaria de agradecer à minha orientadora Professora Helena Caria pelo apoio e conselhos que me deu.
Ao meu co-orientador professor Gabriel Monteiro por me ter aceite neste projecto, dando-me a oportunidade de trabalhar num tema muito interessante, onde consegui aprender bastante e ter assim alguma experiência para investigação futura. Fico agradecida pela disponibilidade em me receber em todos os momentos, pelo apoio, pelos conhecimentos transmitidos, pelas opiniões e críticas construtivas. E também ao professor José Santos por estar envolvido neste novo projecto, e no qual me deram um incentivo.
Um dos agradecimentos mais importante vai para a Sofia Duarte, orientadora e amiga que sempre me ajudou desde o início, dando-me apoio, incentivo e partilhou comigo a sua experiência. Mesmo nos momentos mais dececionantes quando os resultados não eram conseguidos.
Gostaria de agradecer também a todos os membros do grupo MoBiol (BERG), e colegas de estágio, sempre foram muito simpáticos e prestáveis para comigo.
E um especial agradecimento à minha querida amiga Sara Rosa e ao Davide (sempre pronta para ajudar toda a gente, muito obrigada pelo apoio e pela ajuda). E também à Cláudia, Cátia (por me ter ajudado no ÄKTA, juntamente com a Sara Rosa), João Trabuco, Salomé, Jorge Paulo e Pedro. À nova estagiária Maria Martins que me auxiliou com uns últimos crescimentos.
Assim, como não poderia deixar de agradecer à Dona Rosa, sempre muito simpática com todos e ao Ricardo Pereira pela ajuda e paciência.
Estou certa que não seria bem-sucedida neste trabalho sem a pequena contribuição de todos.
Por último mas não menos importante, gostaria de agradecer à minha família e amigos que estiveram comigo nesta fase, especialmente à minha prima Marisa.
E claro ao Luís que sempre me incentivou e apoiou principalmente na fase mais stressante que é a da conclusão da tese. Muito obrigada por estares ao meu lado.
iv RESUMO
As vacinas baseadas em DNA plasmídico são uma alternativa mais segura relativamente às tradicionais, podendo ser estes vetores produzidos mais rapidamente e com maior facilidade no geral. Escherichia coli é o hospedeiro mais comum para a produção de vacinas de DNA. Contudo estas bactérias gram negativas possuem na sua membrana externa lipopolissacarídeos, uma endotoxina que se liga a um complexo de recetores CD14/TLR4/MD2, ativando a cascata do complemento e que resulta numa reação inflamatória grave. Assim, este trabalho pretende desenvolver uma alternativa mais segura para as vacinas de DNA em bactérias ácido lácticas uma vez que são comumente utilizadas na indústria alimentar, são consideradas como probióticos e usadas para a expressão de proteínas heterólogas.
O crescimento para duas estirpes (Lactococcus lactis LMG 19460 e Lactobacillus plantarum CCUG 61730) foi optimizado em pequena escala (crescimento em falcon), chegando-se à escala de 1 litro de cultura celular em condições anaeróbias. Para o processo de eletrotransformação só o baseado em NaCl foi eficiente para a transformação de L. lactis LMG 19460, não se tendo obtido transformantes para L. plantarum CCUG 61730. Neste trabalho construiu-se um plasmídeo modificado por alteração do Ribosome binding site (RBS) de forma a aumentar o número de cópias de plasmídeo em bactérias lácticas. A quantificação relativa do número de cópias do plasmídeo foi realizada por PCR em tempo real e como análise complementar utilizou-se a quantificação por absorvância a 260nm após purificação do plasmídeo. Embora haja alguma variação, parece existir um aumento do número de cópias do pTRKH3 em L. lactis LMG 19460 em 4 colónias. No entanto para outras colónias este aumento não foi tão evidente. A sequência modificada do RBS foi confirmada por sequenciação para os clones mais produtores e para os restantes. Finalmente, melhorou-se o rendimento de purificação (cerca de 3000%) dos plasmídeos adicionando 10mg/ml de lisozima durante o passo de lise celular.
Palavras chave: Bactérias ácido lácticas, vacinas de DNA, número de cópias de plasmídeo, Origens de Replicação, plasmídeo pTRKH3.
v
ABSTRACT
The vaccines based on plasmid DNA are a safer alternative to the traditional. In general plasmid vectors are produced more quickly and easier. Escherichia coli is the most common host strain for production of DNA vaccines. However, these gram-negative bacteria have lipopolysaccharides in the outer cell membrane, which acts as an endotoxin that binds to a complex of CD14/TLR4/MD2 receptors, activating the complement cascade resulting in a severe inflammatory reaction. This work aims to develop a safer alternative to DNA vaccines in Lactic Acid Bacteria since they are commonly used in the food industry, used as a probiotic and also for delivery of therapeutic proteins.
The process of growth at small scale has been optimized for strains Lactococcus lactis LMG 19460 and Lactobacillus plantarum CCUG 61730. It was also produced 1 liter in anaerobic conditions. Electrotransformation was achieved with NaCl method only for strain L. lactis LMG 19460. A modified plasmid DNA (pTRKH3) for vaccine with a change in Ribosome binding site (RBS) was produced, in order to increase the copy number of plasmid in Lactic Acid Bacteria. The relative quantification of plasmid copy number was performed by RT-PCR and by absorbance at 260nm after purification by miniprep as a complementary analysis. It was found in four clones of L. lactis LMG 19460 harbouring pTRKH3 an increased plasmid copy number. However, for other colonies this increase was not so evident. Cell disruption and purification process of plasmid DNA was obtained by alkaline lysis. It was achieved much higher amounts (3000%) of purified pDNA after addition of Lysozyme 10 mg / l to cell lysis.
Keywords: Lactic acid bacteria, DNA vaccines, plasmid copy number, origins of replication. Plasmid pTRKH3.
vi
LIST OF CONTENTS
Agradecimentos / Acknowledgments ... iii
Resumo ... iv
Abstract ... v
List of contents ... vi
List of figures ... viii
List of tables ... ix
List of abbreviations ... x
1. Background and goal ... 1
1.1 Specific purposes ... 1
2. State of the Art ... 1
2.1 Dna vaccines ... 1
2.2 Lipopolysaccharides ... 2
2.3 Lactic acid bacteria (LAB) ... 3
2.3.1 Applications in human health ... 4
2.3.2 Plasmids in LAB ... 5
2.4 Origins of Replication ... 5
2.4.1 Copy number control ... 5
2.4.2 Types of origin replication ... 6
2.4.3 Replicon pAMβ1 ... 7
2.5 Ribosome Binding Site ... 8
3. Materials and Methods ... 9
3.1 Bacterial strains and plasmids... 10
3.1.1 E. coli DH5α ... 10
3.1.2 DH5α Competent cells ... 10
3.1.3 Plasmid DNA pTRKH3 ... 10
3.1.4 Transformation DH5α with plasmid ... 11
3.1.5 Digestion pTRKH3 ... 11
3.2 Lactic Acid Bacteria ... 12
3.2.1 Cell growth optimization ... 12
3.2.2 Competent cells ... 12
Method 1 – g-sgmrs: ... 12
Method 2 – 10mm Dithiothreitol (DTT) and 100mm Lithium Acetate (LiAc) ... 13
Method 3 - 0.7 m Sodium Chloride (NaCl) ... 13
Method 4 - 8% Glycine... 13
3.2.3 Electroporation of L. lactis LMG 19460 and L. plantarum CCUG 61730 ... 13
vii
3.3.1 Site directed mutagenesis ... 14
3.3.2 Quantitative Real-time PCR assay ... 15
3.3.3 Colony PCR ... 16
4. Plasmid primary isolation ... 16
4.1 Alkaline lysis ... 16
4.2 Concentration and Clarification ... 17
4.3 Hydrophobic interaction chromatography (HIC) in Äkta 100 purifier system ... 17
4.4 Diafiltration -Amicon® ... 18
5. Results and Discussion ... 18
5.1 Optimization of the growth of LAB at small scale and bench scale ... 18
5.2 Constructions of sequences of RBS’s ... 20
5.3 Optimization of LAB transformation ... 21
5.4 Quantification of relative plasmid copy number ... 23
5.5 Complementary method to quantify copy number of pDNA by Miniprep ... 26
5.6 Cell lyses and Chromatography ... 26
6. Conclusion ... 29
7. Future perspectives ... 29
8. References ... 30
Attachments………. 34
Attachment 1 – TSS stock solution for DH5α competent cells ... 35
Attachment 2 – MRS broth Panreac® Cultimed ... 35
Attachment 3 - Others methods tested for Electroporation ... 35
Attachment 4 - Primers for site directed mutagenesis... 36
Attachment 5 - PCR programe for site directed mutagenesis ... 36
Attachment 6 – Assays LMG/pTRKH3 (wt) ... 36
Attachment 7 - Assays LMG/pTRKH3-RBS 4 ... 37
Attachment 8 – Calibration Curve RT-PCR ... 38
Attachment 9 - Agarose gel 1% - RT-PCR reaction ... 38
viii LIST OF FIGURES
Figure 1 - General chemical structure of bacterial lipopolysaccharides ... 3
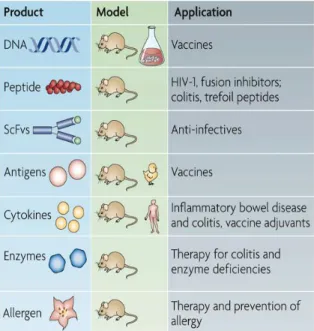
Figure 2 - Recent applications of LAB delivery systems ... 4
Figure 3 - ct-RNA based replication control ... 6
Figure 4 - Theta type replication ... 7
Figure 5 - Replicon pAMβ1 ... 7
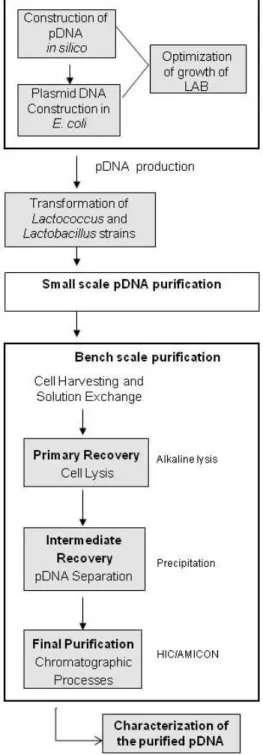
Figure 6 - Process overview - tasks and respective units operations ... 9
Figure 7 – Physical map of plasmid pTRKH3 and some restriction sites ... 11
Figure 8 - Growth curve of L. lactis LMG 19460 and L. plantarum CCUG 61730 harbouring or not pTRKH3 ... 19
Figure 9 - Specific growth rate of L. lactis LMG 19460 and L. plantarum CCUG 61730 ... 19
Figure 10 - Modification of RBS sequences in pTRKH3 ... 20
Figure 11 - Estimated copy number of pTRKH3 for different colonies ... 24
Figure 12 - Estimated copy number for various assays ... 25
Figure 13 – A: HPLC Chromatogram of pDNA sample from the original purification procedure B: Agarose gel electrophoresis 1% of the eluted fractions from a purification procedure ... 27
Figure 14 – A: Chromatogram from a purification procedure using lysozyme. B: Agarose gel analysis of the eluted fractions from a purification procedure with lysozyme ... 28
Figure 16 – Confirmation in 1% agarose gel electrophoresis of plasmid pTRKH3 in RT-PCR reaction ... 38
Figure 15 - Standard curve for the relative quantification of plasmid copy number. ... 38
ix
LIST OF TABLES
Table 1 - Examples of therapeutic molecules produced by recombinant LAB ... 5
Table 2 - Bacterial strains and plasmids ... 10
Table 3 - Cell number used in electrotransformation with NaCl method ... 14
Table 4 - Sequences RBS... 15
Table 5 - Results of electrotransformation ... 22
Table 6 - Estimated number of copies of pTRKH3 by Miniprep ... 26
Table 7 - Electroporation conditions of method 1 - G-SGMRS ... 35
Table 8 - Electroporation conditions of method 2 – DTT/LiAc... 35
Table 9 - Electroporation conditions of method 4 – 8% Glycine ... 36
Table 10 - Primers for site directed mutagenesis ... 36
Table 11 - Assays for RT-PCR - Overview of all cells banks LMG/pTRKH3 wt ... 36
Table 12 - Assays for RT-PCR - Overview of all cells banks LMG/pTRKH3 RBS 4 ... 37
x LIST OF ABBREVIATIONS
bp – Base pair Ct - Threshold cycle
Ct-RNA – Countertranscribed Ribonucleic acid DNA - Deoxyribonucleic acid
DTT – Dithiothreitol
GIT – Gastrointestinal tract
G-SGMRS – culture medium of competent cells containing Sucrose, Glycine, Glucose and Man Rogosa Sharp.
GRAS - Generally recognized as safe
HIC - Hydrophobic Interaction Chromatography LAB – Lactic Acid Bateria
LB – Luria Bertani LiAc - Lithium acetate LPS – Lypopolysaccharide MCS - multiple cloning site MRS – Man Rogosa Sharp
mRNA - Messenger ribonucleic acid dNTP - deoxynucleotide triphosphate EDTA - ethylene diamine tetra acetic acid oc – Open circular
O.D. 600nm – Optical Density read at 600nm
pDNA – plasmid DNA
PCR - polymerase chain reaction RNA – Ribonucleic acid
RT – PCR - Real time - polymerase chain reaction RC – Rolling circle
sc - Supercolied U.V – Ultraviolet
1 1. BACKGROUND AND GOAL
The goal of this work is to produce plasmid DNA (pDNA) by Lactic acid bacteria (LAB), to use as DNA vaccines.
Vaccines based on plasmid DNA are very promising tools both for the prevention of infectious diseases and for the treatment of acquired diseases. These vaccines have several advantages over traditional vaccines, namely the flexible genetic design, lack of infection risk and low cost of production in a microbial host [1]. These DNA vaccines are currently produced as plasmids in Escherichia coli. In this work, we propose an alternative GRAS (generally recognized as safe) host cell system for pDNA production: lactic acid bacteria. The established procedures for plasmid production and downstream processing were based in Escherichia coli [2] with some point modifications for LAB.
E. coli contains highly immunogenic lipopolysaccharides (LPS) that may be co-purified with pDNA [1]. In alternative, species of Lactococcus and Lactobacillus genera for pDNA production will be used [3] [4]. Lactic acid bacteria are widely used for the manufacturing of dairy products, being considered GRAS due to its non-invasive and non-pathogenic nature [5]. A major problem while using LAB for pDNA production is the low plasmid copy number which leads to low plasmid yields. In order to overcome this problem an increase in the number of copies of plasmid per cell will be developed in this work.
1.1 SPECIFICPURPOSES:
Production of a higher copy number of an engineered plasmid DNA, thus increasing the yield in the production of therapeutic molecules.
Optimization of the cell growth of LAB.
Optimization of electrocompetent LAB cells.
Adaptation of plasmid extraction, separation and purification, considering that LAB are quite different from E. coli.
2. STATE OF THE ART 2.1 DNA VACCINES
Vaccines based on plasmid DNA are an alternative for the prevention of infectious diseases (e.g. malaria, tuberculosis, HIV, and others) and the treatment of some autoimmune and cancer diseases [2]. This is only possible due to the ability to induce both humoral and cellular immune responses against antigens encoded by recombinant DNA. The administration of plasmid DNA provides an immune response, including the activation of
2 CD8+ and CD4+ T lymphocytes, which secrete cytokines and have a regulatory role in antibody production [6].
Bacterial plasmid vectors used as DNA vaccines are developed for expression of proteins in mammals cells. If compared to virus vector, plasmids vectors have higher safety, lower cost and are easy to produce [7]. There are some essential elements in the plasmids used as DNA vaccines, as a promoter and a polyadenylation signal (polyA) for expression in mammalian cells, a selection marker, a prokaryotic replication origin for plasmid amplification in bacteria [7]. The ColE1 bacterial origin of replication found in numerous plasmids pUC series derives from Escherichia coli. This origin of replication provides a high plasmid copy number, which allows getting larger amounts of purified plasmids.
The DNA vaccine is taken by Antigen-presenting cell (APC) or others tissue resident cells such as muscle cells or stromal cells. The DNA endocytosed by cells remains in the cell nucleus without being inserted into the host cell genome [6]. Several encoded antigens may be secreted into the extracellular space, and can stimulate B lymphocytes to produce specific antibodies as being endocytosed by other APCs. They produced cytokines such as IL-12 and as IFN-γ which may act on the target cell which carries the transgene expression. The IFN- γ is an important cytokine in modulating of B cells to secrete IgG2a (a specific antigen, present in many infections by microorganisms) [6] [8] .
E. coli is commonly used for the production of DNA vaccines, since it is an organism that it’s easy to grow at high densities [2], has a variety of cloning vectors and it’s physiology and genetic is well known. On the other hand, it has a high content of endotoxins like a LPS.
Thus arises, the need for safer host producers, such as LAB. Currently some studies have been made using these organisms for heterologous expression of proteins and as vehicles for delivery of DNA [5] [9] [10].
2.2 LIPOPOLYSACCHARIDES
The bacterial LPS are a component of outer membrane of the gram-negative bacteria, have a molecular mass of 10-20 kDa, and protect the bacterium against the action of bile salts and lipophilic antibiotics [11].
LPS are located in the exoplasmic leaflet of the outer membrane, acts as an endotoxin and are strong stimulators of the innate immunity response of a mammalian host, by acting as a potent activator of macrophages which induce them to release inflammatory cytokines such as, tumor necrosis factor (TNF) and interleukin (IL-1, IL-6 and IL-8). Excessive production of cytokines in response to LPS is regarded as the cause of septic shock in humans and also the failure of many organs until the patient's death [12] [13].
In general, the LPS is a large molecule constituent of an amphipathic lipid (lipid A) covalently linked to a hydrophilic polysaccharide [14].
3 The LPS structure (as shown in figure 1) represents the main surface antigen, is composed of an outer or distal segment, an O-chain or O-antigen, an outer core segment, an inner core segment, and finally,
the medial lipid A portion [13] [15]. It has been proven, in previous studies, that the lipid A is the endotoxic centre of the molecule [12] [14].
The O-antigen is composed by a sequence of repeating units of oligosaccharide, specific to each bacterial species and strains. The core region is an oligosaccharide containing characteristic sugar residues,
Kdo and heptose. However, chemical variation is more limited than that of O-antigen [16]. The E. coli type lipid A consists of one glucosamine disaccharide, two phosphates and six acyl groups [14] and shows a strong immuno-stimulating response [16].
What happens is Toll-like receptor 4 (TLR) in association with MD-2 is responsible for the recognition of LPS. The TLR is a type I transmembrane protein expressed on immune cells. This is a major signaling receptor of the innate immune system and recognizes a wide variety of microbial products. The LPS is transferred to TLR4-MD-2 by two accessory proteins, LPS-binding protein and CD14 [11] [14]. Thus, it activates the signaling cascade leading to the synthesis of inflammatory mediators, like cytokines. Thus, it can be differentially stimulated two pathways inflammatory responses. The myeloid differentiation primary response protein 88 (MYD88), leads to the production of pro-inflammatory cytokines. Whereas the less inflammatory TRIF pathway which stimulates the expression of interferon β (IFN β) and inducible genes that are important for adjuvanticity [11].
2.3 LACTIC ACID BACTERIA (LAB)
Lactic acid bacteria (LAB) are a group of non-pathogenic and non-invasive gram-positive bacteria, which occupy different ecological niches such as digestive tract of human and animals [5] [17]. There are several genera of LAB, classified by their morphological and physiological characteristics, include species of Lactobacillus, Leuconostoc, Pediococcus and Streptococcus [18]. Species of lactobacilli and streptococci are highly represented in different mucosal compartments of the human body [18]. These bacteria, which produce
Figure 1 - General chemical structure of bacterial
lipopolysaccharides: The portion Rough type LPS (R) do not contain
specific O-chain, semi-rough type (SR) just contain a repetitive unit of specific O-chain, and smooth type (S) contain two or more repetitive units of specific O-chain [15].
4 lactic acid as major product, are used in numerous fermentations processes of animal origin, and can be used either alone or together with other organisms [17].
In the last decades, LAB have demonstrated high interest as mucosal delivery vehicles. This follows from to achieve efficient strategies to deliver vaccine antigens, microbicides and therapeutics to the mucosal tissues [18]. It is considered as probiotics once “Live microorganisms which, when administered in adequate amounts, confer a health benefit on the host” [18]. Furthermore, provides some benefits as probiotics in human health, such as detoxifying carcinogens, enhancing immune response, metabolizing cholesterol, and others [19]. LAB are good candidates for the development of oral vectors, because some strains play an important role in maintaining intestinal
homeostasis and exert beneficial effects. They have the capacity to survive the passage through the gastrointestinal tract (GIT) and do it so makes these bacteria excellent candidates for mucosal targeting of therapeutic molecules [10]. In figure 2 summarizes the current applications of LAB, and the molecules which have been produced.
Lactobacillus genus can remain viable for a while in GIT. For example some strains of Lactobacillus plantarum, have probiotic effects with anti-inflammatory properties [20].
Also they can grow in the presence and absence of oxygen. Lactobacillus plantarum secretes antimicrobial compounds that inhibit pathogenic gram-positive and gram-negative
colonies from forming [21].Lactobacillus strains have a general beneficial effect and thus can be used for therapeutic purposes[22].
2.3.1 APPLICATIONS IN HUMAN HEALTH:
The capability to be administered by the mucosal way represents a significant advantage of the use of L. lactis based vectors. Mucosal surfaces (oral, intranasal, vaginal, or rectal) represent an important gateway for many pathogens [23]. In the table 1 shows some application by LAB and their benefits in human health.
Figure 2 - Recent applications of LAB delivery
systems: The single-chain variable fragments
(scFvs) molecule, could be used for different applications (therapy, anti-infectives or passive immunization). Not all of these potential applications have been published in the literature. [18]
5
Table 1 - Examples of therapeutic molecules produced by recombinant LAB
Applicability
in Disease Beneficial effects
Inflammatory Bowel Disease
Includes Crohn’s disease and ulcerative colitis. Recombinants LAB produce anti-inflammatory molecules, such as IL-10. Thus, their direct delivery to the intestinal mucosal and preventing their degradation by the high level proteolytic environment encountered in the GIT [22] [23].
Anti-Tumoral For example, in a colon rectal cancer, the LAB may reduce the risk by competitive exclusion of pathogenic bacteria involved in carcinogenesis. It also reduces the activity of procarcinogenic enzymes, such as β-glucuronidase [24].
Allergy L. lactis vectors showed anti-allergic properties for food allergens in mouse as an animal model [23].
Anti-Viral The Interferon-omega (IFN-ω) produced by L. lactis is effective on enteric viral infections [23].
Body Weight and Obesity
The engineered L. lactis expressing epidermal growth factor (EGF) was proposed to have applications in dietary supplements for children during weaning when intestinal development is most required [23].
2.3.2 PLASMIDS IN LAB:
Several lactic acid bacteria harbor cryptic plasmids (1.5 to >30 kb in size), which potentially can serve as vectors [25] [26]. Although most lactobacilli plasmids are smaller than 10kb, is known that some plasmids can be larger until 150kb [19].
A few known plasmids may encode important traits such as resistance to phages or antibiotics, lactose catabolism, production of proteolytic enzymes and encoding different bacteriocins [25] [27]. Many of these plasmids are not yet characterized and future may bring new information to other molecules which may also be engineered for the development of cloning and expression vectors.
Several Lactobacillus species often harbor a number of these plasmids and DNA sequence analysis has revealed that they replicate a rolling circle replication (RCR) mechanism, and also theta mechanism [25] [26].
2.4 ORIGINS OF REPLICATION: 2.4.1 COPY NUMBER CONTROL
Bacterial plasmids replicate autonomously and may bring benefits to the host, such as drug resistance or metabolic pathways. Several resistant natural plasmids have been report to carry virulence factors, such as bacteriocins, siderophores, cytotoxins, or adhesion factors and virulence plasmids have been described to carry resistance genes [28].
The origin of replication determines the plasmid copy number, and their stability is affected by copy number. A positive effect of a high copy number is the greater stability of the plasmid. On the other hand, a high number of plasmid copies generally decrease the growth rate, thus possibly allowing for cells with few plasmids to dominate the culture, once
6 they grow faster. Plasmids that utilize the same replication system cannot co-exist in the same bacterial cell, may exist incompatibility [29].
Thus, there are two basic systems which control the copy number of the plasmid, depending on the type of negative control component used:
directly repeated sequences (iterons) that complex with cognate replication (Rep) initiator proteins;
antisense RNAs that hybridize to a complementary region of an essential RNA, therefore termed countertranscribed (ct) RNAs [29] [30].
In this last case the ctRNA binds to its complimentary RNA (necessary for plasmid replication), inhibiting (directly or indirectly) replication of the plasmid, (as shown in figure 3). This inhibitory ctRNA is synthesized at a higher rate than that of the essential RNA, although having a short half-life. This happens because the ctRNA is transcribed by a constitutive promoter, and its intracellular concentration is proportional to plasmid copy number [28] [29]. The ctRNAs can regulate plasmid copy number (either alone or with the help of proteins).
Thus, it may be involved in a variety of mechanisms including inhibition of primer maturation,
inhibition of translation of the essential Rep protein, transcriptional attenuation, or inhibition of pseudo knot formation [29].The interaction in ctRNA and mRNA promotes formation of the terminator and thus can lead to premature termination of Rep mRNA synthesis [31].
2.4.2 TYPES OF ORIGIN REPLICATION
Plasmids DNA replicate using two modes, as RCR and theta mechanism. In most RCR plasmids, transcription of the initiator gene and leadingstrand replication proceed in the same direction. The RCR derived plasmids may not be suitable for the cloning of some genes, such as large genes or genes with high GC content, but they are generally high-copy-number plasmids (50 copies/cell) and usually contain a pSH71-based replicon (with repC and repA genes, from Lactococcus lactis) [3] [4], which encodes a replication initiation protein [19]. To overcome this problem it can be used theta replicating plasmids, which are structurally and segregationally more stable than RCR plasmids, and can hold larger DNA inserts [5] [32].
For example, pAMβ1 replicon based plasmids that contain regulated rep genes [33]. In a study, the spac-I promoter upstream of ORF E was inserted and this plasmid pAMβ1spac replicated efficiently resulting in about 100 plasmids copies/cell in Bacillus subtilis [34].
Figure 3 - ct-RNA based replication
7 Three classes of theta replicating plasmids are known and designated A, B, and C. Class A includes plasmids which encode a replication protein (Rep) and have a characteristic replication origin, designated ori A [34]. The figure 4 represents the theta mechanism of replication. The origin of replication has a unique
nucleotide sequence necessary for replication of the DNA molecule. DNA replication is initiated at the origin (ORI) and continues in both directions around the circular molecule, as the growth forks move merge and two daughter molecules are produced [35]. For cloning in Lactococcus lactis, several studies have shown that the theta type plasmid have more stable segregation then the RCR type plasmid [36].
2.4.3 REPLICON pAMβ1
The pAMβ1 plasmid was initially isolated from Enterococus faecalis, is a low copy number and the replication is of unidirectional theta [37]. A lot of plasmids that were isolated from streptococci and enterococci have much similarity with pAMβ1 replicon. This initial mechanism involved Rep protein, the origin and the host encoded DNA polymerase I [31]. The initiation of leading strand synthesis occurs within a -44 bp origin located immediately downstream of the Rep gene [31].
A few elements are involved in this control, and are located within a -1 kb segment mapping upstream of the RepE open reading frame (ORF). The repE gene coding for a replication protein of 57-kDa [34]. This region is responsible for the copy-control, as shown in Figure 5. The synthesis of RepE is strongly controlled, because it is rate limiting for replication. It contains two ORFs, D and F, located on the same strand as RepE, and an intergenic region of -350 bp carrying two major promoters (PDE and PCT) and two
rho-independent transcription terminators (TDE and TCT) [31] [37].
Figure 4 - Theta type replication [35]
8 It was shown on earlier studies that the PDE promoter is required for transcription of
the ORF D and REP E gene. However, RepD is not necessary for replication and its function remains unknow [38]. Nevertheless, the PCT directs synthesis of a small countertranscript
RNA (CT-RNA), complementary to the non-coding region of the ORF D repE mRNA [31] [37]. The terminator (TDE) inhibits transcription initiated in the PDE, so, like the other
terminator (TCT) inhibits transcription of the PCT [37].
Based on previous experiments, one can confirm that, TDE is active and is a key element
in the negative regulation of PDE directed transcription [37] [31].
In previous studies it was verified that CopF negatively regulates pAMβ1 replication by binding to an operator which is located immediately downstream of the copF gene [37]. Thus, the CopF acts as a repressor of the RepE promoter. To test that CopF negatively regulates pAMβ1 copy number, by repressing RepE transcription,a few experiments were done and was carried out a deletion a upstream KpnI restriction site. So, as consequence enabled a slight increase of copies of plasmid [37]. It was also observed which mutations in the PCT promoter or in the transcription terminator (TCT), had no effect on CopF mediated
regulation and did not affect the activity of the promoter and terminator of the countertranscript (PCT and TCT) [31]. These experiments showed that CopF acts
independently of the attenuation system and they also observed that, CopF mediated regulation, does not require ORF D. Thus, the countertranscript-driven attenuation mechanism in conjuction with CopF regulatory system repress 100-fold the transcription of the repE gene [31].
2.5 RIBOSOME BINDING SITE
Every bacterial mRNA has a ribosome binding site (RBS), for producing polypeptide product. The RBS is a sequence upstream of the start codon where the ribosome binds to the mRNA to begin its the translation of the mRNA into a protein [39]. In prokaryotic cells the ribosome binding site is denominated Shine Dalgarno sequence (SD) [40].
Although transcript properties such as mRNA stability and codon usage are known to influence microbial translation, initiation is often the rate-limiting step in translation [41]. It has been verified the distance between the SD sequence and the initiation codon affects the translation [40]. It have been identified a number of sequence specific with characteristics that can decrease translation initiation rates, and therefore result in low expression levels [42]. The presence of secondary structure in the 5’ region of the mRNA can limit translation due to sequestration of the 16S hybridization region (SD) sequence or the start codon [43]. Secondary structures that limit translation efficiency may be present in the 5’ untranslated region of the transcript as well as in the coding region downstream of the initiation codon [43]. However, it is known that, gram positive bacteria differ in some characteristics of their
9 translational machinery in comparison to gram negative. Thus, a predicted strong RBS can have different effects depending on the organism.
The change of the original RBS in pAMβ1 origin replication, might lead to a higher production of RepE protein and therefore more copies of pDNA.
3. MATERIALS AND METHODS
The strains Lactococcus lactis (LMG 19460) and Lactobacillus plantarum (CCUG 61730), which were chosen for this study are both
natural inhabitants of the gastrointestinal tract [17] [44] and also good candidates as delivery vehicles.
Although these advantages, gene manipulation and vector amplification are difficult in LAB. Therefore Escherichia coli (strain DH5α) was selected to perform these techniques, using a shuttle vector for LAB and E.coli. The shuttle vector contains the replicons and the genetic markers functional in LAB and E.coli.
The following diagram (figure 6) illustrates all phases of the work. The techniques used have been optimized taking in account the characteristics of the LAB.
All materials and solutions used were previously sterilized by autoclave at 121ºC for 20 min, and bacterial cells always manipulated in sterile conditions in a laminar flow chamber.
Figure 6 - Process overview - tasks and respective
10 3.1 BACTERIAL STRAINS AND PLASMIDS:
The bacterial strains and plasmids used in this work are show in Table 2.
Table 2 - Bacterial strains and plasmids
Strain or plasmid Replicon Characteristics Source
E. coli DH5α F- endA1 glnV44 thi-1 recA1 relA1
gyrA96 deoR nupG lacZΔM15 hsdR17 Invitrogen Lactococcus lactis
(LMG 19460) Wild type, plasmid free BCCM Collection Lactobacillus
plantarum (CCUG 61730 )
Wild type, plasmid free
Collection of Culture University of
Göteborg pTRKH3 p15A ori,
pAMβ1 ori Tet R , Ery R BCCM/LMBP collection, University of Ghent, Belgium 3.1.1 E. COLI DH5α:
E. coli DH5α cells were grown in a pre-inoculum overnight at 37°C in 15ml falcon tubes containing 5ml of Luria Bertani (LB) medium (20g/L) from Sigma Aldrich supplemented with 10μg/ml of tetracycline stock solution (10mg/mL) when containing pTRKH3 vector or its derivatives, at 37ºC with 250 rpm in an ARALAB orbital shaker model AGITORB 200. When cells reached the exponential growth phase they were transferred to 100ml Erlenmeyer flask containing 20ml of LB medium and incubated at 37°C and 250 rpm with 20μl of the same tetracycline stock solution, for 4-5 hours or until they reach the O.D.600nm of 1-1.5 measured
in U-2000 spectrophotometer (Hitachi®). Then the cells were used to make cell banks in 20% (v/v) glycerol, the 100μl aliquots were stored at - 80°C in 1.5ml microcentrifuge tubes.
3.1.2 DH5α COMPETENT CELLS:
The cells were grown up to the O.D.600nm 1-1.5 (as described in section 3.1.1) and were
centrifuged at 4000g for 10min. Supernatants were discarded, and the pellets were resuspended in 2ml of filtered TSS buffer (attachment1) and incubated for 10min on ice. Then aliquots with 100μl were prepared and stored at - 80ºC in 1.5ml microcentrifuge tubes.
3.1.3 PLASMID DNA pTRKH3:
The backbone plasmid used in this work was the pTRKH3 (figure 7) which is a shuttle cloning vector for E. coli, Lactococcus, Enterococcus, Streptococcus and Lactobacillus. The replicon includes an E. coli p15A origin as medium copy number (30-40 copies of plasmid per cell) and an Enterococcus faecalis pAMβ1 origin, denominated high copy number (45-85 copies in Gram-positive strains). The tetracycline resistance is only expressed in E. coli (which can be insertionally inactivated, having several sites of cloning), while the erythromycin resistance is expressed both in E. coli and in Gram-positive bacteria. It was
11 demonstrated in previous studies [45] [46], that cloning vector pTRKH3 can be transmissible to certain strains of LAB. Through, the direct cloning in LAB, the need arises to use an intermediate host E. coli.
Figure 7 – Physical map of plasmid pTRKH3 and some restriction sites [46]
3.1.4 TRANSFORMATION DH5 α WITH PLASMID.
DH5α cells were transformed with the plasmid pTRKH3, by heat shock. This was performed by the addition of 40µl of the plasmid (if is mutated or 10µl if is original pDNA) to the competent cells, for 30min on ice. The mixture was heated for 1min 30s at 42ºC and then chilled on ice for 2min followed by the addition of 1ml LB and incubation at 37ºC. Finally, cells were plated on selective LB agar medium supplemented with 10µg/ml, tetracycline and incubated at 37ºC, approximately for 24 hours. Subsequently, were made cell banks as described in section 3.1.1. Plasmid DNA was purified with High Pure Plasmid Isolation Kit (Roche) following manufacturer’s instructions. The pDNA obtained were eluted in 100μl elution buffer and stored at 4⁰C.
3.1.5 DIGESTION pTRKH3
In order to confirm the quality of the pDNA a digestion with Hind III restriction enzyme (restriction site A^AGCTT) (Promega) which cuts plasmid at two sites and produces two fragments 5265pb and 2501pb. Each digestion procedure consisted of 500ng of pDNA, 0.5μl of enzyme (10U/μl), 10 % of 10X Buffer B and filtered sterilized Milli-Q water to a determined final volume (10-15 μl). All mixtures were incubated for 2h at 37⁰C. After that a 1% agarose gel electrophoresis was run.
12 3.2 LACTIC ACID BACTERIA
3.2.1 CELL GROWTH OPTIMIZATION:
The LAB cells were anaerobically cultured on Man Rogosa and Sharp (MRS) medium at 37ºC in case L. plantarum CCUG 61730 and at 30ºC for L. lactis LMG 19460 with gentle agitation at 100 rpm. LAB cells were grown in a pre-inoculum overnight at 37°C in 15ml falcon tubes containing 15ml of MRS medium (52g/L) from Panreac Cultimed (see attachment 2 for the composition) supplemented with 5μg/ml of erythromycin stock solution (150mg/ml), when containing the pTRKH3 vector, in an ARALAB orbital shaker model AGITORB 200.
The next day, the pre inoculum was used to start a new culture, by the addition of these cells to a fresh medium up to O.D.600nm=0.1. The cells grew for additional 6 to 7 hours, until
the end of exponential phase, and cell banks were made in 20% (v/v) glycerol. The 100μl aliquots were stored at - 80°C.The LAB cells cultures were tested small scale (cell growth in 15ml falcon tubes containing 15ml of MRS medium) and at bench scale (cell growth in 500ml Erlenmeyer flask containing 300ml MRS medium). To perform alkaline lyses, the cells were grown in a 2 litters Erlenmeyer flak containing 1 litter of MRS medium. In order to characterize the growth of L. lactis LMG 19460 and L. plantarum CCUG 61730 at small scale and bench scale growth curves were determined. For this, the growth was initiated at O.D.600nm=0.1 in both cases, and from that, the O.D.600nm was measured every hour.
3.2.2 COMPETENT CELLS
This procedure was done with strains without native pDNA, to avoid some incompatibility. For the transformation of LAB we tested some protocols for making cells competent as described below.
Method 1 – G-SGMRS:
This protocol was adapted from [47]. The LAB cells were grown overnight at 30°C and 37ºC, depending on the strain, in 15ml falcon tubes containing 15ml of MRS medium and 0.5M sucrose, 2.5% glycine, and 0.5% glucose. The growth started with O.D.600nm=0.1, in an
100ml Erlenmeyer flask containing 100ml of the same new fresh medium.
The cells were grown until early and middle of exponential phase and the growth was stopped in ice and then cells were centrifuged for 10min at 4000g. Then, the cells were washed with 50ml of ice-cold wash solution (0.5M sucrose, 10% glycerol), and centrifuged for 15min at 6.000g, at 4ºC. Subsequently, the cells were washed twice. First, the cells were kept on ice for 15min in 25ml of solution containing 0.5M sucrose, 10% glycerol, and 0.05M EDTA and centrifuged for 15min at 6.000g, at 4ºC. Then, cells were washed with 12.5ml of ice-cold wash solution and centrifuged for 20min at 6.000g, at 4ºC. Finally cells were
13 resuspended in 0.5ml of ice cold wash solution. Aliquots of 100 µl were made and cells were stored at – 80ºC.
Method 2 – 10mM Dithiothreitol (DTT) and 100mM Lithium acetate (LiAc)
This protocol was done according to a modification of [46]. The LAB cells were growth overnight (as described in method 1) only with MRS medium. The new growth started with O.D.600nm=0.1 in a 15ml falcon tube containing 15ml of a same new fresh medium. After
reaching the corresponding O.D.600nm (see attachment 3, table 9 with the conditions) the LAB
cells were harvested in order to have 109 cells and centrifuged. The cells pellet following the pretreatment with LiAc and DTT was as follows: 109 cells were suspended at room temperature for 30min in 8ml of 100mM LiAc, 10mM DTT, 0.6M sucrose, and 10mM Tris-HCl, pH 7.5. Following treatment, the cells were centrifuged for 10min at 4000g, at 4ºC and washed for 4 times with ice cold Milli-Q water and following the electroporation. In this method, electroporation was performed with fresh cells and was not made cell banks.
Method 3 - 0.7 M Sodium Chloride (NaCl)
This protocol was adapted from [48]. The LAB cells were grown overnight as described in method 1 only with MRS medium. The new growth started with O.D.600nm=0.1, in a 100ml
of Erlenmeyer flask containing 100ml of a same new fresh medium supplemented with 0.7M NaCl. The cells were grown until early and middle of exponential phase, the growth was stopped on ice and then was centrifuged for 10min at 4000g, at 4ºC. Thereafter, the cells were washed for 4 times with ice cold Milli-Q water and aliquots of 100µl were made with 20% glycerol which were stored at – 80ºC. In table 3 (next section) is shown the O.D.600nm
they reached and the cell number used for electroporation producing transformants.
Method 4 - 8% Glycine
This protocol was adapted from [49] [50] [51]. The L. plantarum CCUG 61730 cells following the same procedure of Method 3 NaCl. By medium of the competent cells was added 8% glycine. The L. plantarum CCUG 61730 were harvested (see attachment 3 and table 10) and centrifuged at the same conditions. The cells were washed for four times with ice cold Milli-Q water and cells bank was made at the same conditions.
3.2.3 ELECTROPORATION OF L.lACTIS LMG19460 AND L.pLANTARUM CCUG61730
Electroporation was optimized according to [46] [47] [51].The electroporation cuvettes were maintained 30min on ice before electroporation. The cell number was calculated according to Jones, S., et al [52], [53] (O.D.600nm = 0.1 or 7 x 10⁷ CFU). The number of cells,
the amount of pDNA and electrical pulse used in the methods (G-SGMRS, DTT / LiAc and 8% Glycine) are shown with more detail in attachment 3. Here is described the conditions in
14 the NaCl method produced L. Lactis LMG 19460 transformants. In the NaCl method, electroporation was performed taking account the number of cells (as shown in table 3) using an electroporator with pulse controller (BTX ECM 399). In some cases, was required add 2 or 4 frozen aliquots and centrifuge the cells in order to be concentrated in a volume of 100µl. Electroporation was performed by a single pulse at 2-500V, 200 Ω, and 25 µF (pulse length ranged of 4.6 ms to 4.8 ms), in 2 mm electroporation cuvettes, using 1000ng of purified plasmid DNA. The cell suspension was diluted immediately by the addition of 1ml MRS and incubated for 3 hours at 30ºC or 37ºC (depending on the strain) without agitation. After the expression period, cells were plated onto MRS agar 2% supplemented with erythromycin (5 µg/ml), and incubated for 72h for selection of transformants. Appropriate controls were made omitting pDNA or the electric pulse. Transformation was confirmed then by colony PCR. Cell banks were made and pDNA purification was done by nucleospin plasmid (Macherey Nagel Bioanalysis). The plasmid extracted was digested with Hind III (as shown in section 3.1.5).
Table 3 - Cell number used in electrotransformation with NaCl method
Strains O.D.
600nm
Cell concentration in frozen aliquots
Number of cells used in electroporation Variation in electric pulse L. lactis LMG 19460 0.63 2.94 x 10⁹ cells in 100 µl 5.89 x 10 9 CFU and 1.17 x 10¹⁰ CFU 2 -500 V 0.43 2 x 10⁹ cells in 100 µl 4 x 10 9 CFU and 8 x 10⁹ CFU 2-500V L. plantarum CCUG 61730 2.16 9.97 x 10⁹ cells in 100 µl 9.97 x 10 9 CFU and 1.994 x 10¹⁰ CFU 2-500 V and 2x 2-500 V 2.16 9.97 x 10⁹ cells in 100 µl 9.97 x 10 9 CFU and 1.994 x 10¹⁰ CFU 2x 2-500 V and 3x 2-500 V 3.3 CONSTRUCTION OF pTRKH3 IN SILICO
In order to constructthe ribosome binding site (RBS) it was used the ApE® software. The RBS is a sequence found in prokaryotic mRNAs and its denominated Shine Dalgarno sequence. The Ribosome binds to the RBS and begins the translation at the start codon (ATG). The choice of RBS will affect protein expression levels. In order to produce an increased number of plasmid copies, it was tested two different RBS using the Anderson RBS library [39]. Thus far, the RBS library has not been experimentally characterized. The Anderson library was used to predict and design a two putatively stronger RBS sequences to replace the wild-type present in pAMβ1 origin of pTRKH3.
3.3.1 SITE DIRECTED MUTAGENESIS
For site directed mutagenesis it is necessary, that the mutagenic primer has high homology to the DNA strand which will be synthesized. The PCR Primers were designed using QuikChange Primer Design [54], and the sequences are in the attachment 4. Table 4 shows the strategy adopted in the construction of primers to switch the RBS.
15
Table 4 - Sequences RBS
The commercial kit Novagen® KOD Hot Start DNA Polymerase and the Thermo Hybaid Px2 thermocycler were used for the site directed mutagenesis. Each reaction mixture of 50µl
contains 50ng of template pDNA, 1µl of KOD HotStart DNA polymerase (1U/µl), 4.5µl MgSO4
(25mM stock concentration), 5µl Buffer KOD (10X concentrated), 10µl dNTP’s (2mM stock concentration),10 pmol each of forward and reverse primers and PCR grade water to obtain the final volume. The program used is shown in attachment 5. At the end of the PCR reaction was added to the mixture 1µl of the enzyme DpnI. The template DNA is methylated, and thus susceptible to DpnI digestion. The modified plasmids were used to transform to DH5α cells, where plasmid nicks are repaired and amplification occurs. Plasmid DNA proceeded to be purified with High Pure Plasmid Isolation Kit (Roche). To confirm the plasmid quality a digestion was made with Hind III restriction enzyme (as shown in section 3.1.5). The fragments obtained were run in a gel with 1% of agarose. The confirmation of the mutagenesis was made by sequencing by Stabvida.
3.3.2 QUANTITATIVE REAL-TIME PCR ASSAY
The quantification of plasmid copy number in L. lactis LMG 19460 was performed with the Roche LightCyclerTM detection system using the FastStart DNA Master SYBR Green I kitTM. The detection of pDNA was performed by amplification of a 190 bp sequence from the erm gene, the selective mark for erythromycin resistance (Forward primer: 5’ - CCA TGC GTC TGA CAT CTA TCT G - 3’ Reverse primer: 5’ – CTG TGG TAT GGC GGG TAA GT – 3’). The L. lactis LMG 19460 cells necessary for RT-PCR were grown up to O.D.600nm = 1 as
previously described. Cells where harvested, diluted in 100 µl and stored at -20ºC. The same amounts of cells (5 x 10⁴) were used in all experiments including the pDNA standard curve.
Plasmid DNA for standard curve was extracted from E. coli DH5α according to the Roche Miniprep Kit protocol. Serial five folds dilutions (1pg, 10pg, 100pg, 1000pg, 10000pg per capillary) of plasmid were conducted in triplicates to establish the standard curve. The CT
values were used to calculate a linear regression line by plotting the logarithm of template concentration (X-axis) versus the corresponding threshold cycle (Y-axis), (as shown in attachment 8).
Each 20µl of reaction mixture volume contained 2µl of the 10x SYBR Green mixture, 1µl of each primer (10µM final concentration), 1.6µl of MgCl2 (3mM final concentration), 2µl of
sample and the remaining volume was fulfilled by PCR grade water.Determination of pDNA
Original RBS sequence GTG GA GTT RBS 4
One pair of primers to switch 4 nucleotides GGG GA CAA RBS 5
One pair of primers to switch 3 nucleotides CAG GA CCC One pair of primers to switch 2 nucleotides CAG GA CCC
16 concentration in the L. lactis LMG 19460 cells was done in triplicate, for each analysis and performed by adding in each capillary was 2μl with 5 x 10⁴ of these cells, 2μl of PCR grade
water, and 16μl of the PCR reaction mixture. Reactions were incubated at 95ºC for 10min to activate FastStart DNA polymerase and lyse cells, followed by the amplification step consisting of 30 cycles of 10s at 95ºC, 5s at 56.9ºC and 7s at 72ºC, [55] reactions were kept at 70ºC for 30s, while fluorescence signal was continually monitored, for melting curve analysis. The final cycle, was a cooling step at 40ºC, 30s. Standard curves obtained in the reaction provide the relation between plasmid copy number and the CT, a relative
quantification method.The calculations to obtain the number of copies were based on the calibration curve, by finding the log of the concentration, thus, knowing the concentration of pDNA and its mass. Therefore, allowed knowing the number of moles and molecules. The number of copies is obtained by dividing the number of molecules for the number of cells in the reaction (5 x 10⁴ cells).
3.3.3 COLONY PCR
A PCR colony analysis was done to confirm cell transformation with pTRKH3. The pDNA was amplified for erm gene. The transformed colonies were picked into an eppendorf tube contain 70µl the Milli-Q water autoclaved and filtered (filter 0.1 µm). The 50µl of this volume was incubated at 99ºC for 5min to burst through the cells, the remaining 20µl were plated of positive PCR products. After the heat treatment, the cells were centrifuged at 11.000g for 1min and 10µl of the supernatant (containing pDNA) were used to add to PCR reaction. The negative control was performed with L. lactis LMG 19460 cells without pDNA.
The commercial kit used for amplification was NovaTaqTM Hot Start Master Mix kit – Novagen. Each reaction mixture of 50µl contains 10µl of pDNA, 25µl of Master Mix, 0.5µl (10µM stock concentration) each of forward and reverse primers and PCR grade water to obtain the final volume. The products of PCR reaction were run in a 1% agarose gel electrophoresis.
4. PLASMID PRIMARY ISOLATION 4.1 ALKALINELYSIS
L. lactis LMG 19760 cells harboring pTRKH3 plasmid, previously stored at -80ºC were cultivated overnight as described in section 3.2.1. The next day, these cells were used to inoculate a 100ml Erlenmeyer flask containing 100ml of fresh medium, with a starting O.D.600nm of 0.1. After 8 hours, these cells were transferred to a 2L Erlenmeyer flask with 1L
of MRS medium, supplemented with 5µg/ml of erythromycin. These cells were grown overnight (for 12 hours) at 30⁰C and 100rpm until the early stationary phase, corresponding to an O.D.600nm =1.20-1.40. In order to collect the cells, the culture was centrifuged at 6000g
17 for 15min at 4⁰C. After centrifugation, the supernatant was discarded and the cell pellet was resuspended in buffer P1 (50mM glucose, 25mM Tris-HCl, 10mM EDTA, pH 8.0), using vortex. Filtrated stock of Lysozyme with concentration 10mg/ml was added to buffer P1. The required volumes of P1 were calculated with the previously measured O.D.600nm of the cell
culture and following equation. The volume of P2 (0.2M NaOH, 1% (w/v) SDS) and P3 (5M potassium acetate, 6.8M glacial acetic acid) solutions, was the same volume of P1.
Where Vp is the volume of “P” solutions and Vculture is the volume of culture to be used.
Alkaline lysis was performed by adding the P2 solution, followed by an incubation of 10min at room temperature. The P3 solution was added followed by gentle homogenization. To precipitate genomic DNA, the mixture was left on ice for 10min. The lysate was centrifuged at 20.000g for 30min, at 4⁰C, in a Sorvall RC6 centrifuge with a SS-34 rotor, in order to remove genomic DNA, proteins and cell debris. The supernatant was placed in new tubes and centrifuged with the same settings as before to ensure complete removal of cell debris.
4.2 CONCENTRATIONANDCLARIFICATION
In order to precipitate pDNA a previously calculated volume (70% volume of the lysate volume) of isopropanol (100% v/v) was added to the lysate, followed by careful and gentle homogenization and a static incubation for 2 hours at -20ºC for precipitation. The mixture was centrifuged for 30 min at 4⁰C at 20.000g and the supernatant was discharged. The pellets were left to dry overnight. The pellets were dissolved in 1000µl of Tris-HCl (10mM, pH 8.0). The resulting solution was placed in eppendorf tubes with ammonium sulfate (taking into account that 500µl of Tris correspond 0.165 g of added ammonium sulfate). This mixture was homogenized and left on ice for 15min to allow removal of some impurities (proteins) by precipitation. The samples were centrifuged in an Eppendorf bench-top Centrifuge 5417 R with a rotor F45-30-11 at 18.000g and 4⁰C for 30min and the supernatant transferred to a new eppendorf tube. Samples were immediately processed in ÄKTA 100purify system.
4.3 HYDROPHOBIC INTERACTION CHROMATOGRAPHY (HIC) INÄKTA100 PURIFIER SYSTEM
Previously prepared Bio-Rad Econ-Pac columns, packed with 10cm height hydrophobic interaction resin, Phenyl SepharoseTM 6 Fast Flow was purchased
from
GE Healthcare(
Bio-Rad). The column was connected to an ÄKTA purifier system. Before chromatographic procedures, the columns were always washed with 30ml of Milli-Q water and equilibrated with 30ml of 1.5M ammonium sulfate (in 10mM tris-HCl pH 8.0). The standard purification18 protocol used to purify the plasmid DNA was based on [56] and the instrument used was ÄKTA GE Healthcare. A sample of 1ml of pDNA was injected in the column and isocratic elution was performed with 30ml of 1.5M ammonium sulfate (in 10mM Tris-HCl pH 8.0), with recovery of 1.5ml aliquots of flowthrough pDNA fractions. The remaining more hydrophobic molecules (RNA, genomic DNA, denatured pDNA) were eluted by injection of 30ml of 10mM Tris-HCl pH 8.0. The column was washed with 30ml of Milli-Q water and stored with 30ml of
PBS and 0.05% sodium azide. Relevant chromatographic fractions, for both flowthrough and eluted peaks were analysed by electrophoresis using 1% of agarose gel. The samples recovered from the procedure, (free RNA) were selected for concentration and diafiltration.
4.4 DIAFILTRATION-AMICON®
pDNA was purified from ammonium sulfate using the Amicon® ultra millipore 30 KDa membranes. The fractions selected were free of RNA and were concentrated. To 2ml of sample volume was put in the Amicon® and centrifuge 15min at 4000g, afterwards and the flow is discharged. The first permeate is again placed for filtration. The process is repeated by placing 2ml of the sample and centrifuged (discharged flow through) until no remaining sample to elute. The diafiltration step was performed by adding 2ml Milli-Q water in the same volume present initially, followed by a centrifugation step using the same settings as before. Recovery of concentrated pDNA was achieved by turning the Amicon® upside down and eluted in 100µl of Milli-Q water, centrifuging it again under the same conditions. The final concentration of pDNA was measured in NanoDrop spectrophotometer at 260nm. A digestion
was made as described in section 3.1.5.
5. RESULTS AND DISCUSSION
5.1 OPTIMIZATIONOFTHEGROWTH OF LAB ATSMALLSCALEANDBENCHSCALE
In order to analyse the growth of LAB cells, the respective cell growth curves at bench scale and small scale with or without pDNA were obtained. It is known that there are some factors which affect the growth of microorganisms, such as, the temperature, pH, agitation, available oxygen concentration, among others. In this case, these strains are anaerobic (although they are aerotolerant), grow with low agitation (100 rpm) and controlled pH of approximately 6.2
It was also verified for these strains that sodium acetate (5g/l) and Tween 80 (1.0g /l) are essential to their growth (depending on trademarks if containing or not). The figure 8 shows the growth curve in falcon tubes and Erlenmeyer flask for these strains. Growth curves were performed with two Erlenmeyer flask and two falcon tubes, such that the last Erlenmeyer flask and falcon was 12 hours delayed in relation to the first. Thus, it was possible to take more points during the growth.
19 In all strains it was observed that the stationary phase can be maintained for a long time (figure 9), in which biochemical alterations may occur. Although the O.D.600nm is the same
during this long stationary phase the physiological state is very different and that could affect pDNA production. At both small scale and bench scale, there were no significant differences in maximum O.D.600nm they reached. The exponential phase lasts approximately for 4 hours
for L. lactis LMG 19460 and 6 hours for L. plantarum CCUG 61730. For L. lactis LMG19460 with pTRKH3 lasts 6 hours, observing slower growth. L. lactis LMG 19460 cells without plasmid reach O.D.600nm = 3 and O.D.600nm = 1.60 with plasmid. The L. plantarum CCUG
61730 cells achieve much higher O.D.600nm= 10.
The figure 9 shows the specific growth rates for these strains in small scale and bench scale. The maximum specific growth rate (µmax) for both strains was obtained by applying a
linear regression to the values in exponential phase. A Napierian logarithm is applied to these values and the maximum specific growth corresponds to the slope of the obtained equation. The L. lactis LMG
19460 transformed cells, showed a slight decrease in specific growth rate. It is known, that plasmids may bring a higher metabolic burden to the cell and are likely to reduce the growth rate of the host cell [57]. This happens because cells harboring plasmid
require more energy and nutrient to synthesize more DNA, mRNA and protein than the plasmid free cells [58].
Figure 8 - Growth curve of L. lactis LMG 19460 and L. plantarum CCUG 61730 harbouring or not pTRKH3 0,1 1 10 0 10 20 30 40 50 60 OD 600n m Time (h) LMG Erlenmeyer Flask CCUG Erlenmeyer Flask LMG Falcon CCUG Falcon LMG/pTRKH3 Erlenmeyer Flask LMG/pTRKH3 Falcon 0,38 0,2 0,48 0,31 0,23 0,41 0 0,1 0,2 0,3 0,4 0,5 0,6 S p e c if ic g ro wt h r a te ( h -1) Falcon Erlenmeyer Flask
Figure 9 - Specific growth rate of L. lactis LMG 19460 and L.
20 This can be seen with the slight decrease in the optical density of L. lactis LMG 19760 cells, in part due to the sequestration of cellular resources for plasmid replication. The decrease in specific growth rate depends in part on strain, the copy number of pDNA and the nature of the cloning insert. As well as conditions of cell growth and the high levels of oxygen may affect your metabolism [59]. It can be verified at small scale and bench scale, that the growth rate did not affected significantly. The maximum growth rate, for strain L. plantarum CCUG 61730 was 0.48 h-1, for L. lactis LMG 19460 was 0.38 h-1 and L. lactis LMG 19460 with pTRKH3, was 0.23 h-1.
5.2 CONSTRUCTIONS OF SEQUENCES OF RBSs
As described above, the choice of RBS was performed using the Anderson library. According to the prediction of this library, both RBS 4 and RBS 5 are described as being stronger for the expression proteins in E. coli. However, there may be differences in LAB for expression of REP D and REP E which may or not result in an increased number of copies of pDNA. The figure 10 shows the sequence of the RBS, as well as the codon upstream and downstream and the translation start codon. A few approaches have already been tested at the pAMβ1 origin in order to increase the copy number. It was shown, that inactivation in the copy control region (CopF), led to an increase in the number of copies [37].
Figure 10 - Modification of RBS sequences in pTRKH3
It was also verified that introduction of PCT or TDE mutations in a pDNA, which lacks the
CopF repressor, does not cause a further increase in copy number. This may be due to a limiting factor for plasmid replication [31]. In another study was inserted the spac-I promoter upstream of ORF E in the plasmid pAMβ1spac replicated efficiently resulting in about 100 plasmids copies/cell in Bacillus subtilis [34].
Thus, in order to test another approach, it was chosen to switch the original RBS sequence of pAMβ1. The modification to RBS 4 was successful however, the complete sequence of the RBS 5 (CAG-GA-CCC), has not been totally achieved. As mentioned before, there are some factors that influence the efficiency of translation. Therefore, the rate at protein synthesis can be different, compared to original sequence (GTG-GA-GTT). It may occur a transient pausing in the translation of the protein sequence that are influenced by the
GAAG GTG GA GTT TGT ATG
Original RBS sequence
GAAG GGG GA CAA TGT ATG
RBS 4
21 messenger RNA [42]. Thus, the same protein can be translated at different rates. It was also described that RBS with purine rich sequences A's and G's close to the Shine Dalgarno sequence will lead to high rates of translation initiation [39] as can be observed by the sequence of the switch RBS 4 (GGG-GA-CAA). Then, will be shown the quantification of RBS 4 in some colonies compared to original RBS.
5.3 OPTIMIZATION OF LAB TRANSFORMATION
Plasmid incompatibility may occur if the cells to be transformed already harbour a native plasmid. The native plasmid and the transformed plasmid might compete for components required for their replication. Thus the weaker vector would become unstable or even disappear [19]. Therefore, the strains used in this work were devoid of native plasmids. There are several techniques for cell transformation but among them, electroporation provides the highest efficiency. This is a method that has been successfully employed with a number of bacterial species [50]. The use of a cell wall weakening agent during growth may be advantageous, because stimulate electrocompetence in various bacteria [49]. Incubation with high concentration of sucrose it’s known to cause a weakening of the cell wall in several bacteria. Different protocols for electrotransformation, previously described in section 3.2.2 were tested. It was verified that the strain L. lactis LMG19460 didn’t grow when using the medium of method 1 (G-SGMRS) due to the fact that glycine at this concentration of 2.5% inhibits the formation of cell and affects the growth, in such a way that cells may not complete cellular division. The L. plantarum CCUG 61730 strain grew up to O.D.600nm = 1.55
and O.D.600nm = 0.57. However, the transformation was not achieved, even varying several
parameters, such as the intensity of the shock (either with one pulse or two pulses of 2-500V) and the amount of pDNA (100 ng, 500 ng and 1000 ng).It would be expected that the growth medium could be effective in making cells more competent. However, the 2.5 % of glycine and 0.5M of sucrose (increased osmotic pressure) induced cell wall weakening strategy was shown too much aggressive for L. lactis LMG 19460 cells preventing their growth and ineffective for the transformation of L. plantarum CCUG 61730 cells.
The second method used was based in a pretreatment of the cells with LiAc and DTT before electroporation. These chemical components (commonly used for transformation of yeast) are reported to enhance the efficiency of transformation [46]. It was demonstrated that the transformation efficiency was higher with these two compounds together, compared omitting one of them [46]. The LAB cells were harvested during the exponential phase and the number of cells (109 cells) was controlled as suggested. It was verified that this process did not result for these strains. A test with more cells or an increased electric pulse should be performed.

![Figure 3 - ct-RNA based replication control [29]](https://thumb-eu.123doks.com/thumbv2/123dok_br/15457821.1029819/17.893.107.797.295.688/figure-ct-rna-based-replication-control.webp)
![Figure 5 - Replicon pAMβ1 [37]](https://thumb-eu.123doks.com/thumbv2/123dok_br/15457821.1029819/18.893.132.768.927.1098/figure-replicon-pamβ.webp)

![Figure 7 – Physical map of plasmid pTRKH3 and some restriction sites [46]](https://thumb-eu.123doks.com/thumbv2/123dok_br/15457821.1029819/22.893.317.616.192.498/figure-physical-map-plasmid-ptrkh-restriction-sites.webp)


