Contents lists available atScienceDirect
Journal of Plant Physiology
journal homepage:www.elsevier.com/locate/jplphEvaluating stress responses in cowpea under drought stress
Márcia Carvalho
a, Isaura Castro
a,b, José Moutinho-Pereira
a, Carlos Correia
a,
Marcos Egea-Cortines
c, Manuela Matos
b,d, Eduardo Rosa
a, Valdemar Carnide
a,b,⁎,
Teresa Lino-Neto
eaCentre for Research and Technology of Agro-Environment and Biological Sciences (CITAB), University of Trás-os-Montes and Alto Douro (UTAD), 5000-801 Vila Real, Portugal
bDepartment of Genetics and Biotechnology, University of Trás-os-Montes and Alto Douro (UTAD), 5000-801 Vila Real, Portugal cInstituto de Biotecnología Vegetal, Universidad Politécnica de Cartagena, 30202 Cartagena, Spain
dBiosystems & Integrative Sciences Institute (BioISI), Sciences Faculty, University of Lisbon, Campo Grande, 1749-016 Lisbon, Portugal
eBiosystems & Integrative Sciences Institute (BioISI), Plant Functional Biology Center (CBFP), University of Minho, Campus de Gualtar, 4710-057 Braga, Portugal
A R T I C L E I N F O Keywords:
Biochemical and molecular markers Genotype discrimination Physiological parameters Vigna unguiculata L. Walp. Drought stress
A B S T R A C T
Drought impact on plants is an increasing concern under the climate change scenario. Cowpea (Vigna unguiculata L. Walp.) is considered as one of the most tolerant legume crops to drought, being the search for the best well-adapted genotypes crucial to face the future challenges. Different approaches have been used for differentiating plant responses to drought stress. Plants of four cowpea genotypes were submitted to three watering regimens (a severe and moderate drought stress, and well-watered control) during 15 days, and several physiological, bio-chemical and molecular parameters were evaluated. Stressed plants revealed commonly-described drought stress characteristics, but not all assayed parameters were useful for discriminating plants with different drought se-verities or genotypes. The analyses which have contributed most to genotype discrimination were those related with stomatal function, and biochemical markers such as proline and anthocyanin contents. Antioxidant en-zymes activities and related genes expression did not differed among genotypes or upon drought stress treat-ments, suggesting that scavenging enzymes are not involved in the differential ability of cowpea plants to survive under drought stress. This information will be useful to evaluate and use genetic resources, as well as design strategies for breeding cowpea resistance to drought stress.
1. Introduction
Cowpea (Vigna unguiculata L. Walp.) belongs to the Leguminosae (or Fabaceae) family, which stand for their capacity to fix atmospheric nitrogen through the symbiotic relationship with soil bacteria. Cowpea, native from Africa, has been widely cultivated in tropical and sub-tropical regions (Timko et al., 2007). This legume crop is particularly featured by the high protein content, reasonable adaptation to low fertility soils and as well to high temperatures and drought (Agbicodo et al., 2009; Timko et al., 2007). Altogether, these features make cowpea a key crop in the context of global climate change and food security. A general temperature increase and rainfall decrease is pro-jected for Europe, where the Mediterranean countries are expected to suffer the major climate change effects (Kröner et al., 2017). Water deficit is one of the most serious challenge under climate change and
one of the most important abiotic stresses that negatively affects crop plants production (Agbicodo et al., 2009; Cruz de Carvalho, 2008). Cowpea has been referred as one of the most tolerant legume crops to drought (Agbicodo et al., 2009;Merwad et al., 2018).
Responses to drought are complex and different mechanisms have been developed by plants to adapt and survive during drought periods (Carvalho et al., 2017;Cruz de Carvalho, 2008;Merwad et al., 2018). Drought stressed plants reveal several morphological, physiological, biochemical, and molecular changes that adversely affect their devel-opment, growth and productivity (Hayatu et al., 2014;Toscano et al., 2016). One of the first physiological responses is a decrease in chlor-ophyll content, photosynthesis rate and transpiration (Kutama et al., 2014;Mafakheri et al., 2010; Singh and Raja Reddy, 2011). Drought responses also include increased peroxidation of lipid membranes and accumulation of reactive oxygen species (ROS). Plants developed
https://doi.org/10.1016/j.jplph.2019.153001
Received 30 November 2018; Received in revised form 12 June 2019; Accepted 12 June 2019
⁎Corresponding author at: Department of Genetics and Biotechnology, University of Trás-os-Montes and Alto Douro (UTAD), 5000-801 Vila Real, Portugal.
E-mail addresses:[email protected](M. Carvalho),[email protected](I. Castro),[email protected](J. Moutinho-Pereira),[email protected](C. Correia), [email protected](M. Egea-Cortines),[email protected](M. Matos),[email protected](E. Rosa),[email protected](V. Carnide),
[email protected](T. Lino-Neto).
Available online 14 June 2019
0176-1617/ © 2019 Elsevier GmbH. All rights reserved.
strategies to balance ROS production, many of which involve anti-oxidant enzyme activities (Moller et al., 2007;Toscano et al., 2016). ROS scavenging enzymes, including for example superoxide dismutase (SOD), catalase (CAT), ascorbate peroxidase (APX), and glutathione peroxidase (GPX), comprise a complex enzymatic system that mini-mizes the effects of oxidative stress (Apel and Hirt, 2004;Toscano et al., 2016). Higher antioxidant enzymes activity can contribute for a better drought tolerance by increasing the protection capacity against oxida-tive damage. To our knowledge, few studies on the response of these enzymes on cowpea under drought conditions have been performed. Another plant protection tool against mild drought stress includes the accumulation of osmolytes, proline being one of the most common in drought stressed plants (Mafakheri et al., 2010). Proline accumulation is commonly considered as part of the stress signalling and influences adaptive plant responses (Mafakheri et al., 2010). For the identification of genes, pathways and processes important for controlling cowpea responses to drought stress, several genomics and genetic approaches have been developed (Chaves et al., 2003). Several cowpea drought-related genes have been identified, some of which involved in anti-oxidant metabolism (reviewed byCarvalho et al., 2017).
The understanding of biochemical and physiological mechanisms and/or genetic basis of cowpea drought tolerance has been pursued by several authors, but a comprehensive study considering physiological, biochemical and molecular aspects of cowpea drought tolerance is lacking. The present work intends to present a foreknowledge about cowpea drought responses, while selecting the best approaches for differentiating cowpea genotypes under drought stress treatments. In particular, we aim to answer the following questions: Could plant physiology be used to screen differently affected cowpea genotypes by drought?; Are plant biochemical responses to stress conditions suitable for differentiating cowpea drought tolerance?; Could the activity of antioxidant stress enzymes be used for screening cowpea drought tol-erance differences?; Could gene-expression profiling be used to screen cowpea drought stress tolerance?; and How can genotypes be dis-criminated?. Thus, two Portuguese cowpea genotypes and two drought-susceptible controls, were used and submitted to three different water regimes. The physiological and biochemical responses of cowpea plants were monitored, as well as the gene expression profiling of drought stress-related genes, for comparing drought stress responses.
2. Material and methods
2.1. Plant material and experimental design
Two Portuguese genotypes, a commercial variety (Cp5051) and a Northern landrace (Vg50), as well as two control genotypes with al-ready described drought responses (Bambey 21 and CB46), were se-lected for this work. The two Portuguese genotypes were previously characterized using morphological and agronomical parameters (Carvalho et al., 2017a) and single nucleotide polymorphism (SNP) analysis through the Illumina Cowpea iSelect Consortium Array (Carvalho et al., 2017b). Both Portuguese genotypes were selected under different climatic conditions, being the Cp5051 selected under a hotter and dryer spring and summer (South Portugal) and Vg50 selected in a more temperate area (Northern Portugal).Goufo et al. (2017)also used both genotypes in a study of drought stress. The molecular analysis revealed that the commercial variety (Cp5051) was ‘admixed’ (not belonging to any of the subpopulations identified) being considered a source of variability and could be considered in the future for breeding cowpea resistance to drought stress programs. Bambey 21 from Senegal is highly susceptible to drought, whereas California Blackeye 46 (CB46) from University of California Davis (USA) is moderately susceptible (Hamidou et al., 2007; Muchero et al., 2010,2008). Both genotypes were supplied by University of California Riverside.
Plant growth (including drought imposition) was performed in a glasshouse at the University of Trás-os-Montes and Alto Douro (UTAD),
Vila Real, Portugal (41° 17′ N, 07° 44′ W, 465 m of altitude), from June to July 2016. During this period, the average temperature recorded was 28.3 °C ranging from 18.1 °C to 42.0 °C. Plants were grown under nat-ural photoperiod, being each genotype sown in six pots (replicates). Pots of 12-L were filled with identical volumes of a mixture of soil/ sand/peat (2:1:1, v/v/v). All pots were watered up to field capacity (FC) one day before sowing, allowing the draining of water excess. Four seeds previously selected by size and quality were sown in each pot. After two weeks, the two less developed plants in each pot were re-moved. Pots were regularly watered to keep the soil at 75% of FC during the first 30 days after sowing. Following this period, plants were submitted to three watering treatments for 15 days: i) the pot mixture was maintained at a minimum of 75% of FC (control condition); ii) the pot mixture was kept at 25% of FC (moderate water stress conditions); and iii) the irrigation was withheld (0% FC, corresponding to severe water stress conditions). Pots were completely randomized between the four genotypes and three watering regimens. In total, 144 plants (4 genotypes × 3 watering regimens × 6 pots × 2 plants) were used. For physiological evaluation, measurements were done during the morning always starting at 09:00 of four distinct days (32, 36, 42 and 47 days after sowing), in one plant of each pot.
To perform the biochemical analysis, young full expanded leaves were harvested following the 15 days of water stress treatments and immediately frozen in liquid nitrogen. For molecular analysis (RNA extraction), young leaves were also harvested following the 15 days of water stress treatments and immediately frozen in liquid nitrogen. Leaf samples were individually ground to a fine powder using liquid ni-trogen and 60 mg aliquots were maintained at −80 °C up to their use. 2.2. Measurement of gas exchange and chlorophyll a fluorescence
Gas exchange parameters were determined with an infrared por-table gas exchange analyzer (LC pro+, ADC, Hoddesdon, UK). Stomatal conductance (gs), net CO2assimilation rate (A) and intrinsic water use
efficiency (A/gs) were estimated according to the equations described
byvon Caemmerer and Farquhar (1981). Chlorophyll a fluorescence features were obtained in situ, in the same period of gas exchange measurements, using a pulse-amplitude-modulated fluorimeter (FM2, Hansatech Instruments, Norkfolk, UK). Maximum quantum efficiency of photosystem II was calculated as Fv/Fm= (Fm– F0)/Fm. The
fluores-cence signal from 30 min dark-adapted leaves was measured when all reaction centers were open, by using a low intensity pulsed measuring light source (F0). During a pulse saturating light [0.7 s pulse of
15,000 μmol photons m−2s−1of white light], when all reactions
cen-ters were closed, a second fluorescence signal was measured (Fm).
Following Fv/Fm estimation, after a 20 s exposure to actinic light
[1,500 μmol photons m−2s−1], light-adapted steady-state fluorescence
yield (Fs) was averaged over 2.5 s, followed by exposure to saturating
light [15,000 μmol photons m−2 s−1] for 0.7 s to establish F m’. The
sample was then shaded for 5 s with a far-red light source to determine F0’. From these measurements, different fluorescence attributes were
calculated, according toBilger and Schreiber (1986)andGenty et al. (1989): the photochemical quenching [qP = (Fm’ – Fs)/(Fm’– F0’)] and
the efficiency of electron transport, as a measure of the quantum ef-fective efficiency of PSII [ΦPSII= ΔF/Fm’ = (Fm’ – Fs)/Fm’]. The
pho-tosynthetic electron transport rate was estimated as ETR = (ΔF/Fm’) ×
PPFD × 0.5 × 0.84 (Marinari et al., 2007), where PPFD is the photo-synthetic photon flux density incident on the leaf, 0.5 is the factor that assumes equal distribution of energy between both photosystems, and 0.84 the used leaf absorbance as the most common value for C3plants
(Bilger and Schreiber, 1986).
2.3. Determination of biochemical markers
Free proline content was measured according toBates (1973), with some modifications. Tissue (60 mg) was homogenized in 1.5 mL of 3%
(w/v) sulphosalicylic acid and centrifuged at 12,000g for 15 min. Equal volumes of acid-ninhydrin and glacial acetic acid (0.4 mL) were mixed with 0.1 mL of supernatant and the resulting mixture was heated on a boiling water bath for 1 h. Toluene (0.8 mL) was added to the mixture and the toluene phase absorbance was read at 520 nm. Free proline content was estimated by referring to a standard curve of L-proline and expressed as μg proline/mg of protein.
Lipid peroxidation was determined through the quantification of malondialdehyde (MDA) content by thiobarbituric acid method, as described by Loreto and Velikova (2001), with some modifications. Tissue (60 mg) was homogenized in 0.1% (w/v) of trichloroacetic acid (TCA) and centrifuged at 12,000 g for 15 min. The supernatant (0.25 mL) was mixed with 1 mL of 20% TCA containing 0.5% thio-barbituric acid (TBA) and was incubated to 95 °C, in a water bath, for 30 min. The reaction was stopped by an ice bath and samples were centrifuged at 10,000 g for 5 min. The absorbance of supernatant was read at 532 nm and 600 nm. The concentration of MDA was calculated by subtracting the A532to A260and using an extinction coefficient of
155 mM−1cm−1.
The hydrogen peroxide (H2O2) content was determined using the
plant extracts prepared for lipid peroxidation determination and the method described by Loreto and Velikova (2001), with some volume modifications. A supernatant aliquot (0.5 mL) was added to 0.5 mL of 10 mM potassium phosphate buffer (KH2PO4, pH 7.0) and 1 mL of 1 M
of potassium iodide (KI). The absorbance was measured at 390 nm and the H2O2 content was extrapolated through a standard calibration
curve, previously made using solutions with known H2O2
concentra-tions.
The relative anthocyanin content was determined according toKant et al. (2006). Tissue (60 mg) was homogenized in 1 mL of methanol (acidified with 1% HCl) and incubated overnight. After adding 0.7 mL of distilled water and 1.75 mL of chloroform, the extract was cen-trifuged at 4000g for 2 min. The relative anthocyanins amount was calculated by subtracting the absorbance readings at A657to A530of the
aqueous phase. Chlorophylls (a + b) were quantified according to Arnon (1949). Tissue (60 mg) was homogenized in 10 mL of aqueous acetone (80%, v/v), incubated overnight at 4 °C in the dark, and chlorophyll extracts were used for absorbance readings (A663to A645).
The protein content was determined using the Bradford’s method (Bradford, 1976), using BSA as standard. Protein concentration values were used to normalize all biochemical results. For each biochemical quantification, six leaf samples of each genotype and condition were used, and were independently repeated three times (n = 18). Spectro-photometric measures were done in an Evolution 201 series UV–vis Spectrophotometer (ThermoScientific, Waltham, USA).
2.4. Measurement of antioxidant enzyme activities
Superoxide dismutase (SOD) and guaiacol peroxidase (POX) activ-ities were determined according toCavalcanti et al. (2004), with some modifications. Tissue (60 mg) was homogenized in 1 mL of 100 mM of potassium phosphate buffer (KH2PO4, pH 6.8) containing 0.1 mM EDTA
and centrifuged at 12,000 g for 15 min at 4 °C. An enzymatic extract aliquot (20 μL) was added to 150 μL of 50 mM of potassium phosphate buffer (KH2PO4, pH 7.8) containing 13 mM L-methionine and 100 μM
EDTA. SOD activity was determined by adding 15 μL of 75 μM NBT and 15 μL of 2 μM riboflavin. The reaction was incubated under a 30 W fluorescent lamp at RT, during 5 min, after which the absorbance was measured at 560 nm. One SOD unit was the amount of enzyme required to inhibit 50% the NBT photoreduction, in comparison with blank (tubes without plant extract). POX activity was determined by adding the same enzymatic extract (10 μL) to 140 μL of 50 mM of potassium phosphate buffer (KH2PO4, pH 7.8) containing 20 mM guaiacol and
20 mM H2O2. The reaction was incubated for 30 min at 30 °C, being
stopped by adding 50 μL of 5% (v/v) H2SO4. The absorbance was
measured at 480 nm. One POX unit was defined as the amount of
enzyme needed to cause a change of 1.0 absorbance unit per ml en-zymatic extract. Catalase (CAT) activity was measured using the same enzymatic extract and the protocol proposed byAebi (1983). A mix with 120 μL of potassium phosphate buffer (KH2PO4, 50 mM, pH 7.0)
and 10 μL enzymatic extract was stabilized for 5 min at 25 °C. After adding 70 μL of 0.2% (v/v) H2O2, the decomposition of H2O2was
fol-lowed at 240 nm. Enzyme activity was calculated using the molar ex-tinction coefficient of H2O20.0394 mM−1cm−1. One CAT unit is
de-fined as the amount of enzyme causing the decomposition of 1 μmol of H2O2per minute, at 25 °C.
Ascorbate peroxidase (APX) and glutathione reductase (GR) activ-ities were determined following the method byMurshed et al. (2008), with some modifications. Enzymatic extract was prepared using tissue plant (60 mg) and 1 mL of 50 mM of MES/KOH buffer (pH 6.0), con-taining 40 mM KCl, 2 mM CaCl2and 1 mM L-ascorbic acid (AsA), and
centrifuged at 12,000 g for 10 min at 4 °C. For APX activity estimation, an enzymatic extract aliquot (10 μL) was added to 185 μL of 50 mM of potassium phosphate buffer (KH2PO4, pH 7.0) containing 1 mM AsA.
After being shaken during 5 seg, the reaction mixture absorbance was followed at 290 nm for 3 min at 25 °C, to determine nonspecific ascor-bate degradation. APX activity was started by adding 20 μL of 50 mM of H2O2and determined by following the absorbance at 290 nm for 5 min
at 25 °C. The APX specific activity was calculated using the 2.8 mM−1cm−1 extinction coefficient, being one unit defined as the
amount of enzyme that oxidizes 1 μmol of ascorbate per min. For de-termining GR activity, an enzymatic extract aliquot (10 μL) was added to 150 μL of 50 mM of HEPES buffer (pH 8.0) containing 0.5 mM of EDTA and 20 μL of 20 mM GSSG. Supernatant was shaken during 5 s and the absorbance at 340 nm was measured for 3 min at 25 °C to de-termine nonspecific NADH oxidase activity. GR activity was started by adding 20 μL of 0.05 mM of NADPH and determined by following the absorbance at 340 nm for 5 min at 25 °C. GR specific activity was cal-culated from the 6.22 mM−1cm-1extinction coefficient. One unit was
defined as the amount of enzyme that will reduce 1 nmol of GSSG per min. All enzyme activities were expressed in U/mg of protein.
All enzymatic assays were performed using freshly prepared ex-tracts, maintained on ice until analysis. For each antioxidant enzyme measurement, six leaf samples of each genotype and condition were used and independently repeated for three times (n = 18). The micro-plate reader used for all readings was the PowerWave XS2 (BioTek Instruments, Inc., Winooski, USA), equipped with an internal tem-perature incubator and a shaker for kinetic analysis.
2.5. Total RNA extraction and reverse transcription
Leaf samples were harvested from three biological replicates of each genotype/condition, following 15 days of stress imposition, being im-mediately grounded to a fine powder in the presence of liquid nitrogen. Total RNA was extracted using the NucleoSpin RNA Plant kit (Macherey-Nagel, Düren, Germany), as described by the manufacturer. RNA in-tegrity and DNA contamination were assessed in a 1% agarose gel, while RNA concentration and quality was estimated using the A260/
A280 ratio through the spectrophotometer Powerwave XS2 (BioTek
Instruments, Inc., Winooski, USA). First strand cDNA was prepared using High Capacity cDNA Reverse Transcription kit (Applied Biosystems, Foster City, USA) and a total RNA concentration of 1000 ng/μL, ac-cording to manufacturer’s protocol. The resulting cDNA mixture was diluted to 1:10 and stored at −20 °C.
2.6. Gene expression analysis
A total of 13 genes (five related to drought stress, five to oxidative stress, and three reference genes) were studied in this work (Table 1). Specific primers for drought or oxidative stress-related genes were signed based on sequences available in the NCBI database and/or de-scribed in previous studies (accession numbers provided inTable 1).
Primer pairs were designed using Primer 3 (v. 0.4.0), considering the following criteria: 20–25 bp of primer size, GC content of 45–60% and melting temperature (Tm) around 60–62 °C. Primers were checked by
OligoCalc program. Genes expression were firstly tested by semi-quan-titative PCR using the Taq PCR Master mix kit (Qiagen, Hilden, Ger-many). cDNA amplifications were carried out in a BioRad T100 Thermal Cycler (BioRad, Hercules, USA) and amplicons were separated by electrophoresis on agarose gels (1.7%, w/v), running at 90 V for 75 min, and stained with an ethidium bromide solution. Gels were visualized using the Molecular Image Gel-Doc™ XR+ with Image Lab™ Software
(BioRad, Hercules, USA). The expression of each gene was evaluated at the linearity phase of the amplification reaction by the previous com-parison of corresponding PCR products at different cycles. Semi-quan-titative PCR analysis were independently repeated three times for each of the three biological samples from each treatment. Different expres-sion levels were determined according to the band amplification in-tensity. The band amplification intensity was determined by the soft-ware Image LabTM Softsoft-ware (BioRad, Hercules, USA). These values were used for performing a results matrix (Table S1). Two differentially ex-pressed genes (VuCPRD14 and VuHsp17.7) were further studied by qRT-PCR using relative quantification, according to the MIQE criteria (Minimum Information for the Publication of Quantitative Real-Time PCR Experiments;Bustin et al., 2009) presented in Table S2. The ex-periments were performed using a StepOnePlus Real Time PCR system (Applied Biosystems, Foster City, USA). PCR amplifications of each biological sample were performed in triplicate using the SensiFAST™ SYBR® Hi-Rox kit (Bioline USA Inc., Taunton, USA) and analysed using StepOnePlus Real Time PCR software (Applied Biosystems, Foster City, USA). Only threshold quantification cycle (Ct) values, leading to a Ct mean with a standard deviation below 0.5, were considered. Mean PCR efficiency per gene was estimated using standards curves based on ten-fold dilutions of corresponding cDNA mix of all the samples (in tripli-cate). The efficiency values varied from 96 to 108% for reference and target genes (Table 1) and were determined and calculated by the StepOnePlus Real Time PCR software (Applied Biosystems, Foster City, USA). VuEF1-α and VuPp2A were used as reference genes for normal-ization. The expression values were normalized by the average of
reference genes expression using the REST 2009 v2.0.13 software (Copyright 2009; Qiagen GmbH). This software is specific for statistical test of qRT-PCR data for pairwise differences between groups (Pfaffl, 2001;Pfaffl et al., 2002,2009) allowing the determination of relative expression values for each study gene and statistical significance of gene expression among genotypes.
2.7. Statistical data analysis
Data from physiological and biochemical measurements are pre-sented as the mean of four to six independent experiments with the respective SE bars. Differences between means were analysed with one-way or with two-one-way ANOVA followed by Tukey’s test (p < 0.05 were considered as significant), using IBM SPSS Statistics version 20 software (IBM SPSS, Inc., Chicago, USA). Principal component analysis (PCA) was performed using Past version 3.19 statistical software (Hammer et al., 2001), using values normalized into percentage taking into ac-count the maximum value obtained for each assay/test.
3. Results and discussion
Several physiological, biochemical and molecular aspects were de-termined, in four cowpea genotypes, after imposing three different water regimens - severe water stress withholding irrigation (0% FC), moderate water stress (25% FC), and control with non-limiting water suppling (75% FC, control) for a period of two weeks. These evaluations will contribute to the understanding of drought tolerance mechanisms and elucidate on the most appropriate methodologies to discriminate different drought tolerance levels in cowpea genotypes.
3.1. Could plant physiology be used to screen differently affected cowpea genotypes by drought?
Stomatal function and photosynthetic capacity have been con-sidered good indicators of plant response to water deficit being both non-invasive procedures. In order to investigate the effect of water limitation on stomatal function and photosynthetic ability, plants from Table 1
Descriptions of all drought and oxidative-related cowpea genes, as well as the housekeeping genes used as reference, used for expression analyses. Amplification efficiency and regression are provided for primers used in qRT-PCR. AS – Amplicon size; Ta – Temperature of annealing; E – Efficiency; r2– Regression coefficient.
Type Gene Genebank
accession Reference Gene function Primers sequences (5’3’) AS (bp) Ta (ºC) E r 2
Housekeeping VuEF1-α XP_003553292 Weiss et al.,
2018 Elongation factor 1-alpha F: GCCTGGTATGGTGGTGACTTR: GCGAACTTCACTGCAATGTG 280 60 108 0.992 VuPp2A AT1G13320 Da Silva et al.,
2015 Regulatory subunit ofphosphatase 2A protein F: CATTGTTGAGCTTGCTGAGGR: GAGCACCAAGCTTGTCATCA 150 60 99 0.993 VuSkip 16 NP_001242370 Weiss et al.,
2018 ASK-interacting protein 16 F: ACAGCCGTTGAACAAAAAGGR: GTGGCTTCTTCGTCCACACT 300 60 – – Drought VuCPRD14 D83971 This work Response to dehydration stress F: GTACCCAACATTGCAACTTC 150 57 101 0.989
R: ACAGTATCCTTGATGCTCAC VuCPRD22 D83972 Muchero et al.,
2010 Response to dehydration stress F: CAAGTTACCAGAAGCAGTACR: CCACATTTACACGACAAGAC 900 57 – – VuCPRD65 AB030293 This work 9-Cis-epoxycarotenoid
dioxygenase 1 F: CCCTTCAAAGACCTACCTTCCR: GGATGTGGATGTGGATGTTG 150 60 – – VusHsp17.7 EF514500 Da Silva et al.,
2015 Small heat shock protein 17.7KDa F: GGACGAAGGAGAAGGAGGACR: TCCTCCTTGGGAACAGTGAC 150 60 96 0.994 VuNced1 AB030293 Da Silva et al.,
2015 9-Cis-epoxycarotenoiddioxygenase 1 F: CGAAGACGATTTACCCTACCACR: GAGGTAAGGCTTCTGAATGACG 180 55 – – Oxidative stress VucGR DQ267475 This work Cytosolic glutathione reductase F: GGGATGGGTTCTGAAGTTGA 120 60 – –
R: ATTCCCCTGCCTTCAAGATT VuPAP-α AF165891 This work Putative phosphatidate
phosphatase F: AAGGGGTCGTAAAGGAAGGAR: TTTTGCAACATGACCTCTGC 130 60 – – VuPAP-β AF171230 This work Putative phosphatidate
phosphatase F: CTCTTGGTCCTTTGCTGGTCR: CCACGAGGATCGGTAAGAAA 150 60 – –
VuPLD1 U92656 This work Putative phospholipase D F: GCTCATAGGTGTTGGGAGGA 150 60 – –
R: GCCGCCTAGAATCCCTTATC
VusAPX AY484493 This work Stromatic ascorbate peroxidase F: GCTTCTCCAGCCAATCAAAG 150 60 – – R: CTTCGGGACATTGTTCAGGT
four genotypes were evaluated during the time course of the experiment on extreme conditions: severe water-stressed (0% FC) and well-irrigated (75% FC, control) plants (Table 2). When considering severe stress in-duction, stomatal conductance (gs) and net CO2assimilation (A)
para-meters showed significant differences along time (p < 0.001), com-pared to well-irrigated plants that were not so affected during the same period. As a consequence, the difference between treatments (75% and 0% FC) increased during time, becoming significantly different (p < 0.001) after 10 days of water privation. Significant decreases in gsand
A parameters have been considered as an evidence of stomatal limita-tion due to drought stress induclimita-tion (Anjum et al., 2011;Munjonji et al., 2018) and have already been reported as a cowpea drought response (Kutama et al., 2014;Singh and Raja Reddy, 2011). In addition, sig-nificant decrease of gsin drought treatments have been suggested to
indicate an efficient adaptive transpiration control (Hessini et al., 2008). During drought imposition (0% FC), intrinsic water use effi-ciency (evaluated by A/gs) also decreased for all four genotypes.
However, a transient stomatal regulation led to a slight increase of this parameter in the first 10 days upon stress imposition. This has been interpreted as an adjustment of water loss through transpiration and absorption of CO2(Wu et al., 2011). Distinct genotypes revealed
sig-nificantly different (p < 0.05) water use efficiencies after 15 days of drought imposition, but not on stomatal conductance or net CO2
as-similation. The susceptible Bambey 21 and Vg50 genotypes revealed a lower water use efficiency than the moderately susceptible genotype (CB46) and Cp5051 genotype. Plants capacity to establish efficient rooting system may be involved in different drought tolerance re-sponses (Agbicodo et al., 2009) namely plants stomatal function (Nahar et al., 2015). Accordingly,Munjonji et al. (2018)observed that geno-types with well-developed root system maintain relatively higher gsand
A values than genotypes with limited root system, indicating a lower drought tolerance. However, in a recent study Vg50 was described as revealing an increased root length after drought imposition (Goufo et al., 2017), suggesting that the detected root system increase was not enough for diminishing the drought stress response, at least under the
tested conditions. To explore this data, a better understanding of cowpea root phenotyping under drought stress would be desirable.
Several parameters related to chlorophyll a fluorescence were measured to evaluate the effects of water limitation on photochemical reactions (Table 3). The maximum efficiency of PSII photochemistry (as revealed by Fv/Fmratio) was affected by drought treatment (0% FC).
Differences between both water regimens became significant (p < 0.01) after 10 days and were further amplified by drought persistence (15 days, p < 0.001). This can be explained by the drought stress affects PSII efficiency leading to an Fv/Fmdecrease, as was observed bySingh
and Raja Reddy (2011). Control plants did not reveal significant changes on this parameter. A similar picture was obtained when de-termining the effective quantum efficiency of photosystem II (ΦPSII) and
apparent electron transport rate (ETR). Both parameters declined after 10 days of water privation, while control plants revealed less significant changes on these parameters levels which could be explained by plant development or genotype features. As for Fv/Fmratio, genotypes did not
present any significant differences on ΦPSII or ETR among them.
Al-though exhibiting a similar trend, the photochemical fluorescence quenching (qP) was the only parameter in which significant differences were observed between genotypes. Differences were detected both in control and severe stressed plants after 15 assay days, revealing that genotypes present differences on their chlorophyll fluorescence during development. The moderately susceptible CB46 and Cp5051 genotypes revealed a higher qP, indicating that more energy was quenched to the primary photochemical reactions leading to a more efficient photo-synthetic process (Krause and Weis, 1991). Vg50 genotype revealed an even lower qP value than the susceptible Bambey 21 genotype.
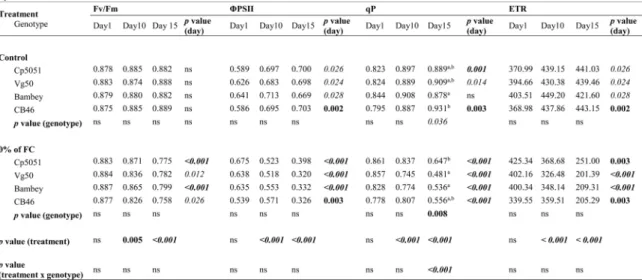
When determining the chlorophyll content of all genotypes after 15 days on three different water regimens (75%, 25% and 0% of FC), a significant reduction was observed under drought stress conditions (Fig. 1). Chlorophylls did not vary significantly between days 1 and 15 under control conditions (data not show). Lowest levels of chlorophylls were observed in severely stressed plants after 15 assay days (p < 0.05, in comparison to control). This decrease could be explained by Table 2
Effects of water restriction on stomatal function of the four cowpea genotypes. Average values of stomatal conductance (gs), net CO2assimilation (A) and intrinsic
water use efficiency (A/gs) of plants from which water was withheld (0% of field capacity, FC) and well-watered plants (75% FC, control). The experiment was
simultaneously conducted in four cowpea genotypes (n = 6 per genotype/condition), which were evaluated 1, 10, and 15 days after stress imposition. Statistical significances were determined during the time course of experiment (p value day), among genotypes (p value genotype), between treatments (p value treatment) and considering genotype with treatment (p value treatment x genotype). Significant differences were evaluated by one-way or two-way ANOVA, followed by Tukey tests.
Bold/italics - indicates significant differences at level p < 0.001; bold - indicates significant differences at level p < 0.01; italics - indicates significant differences
changes in chloroplast structure or biosynthesis inhibition of chlor-ophyll or its precursors (Nahar et al., 2015). Previous studies indicated that drought tolerant genotypes were able to maintain a higher chlor-ophyll content than susceptible genotypes under drought conditions (Siddiqui et al., 2015). Cp5051 and CB46 genotypes seemed to be the most affected by drought stress (0% FC) and presented lower values of chlorophylls content but differences were not statistically significant among all genotypes.
The reduction of photosynthetic parameters is commonly observed under stress situations and have been reported for different plant spe-cies (reviewed by Gururani et al., 2015), being the decrease of all evaluated parameters (Fv/Fmratio, ΦPSII, qP and ETR) and chlorophyll
content with drought imposition observed in other studies (Singh and Raja Reddy, 2011;Souza et al., 2004). Altogether, the obtained results revealed that cowpea plants evidenced symptoms of drought stress after 10 days of water withholding, which were further enhanced by drought persistence. The evaluation of gas exchange and chlorophyll a fluores-cence parameters also suggested that Bambey 21 and Vg50 genotypes were the most affected genotypes under drought stress conditions.
3.2. Are plant biochemical responses to stress conditions suitable for differentiating cowpea drought tolerance?
Plants display a set of biochemical responses when exposed to dif-ferent stress situations, such as: (1) accumulation of compatible solutes, namely proline, mainly in those plants exposed to water stress (Anjum et al., 2011), (2) production of anthocyanins (Kovinich et al., 2015), (3) increasing of lipid peroxidation processes (Anjum et al., 2011), and (4) alterations on hydrogen peroxide (H2O2) content (Anjum et al., 2016;
Zhou et al., 2006). For comparing plant responses among cowpea genotypes, all these stress parameters were evaluated after 15 days of 0% FC (severe) and 25% FC (moderate) drought stress and compared with control values (Fig. 2). For all genotypes, leaf proline contents increased significantly with stress severity (Fig. 2A), which is in agreement with other studies (Cavalcanti et al., 2004;Merwad et al., 2018; Singh and Raja Reddy, 2011). The four genotypes presented differences on proline accumulation, which suggests differences in their drought tolerance since higher proline accumulation under stress con-ditions has been correlated with stress-tolerance plants (Anjum et al., 2011; Toscano et al., 2016). Vg50 genotype presented the highest Table 3
Effects of water restriction on photosynthetic efficiency of four cowpea genotypes. Average values of maximum (Fv/Fm) and effective (ΦPSII) quantum efficiency of photosystem II, as well as photochemical (qP) fluorescence quenching and apparent electron transport rate (ETR) of plants from which water was withheld (0% of field capacity, FC) and well-watered plants (75% FC, control). The experiment was simultaneously conducted in four cowpea genotypes (n = 6 per genotype/ condition), which were evaluated 1, 10, and 15 days after stress imposition. Statistical significances were determined during the time course of experiment (p value day), among genotypes (p value genotype), between treatments (p value treatment) and considering genotype with treatment (p value treatment x genotype). Significant differences were evaluated by one-way or two-way ANOVA, followed by Tukey tests. Bold/italics - indicates significant differences at level p < 0.001; bold - indicates significant differences at level p < 0.01; italics - indicates significant differences at level p < 0.05; “ns” or no lettering/Highlighted in table - no significant differences.
Fig. 1. Chlorophyll content after 15 days of drought stress in four cowpea genotypes. Plant responses were measured on plants from which water was withheld (0% FC, severe drought stress), on plants with reduced irrigation (25% FC, moderate drought stress) and well-watered plants (75% FC, control). Values represent mean ± SEM (n = 6). Different uppercase letters indicate significant differences between treatments within the same genotype (ANOVA followed by Tukey’s test at p < 0.05). “NS” indicates non-significant differences.
proline content under severe drought imposition, more than two-fold when compared with other genotypes. Other well-studied plant re-sponse indicator to stress conditions is the production of anthocyanins that can also be considered as a tolerance mechanism in a number of abiotic stresses (including drought) (Kovinich et al., 2015). In our study, we did not detect significantly different levels of anthocyanin among the cultivars under unstressed conditions. Therefore, the only aspect that we considered was the role of anthocyanin as a stress in-dicator. The amount of leaf anthocyanins in all genotypes increased in response to drought stress imposition compared to the control plants (Fig. 2B), which agrees with studies on other crop plants (Efeoǧlu et al., 2009;Kovinich et al., 2015). Results also pointed to a higher suscept-ibility of Bambey 21 genotype to drought, due to the production of higher amounts of anthocyanins when compared to other genotypes. On the other hand, Cp5051 genotype presented the lowest values of anthocyanins production, suggesting that this genotype is less affected by drought condition. The highest sensitivity of Bambey 21 genotype to drought is in accordance with the detection of lipid peroxidation, as evaluated by MDA (Fig. 2C) content, and also H2O2(Fig. 2D)
produc-tion on leaves. One of the predicted consequences of stress is an in-crease of lipid peroxidation, mainly due to an overproduction of H2O2
(Anjum et al., 2011), as was detected in the two drought stressed conditions in comparison to control plants. Susceptible plants suffering from pronounced stress are described to present higher levels of MDA than more tolerant plants (Bacelar et al., 2006). Therefore, the higher level of lipid peroxidation in Bambey 21 genotype suggests a higher sensitivity of this genotype to drought stress, when compared to other genotypes. In contrast, Cp5051 and Vg50 genotypes competed for the lowest MDA accumulation values, revealing a better protection
mechanism against oxidative damage. These results are in agreement with H2O2production levels, which were more pronounced in Bambey
21 and CB46 genotypes (displaying 2.6-fold higher production under severe stress than control), while in the other two genotypes (Cp5051 and Vg50) significant differences were only observed under severe stress and only attained a difference of 1.6-fold. Although it is con-sensual that varieties/genotypes sensitive to water stress accumulate higher amounts of H2O2(Chakraborty and Pradhan, 2012), our results
suggest that non-stress plant levels should be taken into account on plant tolerance. The higher levels of H2O2 in Vg50 on well-watered
plants (75% FC) could play a determinant role for its higher drought-tolerance, due to the dual role of H2O2production.
From all studied plant responses, Bambey 21 was the genotype that presented the highest levels of biochemical stress indicators, such as MDA and anthocyanins, and the lowest amounts of the protective proline. These results are in agreement with other studies that referred Bambey 21 as a drought susceptible genotype using other methodolo-gies (Hamidou et al., 2007; Muchero et al., 2008). On the contrary, Cp5051 seems to be the least drought affected genotype, as evaluated by lowest MDA and anthocyanin levels under stress conditions. How-ever, Vg50 was the genotype that presented the most active defensive strategies, displaying the highest production of proline and basal H2O2
content (in non-stressed conditions).
3.3. Could the activity of antioxidant stress enzymes be used for screening cowpea drought tolerance differences?
In this work, a H2O2overproduction was detected with drought
stress intensity. This reactive oxygen species (ROS) plays different Fig. 2. Plant responses of four cowpea genotypes to drought stress. Proline (A), anthocyanins (B), MDA (C) and H2O2(D) contents were evaluated on leaves of plants
subjected to different drought stress treatments during 15 days: plants from which water was withheld (0% FC, severe drought stress), plants with reduced irrigation (25% FC, moderate drought stress) and well-watered plants (75% FC, control). Values represent mean ± SEM (n = 6). Different uppercase letters indicate significant differences between treatments within the same genotype (ANOVA followed by Tukey’s test at p < 0.05). Different lowercase letters indicate significant differences between genotypes in every water regimen (ANOVA followed by Tukey’s test at p < 0.05).
functions in plants: at higher concentrations causes oxidative damage and at lower concentrations initiates cell signaling (reviewed by Hossain et al., 2015). Plants display defensive mechanisms and bio-chemical strategies that allow to avoid damage caused by ROS. Their enzymatic defenses include many antioxidant enzymes, such as super-oxide dismutase (SOD), catalase (CAT), guaiacol peroxidase (POX), ascorbate peroxidase (APX), and glutathione reductase (GR), which together control ROS levels at adequate concentrations for cell function. Therefore, the study of oxidative stress and enzymes involved in ROS is fundamental for understanding the mechanisms that allow plants to adapt and survive during drought stress periods (Cruz de Carvalho, 2008) and at same time to identify the best adapted genotypes to stressful situations. Superoxide dismutase (SOD) has been considered as the first defense line against the accumulation of ROS under drought (You and Chan, 2015), but is also responsible for H2O2 production
through superoxide dismutation. The present work revealed a general trend for SOD activity increase with drought (Fig. 3A), which is in agreement with other results obtained in cowpea under drought stress (Merwad et al., 2018) and saline stress (Cavalcanti et al., 2004). However, significant changes were only detected in the Cp5051 geno-type. Several enzymatic pathways are responsible for scavenging H2O2,
such as catalases or the ascorbate-glutathione cycle that combines several enzyme activities, including APX and GR (Anjum et al., 2016). POX also protects cells against the destructive influence of H2O2,
de-composing it through the oxidation of phenolic and endiolic co-sub-strates (Van Doorn and Ketsa, 2014). In our work, well-watered plants presented, in general, higher values of CAT activity than plants under drought stress, although significant differences (p < 0.05) were only registered for Bambey 21 genotype (Fig. 3B). CAT activity results
contrast with the other assayed H2O2detoxifying enzymes as significant
differences were detected among well-watered genotype plants (p < 0.05, results not shown). These results suggest that the main en-zymatic process that controls the damaging H2O2produced by stressful
conditions does not involve catalase, but other detoxifying pathways. POX presented a significant increase after stress imposition, except for Vg50 genotype (Fig. 3C). Ascorbate–glutathione pathway enzymes (APX, GR) also presented an increasing trend with drought intensity, although significant increases were only detected for CB46 and Cp5051 genotypes, respectively (p < 0.05,Fig. 3D, E). Furthermore, Vg50 and Bambey 21 genotypes displayed limited increases on APX activity upon stress.
Previous studies on oxidative stress and antioxidant enzymes ac-tivities in response to drought showed inconsistent and contradictory results. In other cowpea studies,Cavalcanti et al. (2004)detected a CAT activity decrease after drought imposition (approximately 2-fold de-crease), whileNair et al. (2008)andMerwad et al. (2018)verified an increase of CAT activity with increasing water stress (1.8-fold and 2-fold increase, respectively). Different effects of water stress on APX and GR activities were also detected in different cowpea cultivars ( Contour-Ansel et al., 2006;D’Arcy-Lameta et al., 2006). The registered differ-ences in antioxidant enzymes activities can be associated to the distinct drought tolerance levels of cowpea genotypes, as well as to distinct stress imposition methodologies. Furthermore, ROS accumulation and antioxidant enzymes upregulation are considered to be directly related/ dependent on plant species, plant genotype, degree of plant tolerance, stress level, stress duration, plant development (Contour-Ansel et al., 2006;D’Arcy-Lameta et al., 2006;Harb et al., 2015).
Fig. 3. Antioxidant enzyme responses of four cowpea genotypes to drought stress. Superoxide dismutase (A), catalase (B), guaiacol peroxidase (C), ascorbate peroxidase (D) and glutathione reductase (E) activities were evaluated on leaves of four genotypes plants, subjected to three drought stress treat-ments, during 15 days. Plant responses were measured on plants from which water was withheld (0% FC, severe drought stress), on plants with reduced irrigation (25% FC, mod-erate drought stress) and well-watered plants (75% FC, control). Values represent mean ± SEM (n = 6). Different uppercase letters indicate significant differences between treatments within the same genotype (ANOVA followed by Tukey’s test at p < 0.05). Different lowercase letters indicate significant differences between genotypes in every water regimen (ANOVA Tukey’s test at p < 0.05). “ns” indicates non-significant differences.
3.4. Could gene-expression profiling be used to screen cowpea drought stress tolerance?
Besides biochemical markers, transcriptomic studies have been also considered as an important tool for studying plant responses to multiple abiotic or biotic stresses through the identification of genes, pathways and processes. Many cowpea genes have been indeed identified as being involved in drought (reviewed byCarvalho et al., 2017).
A total of thirteen genes with different functions were selected, based on previous studies, for gene expression analysis under drought stress conditions in four cowpea genotypes (Table 1) and their gene expression profiling was evaluated by semi-quantitative RT-PCR (Fig. 4A). All amplifications resulted in a single amplicon of the ex-pected length (Table 1).Fig. 4A presents the profiling by semi-quanti-tative RT-PCR of the thirteen genes in the two drought stress conditions (0 and 25% FC) compared to control (75% FC). A differential gene expression was observed for DG genes under water stress treatments, which mostly revealed a higher expression with drought stress in-tensification. Most of these DG genes also exhibited a low expression level in unstressed plants (collected before the start of the stress treatments; results not show). Differences among genotypes were de-tected with semi-quantitative RT-PCR. An increase of more than two-fold on the expression of some DG genes in water stress treatments (0 and 25% FC), mainly in Cp5051 (VuCPRD14, VuCPRD65, VuDREB2, and VuHsp17.7 genes) and also in Vg50 (VuHsp17.7 gene). In contrast, Bambey 21 and CB46 did not revealed an increase on the DG gene expression being the band intensity very similar between the control and the two water stress treatments. Five oxidative stress related genes (OG) were also evaluated by semi-quantitative RT-PCR (Fig. 4A). The
results did not reveal significant differences between genotypes and drought stress treatments, which is in agreement with antioxidant en-zymes activity results; however, in previous studies these OGs were reported to be highly expressed in susceptible cowpea genotypes comparatively to tolerant ones (Contour-Ansel et al., 2006; D’Arcy-Lameta et al., 2006). Some studies refer that APX and GR activities are much variable depending on water stress level and plant tolerance degree (Contour-Ansel et al., 2006;D’Arcy-Lameta et al., 2006). The reported differences in antioxidant enzymes activities can be associated to the distinct drought tolerance levels of cowpea genotypes, as well as to distinct stress imposition methodologies.
Based on RT-PCR genes profiling, two drought related genes, VuCPRD14 (Fig. 4B.1) and VuHsp17.7 (Fig. 4B.2), were selected for further expression analysis studies. Both genes have been described as being involved in abiotic stress responses and were previously reported to be up-regulated in cowpea leaves under drought stress (Da Silva et al., 2015;Iuchi et al., 1996;Simoes-Araujo et al., 2008). VuCPRD14 gene was characterized by Iuchi et al. (1996)being involved in the synthesis of different compounds, such as anthocyanin and medicarpin, which protect plant cells from stress conditions, having a role on de-hydration response (Guo et al., 1994;Iuchi et al., 1996). Accordingly, previous studies referred that VuCPRD14 gene is induced in cowpea leaves in response to progressive dehydration (Iuchi et al., 1996,2000). On the other hand, VuHsp17.7 gene was characterized by Simoes-Araujo et al. (2008), representing the first small heat shock protein class I encoding gene isolated from cowpea plants. This protein family plays a critical role in defense during many physiological stresses because they protect proteins from irreversible aggregation (Sun and MacRae 2005; Simoes-Araujo et al., 2008). Hsp17.7 gene was shown to be Fig. 4. Gene expression of four cowpea geno-types to drought stress. (A) Gene expression profile by semi-quantitative RT-PCR of five genes related to drought imposition (DG), five genes related to oxidative stress (OG) and three reference genes (RG), evaluated after sub-jecting plants from four cowpea genotypes to different water treatments. Gene expression was determined in plants from which water was withheld (0% FC, severe drought stress), in plants with reduced irrigation (25% FC, mod-erate drought stress) and well-watered plants (75% FC, control), during 15 days. Stress se-verity is indicated by a triangle, from control to severe stress. (B) Effect of the same drought stress treatments in the expression of two drought-related genes (B.1 - VuCPRD14 and B.2 - VuHsp17.7), as evaluated by qPCR. The relative expression levels were obtained after normalization with the expression of VuEF1α and VuPp2A reference genes. Values are the mean ± SEM (n = 4). Different uppercase letters indicate significant differences between treatments within the same genotype (ANOVA followed by Tukey’s test at p < 0.05). Different lowercase letters indicate significant differences between genotypes in every water regimen (ANOVA followed by Tukey’s test at p < 0.05). “ns” indicates non-significant dif-ferences.
upregulated in drought-tolerant cultivars from different crops under water deficit conditions (Sato and Yokoya, 2008;Temel et al., 2017). For comparison, VuEF1-α and VuPp2A genes were selected as reference genes due to their stability under drought stress conditions (Da Silva et al., 2015;Weiss et al., 2018). Gene expression analysis by qPCR re-vealed that both DG genes were mostly expressed at 25% and 0% of FC treatments (Fig. 4B), being clear their association with cowpea drought response. VuCPRD14 gene expression was significantly higher (p < 0.05) in Cp5051 genotype. VuHsp17.7 gene was predominantly ex-pressed under severe (0% FC) and moderate drought stress (25% FC), with significant differences in the genotypes Cp5051 and Vg50, with drought stress intensity. High expression levels of VuCPRD14 and VuHsp17.7 drought-related genes detected under severe drought con-ditions can be an indication that Cp5051 genotype could be considered as the most drought-tolerant. Due to the described roles of VuCPRD14 and VuHsp17.7 genes against water stress, both genes can be considered suitable markers to drought stress tolerance.
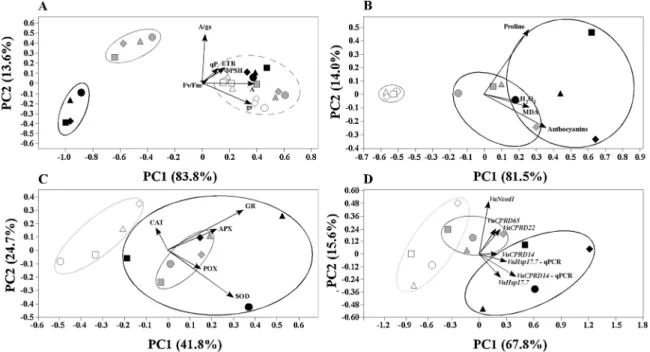
3.5. How can genotypes be discriminated?
In last years, many methods for evaluating and discriminating cowpea genotype drought tolerance have been developed (Cavalcanti et al., 2004;Merwad et al., 2018;Singh and Raja Reddy, 2011). In order to compare different approaches, cowpea plants from distinct genotypes were subjected to the same drought conditions and assayed for different physiological, biochemical and molecular aspects. The inconsistent outcomes of these assays led us to search for the best approaches for identifying (sometimes subtle) different drought responses. To further understand the quantitative relations between each parameter and determine their contribution to genotypes drought tolerance, principal component analysis (PCA) performed for each set of parameters under study (Fig. 5). Physiological parameters have been frequently used for
selecting water stress tolerant cowpea genotypes (Kutama et al., 2014; Singh and Raja Reddy, 2011;Souza et al., 2004) and can become in-dicator of the crops responses to drought stress (Zu et al., 2017). A clear discrimination of stress severity is obtained when using all assayed physiological parameters (gas exchange and photosynthetic para-meters;Fig. 5A). The first two principal components of PCA explained 97.4% (PC1 = 83.8% and PC2 = 13.6%) of total variation. All well-watered control plants clustered together with plants with only one day of stress imposition, revealing that these are not suffering from water privation. However, as drought treatment proceeds, a clear dis-crimination of plant physiological parameters is observed. From all physiological parameters, those related with stomatal function (A, gs and A/gs) contributed the most for this discrimination. PCA also
sug-gested Cp5051 genotype, followed by CB46 genotype, as the less af-fected genotypes based on their proximity with control group, and Vg50 genotype as the most susceptible.
Regarding the proline, anthocyanins, MDA and H2O2contents, a
clear discrimination of plants under drought stress imposition was also obtained (Fig. 5B). The first two principal component of PCA explained 95.5% (PC1 = 81.5% and PC2 = 14.0%) of total variation. Genotype plants in control conditions were more clustered together than corre-sponding stressed plants, which could be probably due to the differ-ential response of each biochemical parameter/genotype in each stress situation. From all, anthocyanin and proline contents were the two parameters that contributed the most for biochemical discrimination among stressed plants. Although not so evident as physiological para-meters, this analysis also suggested Cp5051 genotype as the less af-fected by drought, being always closer to control plants. The use of several biochemical markers have been recurrently used for studying plant responses to drought stress (Anjum et al., 2011;Toscano et al., 2016;Zhou et al., 2006), as well as the evaluation of antioxidant en-zyme activities (Anjum et al., 2016;Cavalcanti et al., 2004;Merwad
Fig. 5. Principal component analysis (PCA) for discriminating drought responses and genotype differences. (A) Gas-exchange and photosynthetic parameters. PCA was performed taking into account the following parameters: gs, A, A/gs, Fv/Fm, ΦPSII, qP and ETR. (B) Biochemical markers of drought stress. PCA was performed
using the results from proline, anthocyanin, MDA and H2O2contents. (C) Antioxidant enzymes activity. The analysis was conducted using the results of CAT, SOD,
POX, APX and GR activities. (D) Expression of related genes. PCA was performed using the expression data obtained from RT-PCR and qPCR of five drought-related genes (VuCPRD14, VuCPRD22, VuCPRD65, VuHsp17.7 and VuNced1). For (A), cowpea genotypes were exposed to two different water regimens (0% FC and 75% FC) and parameters were determined in three different days. Each day corresponds to a different color (white – day 1; gray – day 10; black – day 15). For (B to D), plants from different cowpea genotypes were exposed to three different water regimens (white - well-watered; gray – moderate drought stress; black - severe drought stress) and parameters were determined after 15 days of stress imposition. Genotypes correspond to different shapes (Cp5051 - circle; Vg50 - square; Bambey 21 – diamond; CB46 – triangle). Arrows indicate eigenvectors representing the strength (given by the length of the vector) and direction of the parameter correlation relative to the first two principal components (PC1 and PC2).
et al., 2018;Singh and Raja Reddy, 2011;Toscano et al., 2016). In this study, a clear discrimination of plants under different drought stress severities or among genotypes was not obtained by determination of antioxidant enzyme activities (Fig. 5C). The first two principal com-ponent of PCA explained 72.8% (PC1 = 48.1% and PC2 = 24.7%) of total variation. GR and SOD were the enzymes that mainly contributed for genotypes discrimination and control plants (75% FC) clustered in a separate group. Drought stress plants were randomly distributed and were not grouped in any distinct group, suggesting that antioxidant enzymes did not allow to evaluate differences between genotypes or even among different drought stress levels. Many genes were re-cognized as being involved in drought responses and have been used for discerning the drought responses of different cowpea genotypes. In this work, gene expression data (semi quantitative RT-PCR results; Fig. S1) allowed the discrimination of different drought stress treatments. The first two principal component of PCA explained 83.4% (PC1 = 67.8% and PC2 = 15.6%) of total variation (Fig. 5D). The expression of VuCPRD14 (by semi quantitative RT-PCR) and VuNced1 (by qPCR) were the most relevant for plant/drought stress discrimination. Gene ex-pression analysis did not allow identifying any relation between drought responses and genotypes.
Altogether, the results revealed that gas exchange parameters (A, gs and A/gs) and some biochemical markers of drought stress (mainly
proline and anthocyanins) are the most informative for discriminating cowpea genotypes on their drought responses. Physiological and bio-chemical parameters suggested Cp5051 genotype as the less affected genotype by drought, followed by CB46, while the Vg50 and Bambey 21 genotypes were the most susceptible to drought. However, we should remember that drought is a complex trait and plant responses can occur at different levels (Agbicodo et al., 2009;Fang and Xiong, 2015). In drought tolerance, plants sustain a certain level of physiolo-gical activities through the regulation of thousands of genes and me-tabolic pathways to reduce or repair the resulting stress damage (Mitra, 2001; Fang and Xiong, 2015) being a multifaceted feature. Conse-quently, in some cases the genotype considered as tolerant is not always superior or performs better than the considered sensitive. For example, besides being considered as the most tolerant genotype, Cp5051 re-vealed a lower performance at Fv/Fmparameter and chlorophyll and
H2O2contents.
4. Conclusions
Global warming has been an increasing problem, further enhanced by frequent drought stress events, both in duration and intensity. The study and search for crops with some drought tolerance could be an important issue for a near future. Cowpea has several agronomic fea-tures that turn this crop naturally adapted to these future constrains. For this reason, the knowledge of physiological, biochemical and ge-netic responses of cowpea to drought stress is fundamental and re-quired. In this work, a severe and moderate drought stresses were im-posed to cowpea plants from four genotypes. Physiological, biochemical and molecular parameters indicated that assayed plants were indeed under drought stress and revealed different genotype trends. The Bambey 21 and Vg50 genotypes revealed a low efficiency of water use, contrasting with the moderately susceptible CB46 and Cp5051 geno-types. On the other hand, Cp5051 seems to be the least drought affected genotype, as revealed by biochemical and molecular parameters. Discrimination of cowpea genotypes was better achieved by comparing physiological aspects, mainly those related with stomatal function, and some biochemical markers, such as proline and anthocyanin contents. This finding could be of importance when cowpea genotypes need to be compared, simplifying survey protocols. The set of genes used in this study and antioxidant enzymatic activity assays did not seem to give much information about cowpea drought responses. Indeed, in this work, the scavenging enzymes (SOD, CAT, POX, APX and GR) were not involved in the ability of cowpea plants to survive under higher levels
of drought stress. At the end, this work provided useful and valuable information for cowpea genetic resources management and for de-signing national and international strategies for cowpea genotype se-lection better adapted to drought stress.
Declaration of Competing Interest
The authors declare that the research was conducted in the absence of any commercial or financial relationships that could be construed as a potential conflict of interest.
Author statement
VC, MM and TLN conceived and designed the whole experiment. MC, VC and MM conducted the glasshouse experiment. JMP and CC performed the IRGA and PAM measurements. MC performed the la-boratory experiments. MC and TLN analysed the data. MC drafted the manuscript. VC, JMP, CC, MM, IC, MEC, ER, TLN revised the script. All authors read and approved the final version of the manu-script.
Funding
This study was supported by EUROLEGUME project. This project has received funding from: the European Union’s Seventh Framework Programme for research, technological development and demonstration under grant agreement no 613781; National Funds by FCT – Portuguese Foundation for Science and Technology, under the project UID/AGR/ 04033/2019; and the project PEstOE/BIA/UI4046/2014; UID/MULTI/ 04046/2013.
Acknowledgments
The authors would like to thank the National Institute for Agrarian and Veterinarian Research (INIAV, Portugal) and Professor Timothy J. Close from University of California Riverside for providing cowpea seeds. We would also like to thank spectrophotometer equipment pro-vided by Prof. Virgílio Falco and Prof. Ana Coimbra. MC would like to thank Doctor Luis Felix the help on management of Powerwave XS2 equipment.
Appendix A. Supplementary data
Supplementary material related to this article can be found, in the online version, at doi:https://doi.org/10.1016/j.jplph.2019.153001. References
Aebi, H., 1983. Catalase. In: Bergmeyer, H.U. (Ed.), Methods of Enzymatic Analysis. Chemie, Weinhem, pp. 273–286.
Agbicodo, E.M., Fatokun, C.A., Muranaka, S., Visser, R.G.F., Linden Van Der, C.G., 2009. Breeding drought tolerant cowpea: constraints, accomplishments, and future pro-spects. Euphytica 167, 353–370.https://doi.org/10.1007/s10681-009-9893-8. Anjum, N.A., Sharma, P., Gill, S.S., Hasanuzzaman, M., Khan, E.A., Kachhap, K.,
Mohamed, A.A., Thangavel, P., Devi, G.D., Vasudhevan, P., Sofo, A., Khan, N.A., Misra, A.N., Lukatkin, A.S., Singh, H.P., Pereira, E., Tuteja, N., 2016. Catalase and ascorbate peroxidase – representative H2O2-detoxifying heme enzymes in plants. Environ. Sci. Pollut. Res. 23, 19002–19029. https://doi.org/10.1007/s11356-016-7309-6.
Anjum, S., Xie, X., Wang, L., 2011. Morphological, physiological and biochemical re-sponses of plants to drought stress. Afr. J. Agric. Res. 6, 2026–2032.https://doi.org/ 10.5897/AJAR10.027.
Apel, K., Hirt, H., 2004. Reactive oxygen species: metabolism, oxidative stress, and signal transduction. Annu. Rev. Plant Biol. 55, 373–399.https://doi.org/10.1146/annurev. arplant.55.031903.141701.
Arnon, D.I., 1949. Copper enzymes in isolated chloroplasts. Polyphenoloxidase in Beta vulgaris. Plant Physiol. 24, 1–15.https://doi.org/10.1104/pp.24.1.1.
Bacelar, E.A., Santos, D.L., Moutinho-Pereira, J.M., Gonçalves, B.C., Ferreira, H.F., Correia, C.M., 2006. Immediate responses and adaptative strategies of three olive cultivars under contrasting water availability regimes: changes on structure and chemical composition of foliage and oxidative damage. Plant Sci. 170, 596–605.