ELSEVIER
Joumul of Food~ngineen'ng28(1996) 179-202 Copyright 0 1996 Elsevier Science Limited Printed in Great Britain. All rights reserved 0260-8774/96,/$15,Ol1 0260-8774(95)00035-6
Modelling the Wansport of Lactic Acid, Sodium Chloride
and Reducing Sugars in Carrot Slices Submerged in Brines
-
Part II. Multivariate Approach
Regina M. Nabais’ & F. Xavier Malcata”
Escola Superior de Biotechnologia, Universidade Catblica Portuguesa Rua, Dr. Antcinio Bernardino de Almeida, 4200 Porto, Portugal
(Received 13 June 1994; accepted 6 May 1995)
ABSTRACT
In this papel; following a methodology of (nested) increasing model complexit>i, it was found that the apparent dijj%sivities and the partition coefficients associated with the transport of lactic acid and sodium chloride from the bn’ne into carrot slices submerged therein can be modelled as functions of temperature using Arrhenius-type relationships and as exponential functions of the initial concentrations of either solute in the brine. The apparent diffusivities in the free liquid phase, in the case of transport of reducing sugars from the carrots to the brine, are assumed to vary with time as a consequence of the bursting of the carrot cells following first-order kinetics on both the concentration of intact cells and dead cells. In this case, and following a similar methodology, the apparent diffusivity in the free liquid phase, the pseudo-first- order rate constant for cell bursting, and the partition coefficients are well modelled when they are all assumed to follow temperature dependencies given by Arrhenius-type relationships; the dependencies on the initial concentration of salt in the brine were found not to be statistically significant. The underlying assumptions of normal distribution and constant variance were checked using plots of residuals, whereas the decision on the acceptable complexity of the nested models was taken based on the values of the F-distribution. The analysis developed is relevant for practical purposes because the multivariate models obtained in the form of correlations are simple functions of easily measured operating van.ables. Copyright 0 1996 Elsevier Science Limited.
‘Current address: Escola Superior Agrbia, S. Martinho do Bispo, 3000 Coimbra, Portugal. *Author to whom all correspondence should be addressed.
180 R. M. Nabais, lT X. Malcata NOTATION
C
x,0 C x,tot Dap,f,a D ap,f,r D ap,f,s KiKS
VC Jfl x CfO Xl x2 5: P2 YO Yl Y2Area of each exposed surface of the carrot slice (cm’) Concentration of acid in the carrot material (% w/v) Volume-averaged concentrations of acid (% w/v)
Volume-averaged concentration of acid in carrot material in equilibrium with the brine (% w/v)
Constant concentration of reducing sugars in carrot material (% w/v) Concentration of salt in the carrot material (% w/v)
Volume-averaged concentrations of salt (% w/v)
Volume-averaged concentrations of salt in carrot material in equilibrium with the brine (% w/v)
Initial concentration of acid in brine (% w/v)
Constant concentration of acid in carrot material (% w/v) Initial concentration of salt in brine (% w/v)
Constant concentrations of salt in carrot material (% w/v) Concentration of reducing sugars in brine (% w/v)
Concentration of reducing sugars in brine in equilibrium with carrot material (% w/v)
Concentration of intact carrot cells at start-up of experiment (g/cm”) Total concentration of carrot cells in carrot material (g/cm3)
Apparent diffusivity of acid in the fluid imbedded within the carrot (m’is) Apparent diffusivity of reducing sugar in the fluid imbedded within the carrot (m”/s)
Apparent diffusivity of salt in the fluid imbedded within the carrot (m’/s) Partition coefficient of acid between the brine and the carrot material defined as C,,,,lCi,,,, (70 w/v/% w/v)
Second-order rate constant for bursting of carrot cells (cm3/g/h)
Partition coefficient of reducing sugar between brine and carrot material defined as
C,,,lC,,,,
(% w/v/%
w/v)
Partition coefficient of salt between brine and carrot material defined as C c,s,&l,r,z_ (% w/v/% w/v)
Half-thickness of the slice (cm)
Non-negative eigenvalues of tan(q,,) + i2z,q,,n =0
Non-negative eigenvalues of tan(q,,) + Q,qr,ll =0 Non-negative eigenvalues of tan(q,,n) + Qsqs,, =0
Time elapsed after submersal of carrot slices in brine (h) Volume occupied by carrot (cm”)
Volume of brine (cm3)
Coordinate along the direction of diffusional flow (cm) Auxiliary parameter (m*/s) Auxiliary parameter (m’K/s) Auxiliary parameter (m”/s (% w/v)) Auxiliary parameter Auxiliary parameter (K) Auxiliary parameter (/(%w/v)) Auxiliary parameter (/s) Auxiliary parameter (K/s) Auxiliary parameter (s. (% w/v))
Modelling the transport of lactic acid 181
Mass density of carrot material (g/cm”) Mass density of brine (g/cm”)
Viscosity of brine (kPa* s)
Auxiliary parameter, defined as I/,/(24&&) Auxiliary parameter, defined as I’&Y!&L,K,) Auxiliary parameter, defined as V@4,L&)
INTRODUCTION
The transport of components from vegetables tissues into aqueous solutions is technologically important in the case where vegetables are subject to washing prior to packaging for consumption as fresh foods, and in the case where long-term preservation of vegetables is obtained at the expense of acid produced from such components by native (or deliberately added) micro-organisms (Potts et al., 1986). The preparation of lactic acid pickles from carrot slices, which falls within the latter situation, has been studied in the past by a number of authors and is also the focus of our interest here. Since most approaches refer to high temperature processes (say, above 50°C) for which the conditions of validity of Fick’s law of diffusion hold, difficulties have been experienced when trying to predict the diffusion behaviour at room temperatures (say, between 15 and 30°C) for which physiological processes (post-harvest vegetables are still living systems to some extent for a certain time) play a role in addition to molecular transport.
Although at relatively high temperatures the effect of temperature on the diffusivities is well described by Arrhenius law (which is a consequence of the strong dependence of the diffusivity on the reciprocal of the liquid viscosity, which in turn varies in an approximately exponential fashion with the absolute temperature
(Oliveira, 1988)) results obtained at low temperatures for a variety of vegetable materials also follow such empirical, classical dependency (Jowitt et al., 1982; Beristain et al., 1990; Moreira et al., 1992). In addition to temperature, the concentration of solutes affects their rates of transport between brines and submerged vegetables, and arguments based on the role of the structure of the vegetable tissues on such rates have been proposed (Soddu & Gioia, 1979; Potts ct al., 1986; Kincan & Kaymak, 1987; Oliveira & Silva, 1992). Leaching of a component from a vegetable (which may be viewed as a solid matrix) into a solution is intimately related to solubilization (Pflug et al., 1967; Schwartzberg, 1975), because the driving force for mass transfer is directly affected by the position of the equilibrium (Oliveira, 1988; Biswall & Maguer, 1988).
In the lirst paper of this series (Nabais et al., 1996) it was statistically established that the molecular transport at various temperatures and initial concentrations of lactic acid and of sodium chloride from a brine into carrot slices submerged therein could be simulated from first principles on the assumption that the apparent diffusivity and the partition coefficient were constant for each set of operating conditions. In the case of the transport of reducing sugars in the opposite direction, the best model found in statistical terms corresponded to the assumptions that the apparent diffusivity was a function of time through a first-order rate process on the concentration of intact carrot cells inhibited by a first-order process on the concentration of burst carrot cells, and that the partition coefficient was a constant for each set of operating conditions. In this paper, the dependence of such
182 R. M. Nabak, E X. Malcata
parameters on the operating variables (i.e. the temperature and initial concentration of solutes in the brine) is taken one step further by postulating empirical dependencies and testing them for significance on statistical grounds.
EXPERIMENTAL WORK
The experimental details pertaining to the preparation of the brines, performance of diffusion experiments, analysis of sodium chloride, reducing sugars and lactic acid were given in the first paper of this series (Nabais et al., 1996). The viscosity was determined with an Ostwald viscometer under isothermal conditions. The mass density was determined under isothermal conditions using the classical glass picnometer method.
EXPERIMENTAL RESULTS
The longitudinal distribution of reducing sugars in a typical carrot is depicted in Fig. 1. The values obtained for the average concentration of reducing sugars for various carrots are depicted in Fig. 2. The values of mass density and viscosity of the brines
Fig. 1. Longitudinal distribution of reducing sugars in a typical carrot.
k?
1.5, ...1....1 .. I..,.I....I.Modelling the transport of lactic acid 183
TABLE 1
Physical properties of the brines
Temperature
(“C)
Salted brines (% (wlv)) Acidified brines (% (wlv))
5 10 15 20 0.5 I 2 1.05 1.03 1.02 1.02 1 .a0 1.26 1.32 1.46 1.19 I .28 1.31 1.11 1.19 1.27 1 .a7 1.16 1.20 1.02 1.09 1.12 1.09 1.09 1 .a5 1 .a3 1.02 1.11 1.10 1.07 1 .a5 1 .a5 1.17 1.14 1.13 1.12 1.08 1.71 1.29 1.68 1.42 1.30 1.42 1.32 1.14 1.33 1.29 1 .a7 1.27 1.14 0.95 0.99 142 1.02 1.02 1.01 0.99 1.07 1.05 1.04 1 .a2 0.99 1.11 I.10 1.04 1 .a4 1.02 1.74 I .48 1.45 1.34 I.15
are depicted in Table 1, whereas plots of the apparent diffusivities vs these physicochemical quantities are available as Fig. 3 and Fig. 4.
Mathematical analysis
Each carrot slice is assumed to behave as an infinite slab of uniform material of thickness Z, submerged in a well stirred solution. Under these circumstances, Nabais et al. (1996) have previously shown that the mass balances of acid and salt within the carrot material which best fit the experimental data taken at various temperatures and initial concentrations of acid and salt take the following integral form: s L Cc,akt) dx C’,,.(t)= 0 2R,( 1 i- R,) s L =c,.,, l- c dx ( n=l l+R,+s&& exp - i &n&p,f,a L,z 0 (1) and s L CAx,tJ dx C’,,,(r) = (’ L dx exp {_ “L;W.:)) 0 (2)
respectively. In eqn (1) and eqn (2) C, a and C,, are the volume-averaged concentrations of acid and salt, respectively, ‘in the carrot material; C,,, and C,,, are the concentrations of acid and salt, respectively, in the carrot material; x is the coordinate along the direction of diffusional flow (x=0 at the centre of the carrot slice); t is the time elapsed upon submersion of the carrot slices in the brine: C,,;,,,
184 R. M. Nabais, I? X. Malcata
and CC,,,, are the volume-averaged concentrations of acid and salt, respectively, in the carrot material in equilibrium with the brine (i.e. the average concentrations in the carrot observed after a long period has elapsed); 9, and !& are defined as VJ (2&L&) and V,I(24,L,K,), respectively, where V, is the volume of the brine, A, is the area of each exposed surface of the carrot slice, and K, and KS are the partition coefficients of acid and salt, respectively, between the brine and the carrot material; and qa,,, and qS,,, are non-negative eigenvalues of tan(q,,,) + sZ,,,q,., =0 and tan(q,,,l) + QqS,, =O, respectively. The best estimates of parameters pDap,r+ and PD ap,r,s are graphically depicted in Fig. 5 and Fig. 7(a), respectively.
In a similar fashion, the same authors have shown that the mass balances to reducing sugars within the brine take the following integral form:
G,rw=G,r,cc
(
1- c O” 2cql +Q) (“+(1-E) n=l 1 +Q+@d,, Cx,tot expGW~,tott~ > 7 ~q:nD,,,r..ik,Cx.~,,t(l --cxsJG.,<x)L; > (3) where Ci r is the concentration of reducing sugars in the brine, Cl,r,oo is the concentration of reducing sugars in the (well stirred) brine in equilibrium with the carrot material, Sz, is defined as I/,/(2&5&) (where K, is the partition coefficient of reducing sugar between the brine and the carrot material, CX,, is the concentration10.0 - a 10.0 2 $ 9.8 b % 618 0 0 00 0 AA A Oo Cl , 1.1 1.3 1.6 I II, 2
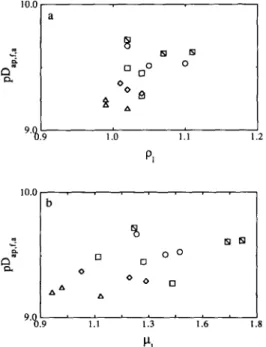
Fig. 3. Plots of the apparent diffusivity of acid (in logarithmic form), pDap,r+, vs (a) the initial mass density, p, at 15 ([II), 20 (o), 30 (II), 40 (o), and 50°C (A), and (b) the initial
Modelling the transport of lactic acid 185
of carrot cells that were intact at the start-up of the experiment, C,,,,,, is the total concentration of carrot cells in the carrot material, k, is the second-order rate constant for the bursting of the carrot cells and qr,,, are non-negative eigenvalues of tan(q,,) + %q,, =O. The best estimates obtained for parameters pDap,r,, and p(k,C,,,,,) are graphically depicted in Fig. 9(a) and Fig. 11(a), respectively.
The saturation concentrations (viz. C,,,, C,,,, and Cl,_) are constrained in each case by a material balance to the species in question partitioned between a liquid phase (i.e. the brine) and a solid phase (i.e. the carrot). However, recalling the definitions of the partition coefficients (viz. K,=C,,,.,/C,,,,,, K,=C,,,, -//C,,,, , and K=C,,, JCL, %, where CL,, TI and CL,, are the constant concentrations of acid and salt, respectively, in the carrot maternal and C,,,, is the constant concentration of reducing sugars in the carrot material, all after a long period has elapsed and equilibrium conditions have been reached), one obtains, following some algebraic rearrangement, the following relationships:
K,=
cc,,,
I CI.a.u-(Pc~JV)C,,.. , 10.0 22
9.0
8.0 ( 1.9 10.0 c%$
9.0
F3.q I.5 a b lv 0 00 q 61 q OO hl A 0 0 A‘3 0 oo 0 A I I.1 1.3 1.5 1.7 4(4)
(5)
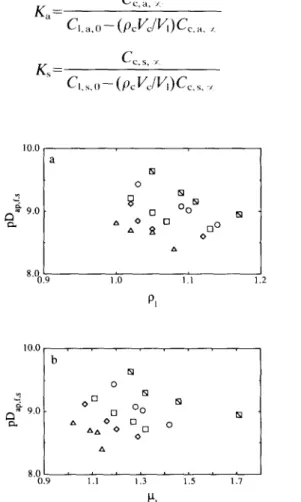
Fig. 4. Plots of the apparent diffusivity of salt (in logarithmic form), PD~~,~,~, vs (a) the initial mass density, pl, and (b) the initial viscosity, p,, of the brine, at 15 (IQ), 20 (g), 30 (n),
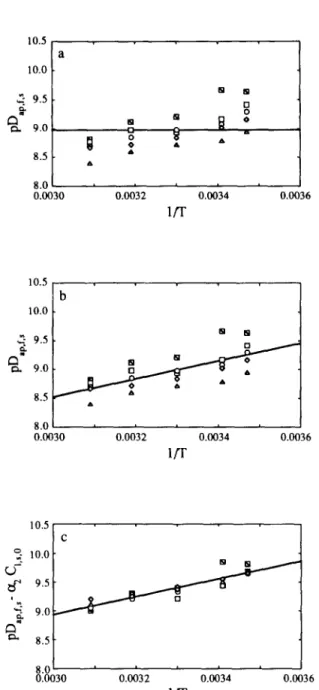
186 R. M. Nabah, I! X. Malcata a 10.0 I 8.5 8.0 0.0030 0.0032 0.0034 0.0036 l/r 8.OL 0.0030 0.0032 0.0034 0.0036 l/r
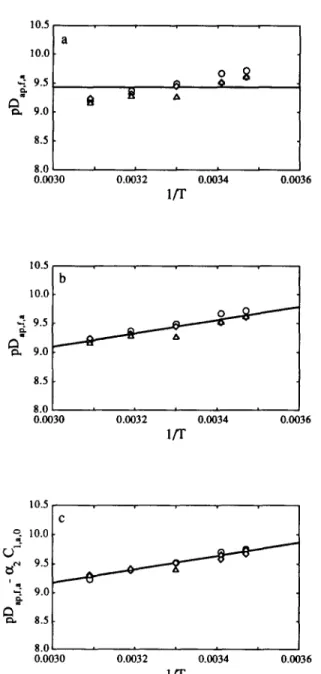
Fig. 5. Plot of the apparent diffusivity of acid (in logarithmic form), PD~+,~,~, vs the reciprocal absolute temperature of the brine, l/T, using (a) Model 0, (b) Model 1 and (c) Model 2 in eqn (1). The points are the estimates of the parameter in question obtained from non-linear regression fit to the data obtained at 0.5% (o), 1% (o), and 2% (A) (w/v) of acid
Modelling the transport of lactic acid 187 _
WlPc1/,)
K
cc.r.
I_Cc,r.o-Cc,r,
Iwhere pc is the mass density of the carrot material, V, is the volume occupied by the carrot, and C,,a,O and Cl,s,o are the initial concentrations of acid and salt, respectively, in the brine. Average values for the yhysicochemical quantities are as follows: oc.= 1.112 g/cm”; I’,=50 cm”; 1/,=6.7 cm-; and Cl,a,,, and Cl,s,O are equal to 0.5, I.0 and 2%, or to 5.0, 75, 10, 15 or 20% (w/v), respectively, depending in each case on the preparation of the brines (Nabais et al., 1996). The reason why the K, appears normalized by C,,, in eqn (6) rather than isolated, as happens with K, and K, in eqn (4) and eqn (5), respectively, derives from the observation that the variabilities of initial sugar content within the same carrot (see Fig. 1) and from carrot to carrot (see Fig. 2) are very large (remember that C,,,, X correlates positively with Cc,r,O)r which contrasts clearly with the fact that C,,,, and C,,,. x are much less variable (because the brines are deliberately prepared to a given concentration and not a function of a natural metabolism). The best estimates of parameters pK,,, pK, and pK, are graphically depicted in Fig. 6(a), Fig. 8(a) and Fig. 10(a), respectively.
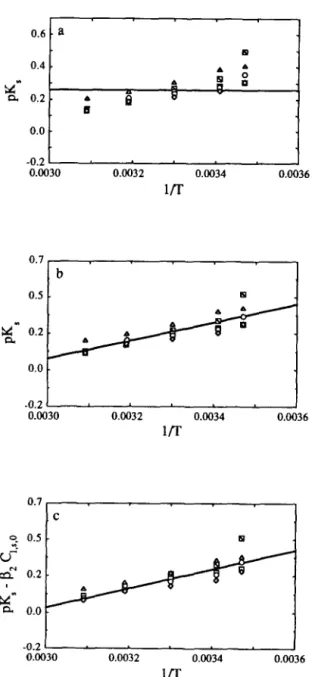
Since, as shown before (Nabais et al., 1996), the above models provide the best statistical fit to all experimental data sets when considered independently at each temperature and solute concentration, the question may be raised as to whether a continuous dependence of the estimated parameters on temperature and initial solute concentration in the brine are also statistically significant. Hence, nested forms (of increasing complexity) of the above models were considered. In all cases, Model 0 (the base model) corresponds to the assumption that no relation exists linking the parameter in question to the operating variables (i.e. Model 0 provides a test for a constant value irrespective of the operating conditions). Model 1 encom- passes a temperature dependence based on the classical Arrhenius-type dependency for the diffusivities, the rate constants and the partition coefficients. For the dependence of the various parameters on the concentrations of either acid or salt there is no obvious rationale. However, inspection of Table 1 coupled with Fig. 1 and Fig. 2 indicates that approximate linear relationships of pD,,,r,, on either the mass density or the viscosity of the brine (which is in turn a function of the solute concentration) can be obtained, and that such relationships have approximately the same slope irrespective of the temperature utilized (although lower temperatures lead to a decrease in the vertical intercept). For these reasons, linear relationships of PD_,~,~, (i=a,s,r) and, for the sake of generality, also of p(Ki) (i=a,s), p(K,IC,,,., , ) and p(K; CX,&, on the initial concentrations of solutes were tentatively postulated, thus forming the basis of Model 2. Parameter CX,,/CX,tot, which appears in eqn (3) and is a measure of the initial degree of cell integrity of the carrot material, was left out of this modelling effort because it is a function of a variety of factors which are out of the control of the experimenter, namely the time elapsed and the storage conditions since harvest (i.e. such parameter cannot be considered an intrinsic property of the carrot material); furthermore, inspection of the best estimates of this parameter (Nabais et al., 1996) has indicated that such parameter may in most cases be assumed to be virtually equal to unity.
188 R. A4. Nabais, E X. Malcata 0.4 .a 0.2 o 2 g A 0.0 . A 0 0 0 0" .0.2 . .0.4 . 0.0030 0.0032 0.0033 0.0034 0.0036 lfl .b 0.2 . -0.2 . 0.0030 0.0031 0.0032 0.0033 0.0034 0.0035 0.0036 l/T -04t 0:0030 0.0032 0.0034 0.0036 l/r
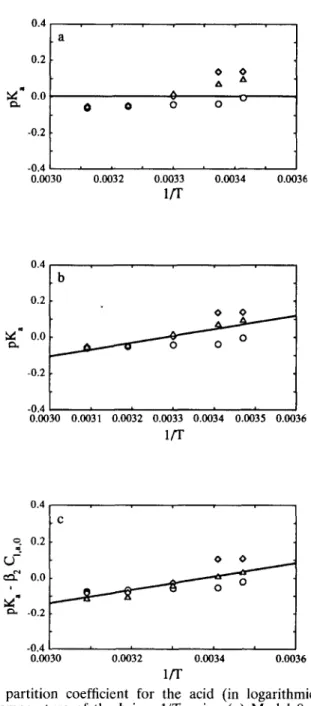
Fig. 6. Plot of the partition coefficient for the acid (in logarithmic form), pK,, vs the reciprocal absolute temperature of the brine, l/T, using (a) Model 0, (b) Model 1 and (c) Model 2 in eqn (1). The points are the estimates of the parameter in question obtained from non-linear regression fit to the data obtained at 0.5% (o), 1% (o), and 2% (A) (w/v) of acid
Modelling the transport
of
lactic acid 189Model 0
The values of pD ap,f,a, p&,f,s, p&,f,r, pL pK, p(KG.~,-~ ) and p(kC~,,~,,) are independent of the temperature and the initial concentration of salt or acid, viz.
pDap,f,i=X~]; i=a,s,r (7) p Ki=P,,; i=a,s (8) p(KIC,,. r >=Po (9) and p(k’Cx,,,,,)=;‘o ( 10) Model 1
The values of pDap.f,a, p&p.f,s, P&~,c, pK,, pK,, p(KIC,,,. , ) and p(k; Cx,tc,,) are dependent on temperature according to an Arrhenius-type, or van’t Hoff type, relation and are independent of the initial concentration of either acid or salt in the brine, viz. (11) i=a,s (12) and
p(k,.C,.,,,,)=~,,+;~, j
0
( 14) Model 2The values of pDap,f+, pkp,f+,, p&p,f,s, PD~+,~, PK,, pK, p(KG, I :I and p(k,. Cx,,,,) are dependent on temperature according to an Arrhenius-type relation and are linearly dependent on the initial concentration of either acid or salt in the brine, viz.
1
P&,,f.i = %, + Xl
0
7 + azCj,i,(j; i=a,s1 PnqLf,r=% + Ml 0 r + %Cl,s.O (15) (16) (17)
190 R. M. Nabais, F X. Malcata P(WCW0) =Po + P1 0 $ + P2Cl,s,O and 1 P(k,.CX,,0J=yo+yl
0
r + Y2G,s,”(18)
(19)
STATISTICAL ANALYSISThe estimates of the parameters obtained previously (Nabais et al., 1996) were fitted using minimization of the sum of squares of the weighted residuals through non- linear regression to the linearized forms of the models. The weights utilized were in each case equal to the number of degrees of freedom for the parameter in question. The fitted lines are plotted in Fig. 5(a), Fig. 6, Fig. 7, Fig. 8, Fig. 9, Fig. 10 and Fig.
11(c). The normality of the residuals and the constancy of their variance were checked via plotting of the residuals vs the percentiles of a normal distribution, and via plotting of the estimates of variance vs the fitted values. The results of the non- linear regression analyses in terms of parameter estimates associated with the various models are tabulated in Table 2. Extra residual sum of squares analyses pertaining to Models 0 and 1, on the one hand, and Models 1 and 2, on the other, are depicted in Tables 3 and 4, 5, 6, 7, 8 and 9, for transport of acid, salt and reducing sugars, respectively.
DISCUSSION AND CONCLUSIONS
It should be pointed out that the Kis (i=a,s,r) enter eqn (1) eqn (2) eqn (3) in three ways: (i) through the definition of the $s; (ii) through the equation defining the eigenvalues qi,ns (again due to the definition of the Qs); and (iii) through the overall mass balances encompassing the Cc,i,Es (i=a,s) or Cl,r,oo (as appropriate). However, in the range of parameter values of interest for our situation, the functional dependence of the C,i,, on the Kis is strong, whereas the functional dependence of the Qs on the Kis is weak, and the functional dependence of the qi,ns on Kis is even weaker. Therefore, to a very good numerical approximation, eqn (4), eqn (5), eqn (6) yield the only relationships encompassing the Kis which are numerically significant, and were so considered thereafter. This statement is also confirmed in statistical terms because attempts to estimate the Kis from fits to the data after having deliberately replaced the Qs and qi,ns by the appropriate functional relationship on the Kis have failed to converge.
The fact that parameter CX,O/CX,tot, which appears in eqn (3) and is a measure of the initial degree of cell integrity of the carrot material, is in most cases essentially equal to unity suggests that most of the cell disruption occurs during submersion of the carrot slices in the brines and net during storage of the carrots following harvest. (It should be reminded that the amounts of sugar leached from the carrot to the brine are a direct measure of the degree of cell disruption at any stage because these molecules are large enough to be prevented from permeating the cell wall.)
Model& the transport of lactic acid 191 10.5 a I S.OL 1 0.0030 0.0032 0.0034 0.0036 lfl- 10.5 b 10.0 . -? 9.5 a CI” a 9.0 8.5 8.0 1 I 0.0030 0.0032 0.0034 0.0036 1fl 9 3 v d- -? c.
2
a C 10.0 . 9.5 - 8.5 . 8.0’ 0.0030 0.0032 0.0034 0.0036 VTFig. 7. Plot of the apparent diffusivity of salt (in logarithmic form), PD~~,*,~, vs the reciprocal absolute temperature of the brine, l/T, using (a) Model 0, (b) Model 1 and (c) Model 2 in eqn (2). The points are the estimates of the parameter in question obtained from non-linear regression fit to the data obtained at 5% (Q), 75% (o), 10% (n), 15% (0). and
192 R. M. Nabais, l! X. Malcata 0.6 . a la 0.4 . ; kc a 0.2 . d B A 8 i q 0.0 . -0.2 0.0030 0.0032 0.0034 0.0036 1R 0.7 - b 0.5 . 8 -0.2 1 I 0.0030 0.0032 0.0034 0.0036 l/T 0.7 9 0.5 “Z cl” 0.2 ;- a 0.0 -0.2 o.iiO3o 0.0032 0.0034 0.0036 l/T
Fig. 8. Plot of the partition coefficient for the salt (in logarithmic form), pK,, vs the reciprocal absolute temperature of the brine, l/T, using (a) Model 0, (b) Model 1 and (c) Model 2 in eqn (2). The points are the estimates of the parameter in question obtained from non-linear regression fit to the data obtained at 5% (m), 75% (o), 10% (o), 15% (o), and
Model&q the transport
qf
lactic acid lY3 18.0 -a 16.0 . 1 5 14.0 - P a” a ; t7 12.0 B 8 10.0 . A 8.0 - 0.0030 0.0032 0.0034 0.0036 l/r -b 16.0 2 14.0. 0.0030 0.0032 0.0034 0.0036 l/-T .C 4 16.0 . 8.0< 0.0030 0.0032 0.0034 0.0036 lflFig. 9. Plot of the apparent diffusivity of reducing sugars (in logarithmic form), PD~,,,,,~, vs the reciprocal absolute temperature of the brine, l/T, using (a) Model 0, (b) Model 1 and (c) Model 2 in eqn (3). The points are the estimates of the parameter in question obtained from non-linear regression fit to the data obtained at 0% (Q), 5% (o), 7.5% (r~), 10% (c). 15%
194 R. M. Nabais, E X. Malcata 0.0 a -1.5 . -2.0 0.0030 0.0032 0.0034 0.0036 0.0030 0.0032 0.0034 0.0036 l/T 0.0 C -0.5 . a q 0 I a q s -1.0 ' 5 q i a -1.5 . -8:80~0 0.0032 0.0034 0.0036 1n
Fig. 10. Plot of the ratio of the partition coefficient for the reducing sugars to the corresponding equilibrium concentration (in logarithmic form), p(K&,,), vs the reciprocal absolute temperature of the brine, l/T, using (a) Model 0, (b) Model 1 and (c) Model 2 in eqn (3). The points are the estimates of the parameter ratio in question obtained from non- linear regression fit to the data obtained at 0% (II), 5% (o), 7.5% (o), 10% (o), 15% (A), and
Modelling the transport of lactic acid 195 1.01 o.co30 0.0032 0.0034 0.0036 l/T b 7.0 . 6.0 . o.co30 0.0032 0.0034 0.0036 l/T 7.0 t C 6.0
Fig. 11. Plot of the product of the second-order rate constant by the total carrot cell concentration (in logarithmic form), p(k, .C,,,,), vs the reciprocal absolute temperature of the brine, l/T, using (a) Model 0, (b) Model 1 and (c) Model 2 (c) in eqn (3). The points are the estimates of the parameter ratio in question obtained from non-linear regression fit to the data obtained at 0% (m), 5% (o), 75% (o), 10% (Q), 1.5% (A), and 20% (A) (w/v) of salt
196 R. M. Nabais, E X. Malcata
In the absence of a rigorous theory for diffusion in liquids, rough (empirical) theories have been developed to provide order of magnitude calculations. One good example is Wilke’s theory (Bird et al., 1960) which suggests that the diffusivity of a solute in a liquid phase is directly proportional to T* p,/,u, for any given system. For large ranges of values for the mass density and the viscosity, it should then be expected that the diffusivity would be directly proportional to the mass density and inversely proportional to the viscosity for a given temperature. This means that pDap,f,i should increase with increasing pi and decrease with increasing pul. The first part of this statement is contradicted by our experimental values, whereas the second part agrees with them; hence, it was decided to postulate an empirical relationship which may have taken both trends into account (note that for limited ranges of values for the mass density and the viscosity, as is the present case, the variation of the quantities and the variation of their logarithms have approximately the same shape). On the other hand, Eying’s theory for the approximate behaviour
TABLE 2
Results of the Regression Analysis of the Fit of the Best Estimates of Parameters PD~,,~,= and pK, (Fitted Independently to the Experimental Data Set Obtained for the Transport of Acid at Each Given Temperature and Initial Concentration of Acid), pDap,f,s and pK, (Fitted Independently to the Experimental Data Set Obtained for the Transport of Salt at Each Given Temperature and Initial Concentration of Salt), and PD:+~, p(K,/C,,,,,) and p(k,Cx,t,t) (Fitted Independently to the Experimental Data Set Obtained for the Transport of Reducing Sugars at Each Given Temperature and Initial Concentration of Salt) to Models
0, 1, and 2
Species
transported Identification Units Model 0 Model 1 Model 2
Acid Salt m2/s 9.4307 K %(w/v) m2/s 0.0054598 K %(w/v) m2/s 8.9808 &w,v) m2/s 0.25892 K %(w/v) m2/s 12.875 K %(w/v) %(w/v) -0.89915 K % (w/v) m’/s 4.2458 K %(w/v) 5.6319 1153.9 -1.2337 376.42 3.8766 1550.5 -1.5913 562.02 -12.227 7625.4 -2.0107 337.66 -12.532 5096.4 5.7162 1153.9 - 0.072286 -1.2692 376.42 0.030465 4.28311 1550.5 -0.035352 -1.6136 562.02 0.0019457 -12.267 7625.4 0.0041078 -2.0227 337.66 0~0012511 -12.715 5096.4 0.019170
Modelling the transport qf lactic acid 197
TABLE 3
Extra residual sum of squares analyses involving Models 0 and 1, or Models 1 and 2, both for parameter pD,,.t,a
- --
Nested Source SSR” DF’ F ratio’
models
--
Extra parameters 0.3870 1 82.3404
O-I Model 1 0.0611 13 P<S%’
Model 0 0.448 1 14
Extra parameters 0.0305 1 1 1 .Y6OX
l-2 Model 2 0.0306 12 P<5%
Model 1 0.06 11 13
” SSR=sum of squares of residuals; h DF=number of degrees of freedom; MSS=SSR/DF; ’ F-ratio=(MSS associated with the extra parameters)/(MSS associated with the full model); P=probability that the given value of the F-ratio happens by pure chance. F(1,13;5%)=4+7: F(1,12; 5%)=4.75.
of a liquid predicts that p,=A, exp {AI/T) (Bird et al., 1960), where A, and A1 are constants for each system. Combination of these two relationships yields &,,f,j=BI.T.p,. exp {-&iT), where B, and B2 are constants for each system. Since for the range utilized the mass density and the absolute temperature were varied only slightly, then it is expected that an Arrhenius-type relationship should
hold for the dependence of the diffusivities on the temperature. This fact is well confirmed by the large values for the F ratio in Tables 3, 5 and 7 when going from Model 0 to Model 1. The empirical dependence postulated for the diffusivities on the initial concentration of solutes in the brine is much weaker, and so the improve- ment in the fit when going from Model 1 to Model 2 is much less (see corresponding F ratio in Table 3). The improvement in going from Model 1 to
TABLE 4
Extra residual sum of squares analyses involving Models 0 and 1, or Models 1 and 2, both for parameter pK,
-__
Nested Source SSR” DF” F ratio’
models Extra parameters 0.04118 1 17.2746 o- I Model 1 0.03099 13 P<.S% Model 0 0.07217 14 Extra parameters 0.00542 1 25436 1-2 Model 2 0.02557 12 p:.sq. Model 1 0.030’39 13
“SSR=sum of squares of residuals; hDF=number of degrees of freedom; MSS==SSR/DF; ‘F-ratio=(MSS associated with the extra parameters)/(MSS associated with the full model); P=probability that the given value of the F-ratio happens by pure chance. F(1.13;5%1)=4.67: F( 1,12;5%)=4.75.
198 R. M. Nabais, i! X. Malcata
TABLE 5
Extra residual sum of squares analyses involving Models 0 and 1, or Models 1 and 2, both for parameter p&~,~ Nested models Source SSR” DFb F ratio’ Extra parameters 1.1645 1 23.6792 o-1 Model 1 1.1311 23 P<5% Model 0 2.2956 24 Extra parameters 0.9061 1 885964 l-2 Model 2 0.2250 22 P<5% Model 1 1.1311 23
“SSR=sum of squares of residuals; bDF=number of degrees of freedom; MSS=SSR/DF; “F-ratio=(MSS associated with the extra parameters)/(MSS associated with the full model); P=probability that the given value of the F-ratio happens by pure chance. F(1,23;5%)=4.28; F(1,22;5%)=4.30.
Model 2 is not statistically significant for the case of transport of sugar from the carrot to the brine because in this case the species in the brine (salt) is not the species whose transport is under scrutiny (see F ratio in Table 7). The case pertain- ing to the transport of salt is quite different, probably because the range of concentrations studied is very high (which leads to major variations of the activity coefficient for salt in the electrolyte solution). The variation of the partition coeffi- cients with temperature follows van? Hoff law (Smith & van Ness, 1987) as can be concluded from inspection of the F ratios from going from Model 0 to Model 1 in Tables 4, 6 and 8. Further improvement in the reduction of the residual sum of squares is not relevant from a statistical point of view when a dependence on the solute concentration in the brine is postulated (see F ratios associated with going
TABLE 6
Extra residual sum of squares analyses involving Models 0 and 1, or Models 1 and 2, both for parameter pK, Nested models Source SSR” DFb F ratio’ o-1 l-2 Extra parameters 0.1530 1 Model 1 0.0521 23 Model 0 0.2051 24 Extra parameters 0.0027 1 Model 2 0.0494 22 Model 1 0.0521 23 67.5432 P<5% 1.2024 P>5%
“SSR=sum of squares of residuals; bDF=number of degrees of freedom; MSS=SSR/DF; ‘F-ratio=(MSS associated with the extra parameters)/(MSS associated with the full model); P=probability that the given value of the F-ratio happens by pure chance. F(1,23;5%)=4.28; F(1,22;5%)=4.30.
Modelling the transport of lactic acid 199
TABLE 7
Extra residual sum of squares analyses involving Models 0 and 1, or Models 1 and 2. both for parameter PD,,,,.,~
--
Nested Source SSR” DFh F ratio’
models
--
Extra parameters 33.7994 1 SO.3342
o-1 Model 1 1 &SO20 28 P<S%
Model 0 52.6014 29
Extra parameters 0,0215 1 (1~0309
l-2 Model 2 18.7805 27 F’>S%’
Model 1 18.8020 28
<‘SSR=sum of squares of residuals; hDF=number of degrees of freedom; MSS=SSR/DF; ‘F-ratio=(MSS associated with the extra parameters)/(MSS associated with the full model); P=probability that the given value of the F-ratio happens by pure chance. F(1,28;5%)=4~20: F(1,27;5%)=4.21.
from Model 1 to Model 2 in Tables 4, 6 and 8). The variation of k, (or, equivalently, of k,. Cx,,,, since CX,~~,, is assumed to take an approximately constant value) with temperature follows an Arrhenius-type relationship (see F ratio when going from Model 0 to Model 1 in Table 9); this situation was expected because k, is a rate constant.
In general, the diagnostic checks implemented through plotting the residuals (results not shown) led to the detection of: (i) no strong deviations from linearity in the normal plots (thus indicating a normal distribution of residuals); and (ii) no relevant trends for the residuals nor strong correlations with the dependent varia- bles (thus indicating constancy of variance). Therefore, the methodology utilized to
TABLE 8
Extra residual sum of squares analyses involving Models 0 and 1, or Models 1 and 2, both for pParameter p(K,IC,,, 1 ) Nested models Source SSR” DFh F ratio’ Extra parameters 0.0963 4.3511 O-l Model 1 0.6197 2: P<S%J Model 0 0.7160 29 Extra parameters 0.0020 0.0874 1-2 Model 2 0.6177 2: P>S% Model 1 0.6197 28
“SSR=sum of squares of residuals; bDF=number of degrees of freedom; MSS=SSR/DF; ‘F-ratio=(MSS associated with the extra parameters)/(MSS associated with the full model); p=probability that the given value of the F-ratio happens by pure chance. F(1,28;5%)=4.20: F(1,27;5%)=4.21.
200 R. M. Nabais, E X. Malcata
TABLE 9
Extra residual sum of squares analyses involving Models 0 and 1, or Models 1 and 2, both for parameterp(k,.Cx,,,,) Nested models Source SSR” DF’ F ratio’ Extra parameters 15.0980 109.8579 o-1 Model 1 3.8481 2; P<5% Model 0 18.9461 29 Extra parameters 0.4689 l-2 Model 2 3.3792 2: 3.7465 P>5% Model 1 3.8481 28
“SSR=sum of squares of residuals; bDF=number of degrees of freedom; MSS=SSR/DF; ‘F-ratio=(MSS associated with the extra parameters)/(MSS associated with the full model); P=probability that the given value of the F-ratio happens by pure chance. F(1,28;5%)=4.20; F(1,27;5%)=4.21.
minimize the sum of the squares of the residuals (as was done) provides maximum likelihood estimators for the parameters.
The activation energies associated with the apparent diffusivities, given by
R. a, -ln(lO), are 22.09, 29.68 and 14598 kJ/mol for the transport of acid, salt and reducing sugars, respectively, between the brine and the carrot. These values are well within the range expected for a physical phenomenon. By the same token, the enthalpies of the reaction of partition of the various species between brine and carrot material, given by R-p1 * ln(lO), are 7*21, 10.76 and 6.46 kJ/mol for acid, salt and reducing sugars, respectively. These values are once again acceptable, and suggest that the partitioning is a slightly endothermic process. Finally, the activation energy of the process of bursting of the carrot cells, given by R + y1 + ln(lO), is 9756 kJ/mol, again an acceptable value for an essentially physical process.
Inspection of Fig. 1 indicates that the reducing sugars tend to concentrate in the middle portion of the carrot slice (the core), an observation that agrees with the accepted fact that transport of salts in a plant occurs upwards through the internal layer of the core, whereas transport of sugars occurs downwards through the exter- nal layer of the core (Meyer et al., 1965). On the other hand, these sugars tend to increase in concentration for both the core and the cortex (i.e. the external portion of the carrot slices) from the top of the carrot towards the middle part, and then decrease towards the bottom of the carrot; this behaviour is probably owing to the fact that the vascular system is not well differentiated in the meristematic tissues of the root edge (Meyer et al., 1965; Richardson, 1975; Salisbury & Ross, 1978).
The fact that rupture of the cell membrane in the carrot tissue is required before the sugars can diffuse out to the brine is confirmed by the fact that the weight of immersed carrot slices increased by 7-10% (w/w); such increase may be a result of the osmotic intake of water that will eventually lead to the aforementioned release of free sugars which can then be transported by a diffusion mechanism.
Inspection of Table 2 indicates that increases in the concentration of acid and salt in the initial brine lead to increases of the apparent diffusivisities of acid and salt, respectively. This verification (coupled with the inspection of the order of magnitude
Modelling the transport of lactic acid 201
of parameters a2 in both cases) suggests a slight concentration dependence for the diffusivity, an observation which may indicate the importance of osmotic phenom- ena. The fact that the presence of solutes modifies the permeability of the membrane and wall of vegetable cells has been reported elsewhere (Salisbury & Ross, 1978). On the other hand, from Table 1 one concludes that the viscosity of the brine increases with either the acid or the salt concentrations. Although these observations seem to contradict the usual assumption that diffusivities in liquids decrease when the viscosity increases, they are in agreement with data reported by Pflug et al. (1967) and Liu (1992) encompassing similar systems.
It may be argued that the diffusivity of the carrot material is a function of the temperature and concentration of the species at every location within the carrot boundaries, and not a function of the measured total concentration of acid or salt in the brine or the temperature thereof. However, it should be realized that one of the major features of the analysis presented here was the development of an analytical solution for the material balance underlying the molecular transport of acid and salt into the carrots, and of reducing sugars out of the carrots; such analytical solution would not have been possible if two or three material balances had to be combined with one another and/or with an energy balance. In addition, even if isothermal conditions were assumed throughout the carrot material, any statistically significant correlation of D ap.f,i(Xlt) with C&t) ( w h ere i=a,s,r) would have required data on the concentration profiles of each such species at various times and locations within the carrot; such sampling would destroy the integrity of the carrot slices because it would require cutting of the carrot slices and smashing of them prior to analysis
rocedures that are very prone to experimental error) so the increase in accuracy then going from D. ap,f.i=Dap.t.,i (Ci.0) to Dpp,f,i=Dap,f,i(Ci(Xtt)) would very likely bc lost by the increase in experimental variability. On the other hand, the concentration of salt and acid in the brine are easily measured, and for practical purposes it is much more useful to have correlations available for the approximate prediction of the values of parameters Dap,f,i or k; C,,,,, based on direct operating variables rather than based on variables which are not easily accessible experimentally, and which would require involved numerical integration techniques for their theoretical computation.
For practical purposes, it may be stated that the variation of PD~~,~,:,, pDZ,p,l.,s and pDap,f,r with operational parameters is well approximated by Model 2, Model 2 and Model 1, respectively; whereas pK,,, pK,, p(K,IC,,, , ) and ~(k;c~,~,,,) are all well approximated by Model 1.
REFERENCES
Beristain, C. I., Azuara, E., Cortez, R. & Garcia, H. S. (1990). Mass transfer during osmotic dehydration of pineapple rings rings. Int. J. Food Sci. Technol. 25, 576.
Bird, R. B., Stewart, W. E. & Lightfoot, E. N. (1960). Transport Phenomena. Wiley. New York, pp. 29, 515.
Biswall, R. N. & Maguer, M. (1989). Mass transfer in plant materials in contact with aqueous solutions of ethanol and sodium chloride: equilibrium data. J. Food Process. Engng, 11, 159. Jowitt, R., Escher, F., Kent, M., McKenna, B. & Roques, M. (eds.) (1982). Physical Properties
of Foods-2. Elsevier, New York.
Kincan, N. S. & Kaymak, F. (1987). Modelling of dry matter losses from carrots during blanching. J. Food Proc. Engng, 9, 201.
202 R. M. Nabais, E X. Malcata
Liu, H. (1992). A kinetic study of salt diffusion in potato at high temperature. J. Food Sci. Technol., 27, 443.
Moreira, L. A., Oliveira, R. A. R. & Silva, T. R. (1992). Prediction of pH change in processed acidified turnips. Int. J. Food Sci. Technol., 57, 928.
Meyer, B. S., Anderson, D. B. & Bohning, R. (1965). Zntrodu@o b Fisiologia Vkgetal. Fundacao Calouste Gulbenkian, Lisbon.
Nabais, R. M., Vieira, M. C. & Malcata, F. X. (1996). Modelling the transport of lactic acid, sodium chloride, and reducing sugars in carrot slices submerged in brines - Part I. Univariate approach. J. Food Engng, 28 (2), 153-78.
Oliveira, F. A. (1988). Mass transfer analysis for the leaching of water soluble components from food. Ph.D. thesis, Department of Food Science, University of Leeds, UK.
Oliveira, F. A. R. & Silva, C. L. M. (1992). Freezing influences diffusion of reducing sugars in carrot cortex. Int. J. Food Sci. Technol., 57, 932.
Pflug, I. J., Fellers, P. J. & Gurevitz, D. (1967). Diffusion rates in the desalting of pickles. Food Technol., 21, 1634.
Potts, E. A., Fleming, H. P., McFeeters, R. F. & Guinnup, D. E. (1986). Equilibration of solutes in nonfermenting, brined pickling cucumbers. J. Food Sci., 51, 434.
Richardson, M. (1975). Translocation in Plants, Edward Arnold, London.
Salisbury, F. & Ross, C. (1978). Plant Physiology. Wadsworth Publishers, Belmont, California. Schwartzberg, H. B. (1975). Mathematical analysis of solubilization kinetics and diffusion in
foods. J. Food Sci., 40, 211.
Smith, J. M. & van Ness, H. C. (1987). Introduction to Chemical Engineering Thermodynamics. McGraw-Hill! New York.
Soddu, A. & Gioia, F. (1979). Diffusion through living systems: sugar loss from sugar beets. Chem. Engng Sci., 34, 763.