Effect of Radial Transport on the LH Current Drive Efficiency
in Tokamaks Featuring an Internal Transport Barrier
L. F. Ziebell
1, C. I. de Oliveira
1, and P. R. da S. Rosa
2 1Instituto de F´ısica, UFRGS, Caixa Postal 15051, 91501-970, Porto Alegre, RS, Brasil 2
Departamento de F´ısica, UFMS, Caixa Postal 549, 79070-900, Campo Grande, MS, Brazil
Received on 26 January, 2004; revised version received on 1 May, 2004
In the present paper we study the effects of occurrence of radial transport of particles in a tokamak, and the effects of the presence of an Internal Transport Barrier (ITB), on the current drive efficiency and power deposi-tion profiles in the case of lower hybrid waves generating an extended tail in the electron distribudeposi-tion funcdeposi-tion. The results are obtained by numerical solution of the Fokker-Planck equation which rules the evolution of the electron distribution function. We assume that the radial transport of particles is due to magnetic or electrostatic fluctuations, and introduce a model to describe the ITB, with adjustable parameters. The presence of an Edge Transport Barrier (ETB) is simulated by Neumann boundary conditions at the plasma edge. The results obtai-ned show very different behavior for current drive whether we have electrostatic or magnetic transport origin. The change in the plasma current due to magnetic transport has been observed to be more significant than the change due to electrostatic transport, basically because the magnetic transport is more effective in diffusing high-velocity particles of the electron tail.
1
Introduction
The injection of rf waves in tokamaks with the objective of current generation has been proposed and studied as an ef-fective way to extend the duration of the tokamak discharge. Lower hybrid (LH) waves play prominent role in the stu-dies related to current generation, either together with other current drive (CD) schemes, or individually. LH waves re-sonate with electrons via Landau damping, transferring pa-rallel momentum to the electrons, papa-rallel referring to the toroidal magnetic field.
On the other hand, the discovery of an enhanced con-finement regime in tokamaks has revealed the existence of Transport Barriers (TB) at the plasma edge (ETB), characte-rized by steep gradients in electron temperature and density profiles in this region. More recently it has been shown for several tokamaks the presence of Internal Transport Barri-ers (ITB’s) in revBarri-ersed shear configurations. These ITB’s are characterized by a localized and significant reduction of the transport coefficients for heat, particle and momentum. These ITB’s appear in plasmas heated by several kinds of heating schemes: ohmic, lower hybrid, ion cyclotron, elec-tron cycloelec-tron, and neutral beam injection. For example, the L-H transition using LH current drive with two different fre-quencies has been observed by the authors of Ref. [1]. The general mechanism of the formation of ITB’s is not well un-derstood but there are evidences that the main mechanism acting to form these barriers in such configurations is the existence of a radial electric field caused by the different res-ponses of electrons and ions to the instability, proportional to the mass ratio between electrons and ions (me/mi). In
the presence of this electric field theE×Bmechanism acts in order to diminish the turbulence in the magnetic surface, therefore lowering the transport between neighborhood sur-faces. As a consequence of the formation of the barrier there is accumulation of particles and energy in the region internal to the barrier, with the corresponding increase in the energy confinement time.
In this paper we intend to discuss the effect of different mechanisms causing radial transport, along with the pre-sence of both ITB and ETB, on the LH power absorption and current drive as well on the Electron Cyclotron Emis-sion (ECE). These calculations are made in the frame of the quasilinear theory by solving the Fokker-Planck equation in slab geometry, taking into account corrections both to the density and temperature profiles.
The paper is organized as follows. Section 2 discusses the equations which are employed and the approximations made. Section 3 shows the results found by numerical solu-tion of the Fokker-Planck equasolu-tion, as a funcsolu-tion of several parameters. Due to the complexity of the problem, the nu-merical investigation is concentrated on the effect of three major variables among the several parameters which have to be assumed, namely the depth of the barrier and the level of magnetic or electrostatic turbulence.
2
The Fokker-Planck equation and
the numerical scheme
the-ory. If we take into account collisions, LH waves and parti-cle transport the Fokker-Planck equation is written symboli-cally as follows
∂τf = (∂τf)lh+ (∂τf)col+ (∂τf)t (1)
where the subscripts in the right-hand side denote, from the left to the right, the effect of LH waves, collisions and par-ticle transport. f =f(u, µ, s, τ)is the electron distribution function,τis the time normalized to the collision time at the center of the slab,uis the electron momentum normalized to the central thermal momentum atτ= 0,µ= cosθis the cosine of the pitch angleθands= x/ais the normalized radial coordinate in the direction perpendicular to the ambi-ent magnetic fieldB0, supposed along thezcoordinate. The
term related to LH waves may be given as follows, (∂τf)lh=∂u||
¡
Dlh∂u||f
¢
(2) whereDlhis the diffusion coefficient in momentum space.
We consider LH waves continuously injected in the plasma, with fixed powerPLH(a)at the edge of the slab. As the
wa-ves progress inside the slab, the power dissipation is taken into account. The propagation of the waves is constrained as described in the paper by Dumont et al ([2]), and can be described as follows.
i) The radial component of the wave vector (kr) must be
positive. Using an electrostatic approximation, this means the following,Nk−< Nk< Nk+, where
N||±=N||0 "
1∓ r
R0q ×
µǫ
|| ǫ⊥
¶1/2#−1
,
with ǫk ∼= 1− (ωpe/ω)2 − (ωpi/ω)2 and ǫ⊥ ∼= 1 +
(ωpe/ωce)2 −(ωpi/ω)2; ωpe,pi is the plasma angular
fre-quency for electrons (ions), ωce,ci is the cyclotron angular
frequency for electrons (ions), and ω is the wave angular frequency;
ii) The accessibility condition, defined by the coupling point between the fast and slow modes,
Nk> Nkac=
ωpe ωce + " 1 + µω pe ωce ¶2 −³ωpi
ω
´2#1/2 ; (3)
iii) An upper limit inNkdue to Landau damping,
approxi-mately given by
Nk< NkL=nL/
p
Te. (4)
wherenL is around6−7[2]. Several back and forth trips
may occur before complete absorption of the waves due to Landau damping, except for very high values of electron temperature and/or of the parallel refraction index at the plasma edgeNk0(Te2Nk0>50, Tein keV).
These conditions define the range inNkwhich is
availa-ble to LH waves, at each positions. The limits of this range will be denoted by N2 andN1. Due to the Landau reso-nance condition, there is a corresponding range of parallel
velocities where the particles are in resonance with the wa-ves. We assume a Gaussian wave spectrum in the propaga-tion domain, given byS(s, τ, Nk)=S0exp
µ
−³N||−N
∆N||
´2
whereS0is the intensity of LH waves at positionsat time
τ. This quantity can be obtained considering that, due to the fast movement of the electrons on the magnetic surface, the energy acquired by the electrons when passing through the region affected by the wave is rapidly spread to all the mag-netic surface, and the average LH intensity at each magmag-netic surface can be given byPLH(s, τ)/(4π2rR).
The LH diffusion coefficient is proportional to
S(s, τ, Nk). It can be found in previous works and will not
be repeated here [3]. It depends on the perpendicular com-ponent of the refraction indexN⊥, which is obtained from
the dispersion relation, for each value ofωandNk.
The effect of collisions is introduced by the second term in the right-hand side of equation (1). We have used a line-arized form which describes the interaction of fast electrons with body electrons and ions, for each slab position.
The last term in the right-hand side of equation (1) des-cribes the transport of particles and has the following gene-ral form
(∂τf)t=∂s(D ∂sf), (5)
Dbeing the particle diffusion coefficient, which can be gi-ven as follows [4, 5, 6],
D=Dm+De= 2πqR0c
γµ1e0/2νe0 µ
|uk|eb2+ γ2µ
e0
c2|u
k|e e2
¶ (6) whereDmis the contribution to transport due to magnetic
fluctuations, andDe is the contribution to transport when
electrostatic fluctuations are present. In this expression eb≡(B/B0)andee≡(E/B0)give, respectively, the magne-tic and electrostamagne-tic level of turbulence.eb0is dimensionless, while the units ofee0are m/s.νe0is the collision frequency at the plasma center, andγis the relativistic factor. The quan-tityqis the safety factor, assumed to be constant along the time evolution. This hypothesis is justified since the evolu-tion occurs in the kinetic time scale, while experimental data show that the changes in theqprofile occurs in a longer time scale, of order of seconds [7, 8].
The ETB is simulated by imposing Neumann boundary conditions on the electron distribution function at plasma edge, i. e. zero particle flux outward [9], while the ITB is si-mulated by assuming that the level of magnetic (or electros-tatic) turbulence is uniformly equal toeb0(oree0) everywhere except in the barrier region, where it is reduced down to a minimum valueαeb0 (or αee0). In all calculations which follow, we assume barriers centered at xp = a/2, with
half-widthβ = 3 cm. Specifically, we assume a parabo-lic reduction of the magnetic turbulence level at the bar-rier position (for xp −β < x < xp + β), such that
eb=eb0 ¡
a1+a2x+a3x2 ¢
andee=ee0 ¡
a1+a2x+a3x2 ¢
, where theaiare constants [10].
As boundary conditions of the barrier region we assume eb,ee=eb0,ee0atx=xp±β,eb,ee=αeb0, αee0, atx=xp. The
0.3 <|x/a| <0.5. It is important to remark that the inte-raction region for LH waves is inside the region having as boundary the plasma center and the barrier position. Fig. 1a of Ref. [10] shows the profile of magnetic and electrostatic turbulence, for several values ofα, andβ = 3cm. The bar-rier width and position are in accordance with experimental results [11].
Theqprofile appearing in Eq. (6) for the transport diffu-sion coefficient is simulated by a parabolic profile which has its minimum value at the positionx=a/2where the barrier is located (see Fig. 1b of Ref. [10]). This profile intends to simulate the reversedqprofiles typically found in situations where there is ITB formation. For all simulations appearing in the present paper theqprofile is the same.
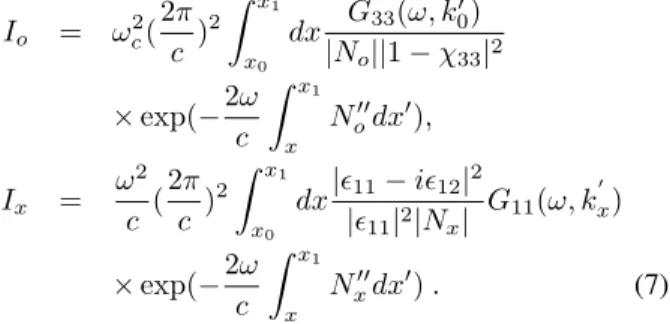
The EC radiation emitted perpendicularly to the magne-tic field, at the plasma edge, may be given by the following expressions
Io = ω2c(
2π c )
2 Z x1
x0
dx G33(ω, k ′
0) |No||1−χ33|2
×exp(−2ω
c
Z x1
x
No′′dx′),
Ix =
ω2
c (
2π c )
2 Z x1
x0
dx|ǫ11−iǫ12|
2
|ǫ11|2|Nx|
G11(ω, k′x)
×exp(−2ω
c
Z x1
x
N′′
xdx′). (7)
G11andG33 are the components of the locally homogene-ous current correlation tensor [12].
3
Numerical results
We solve numerically the quasilinear equation, Eq. (1), using the ADI method (implicit in alternated directions, [13]), and obtain the time evolution of the electron distri-bution function. Eq. (1) depends onu(0 ≤ u ≤ 12),µ
(−1 ≤µ ≤1)ands(−1 ≤s≤1), and we represent the (u, µ, s)space by a grid with151×51×101points.
For the magnetic field, initial density and temperature profiles we make use of the following expressions
B0(s) = B0(0)³1 +sa R
´−1 ;
ne(s, τ = 0) = (ne0−nea)(1−s2) +nea;
Te(s, τ = 0) = (Te0−Tea)¡1−s2¢
2 +Tea.
In these expressions the indexes0andaindicate, respec-tively, values taken at the plasma center and plasma edge. At each collision time the density and temperature are updated, directly from the electron distribution function.
As stated before, we assume Neumann boundary condi-tions at plasma edge, which imply that the total number of particles at the beginning,N0, is kept constant along the cal-culations. This can be easily seen by integrating the transport term of the kinetic equation:
dN dt = Z 1 −1 ds · ∂f ∂t ¸ = Z 1 −1 ds · ∂ ∂sD(s)
∂f ∂s
¸ = 0
Imposing Neumann boundary conditions, ∂f∂x = 0 at the plasma edge, we guarantee that the number of particles (N(τ)) is constant along time evolution.
For the numerical analysis, we assume the following parameters: ne0 = 6.0 ×10¹⁹ m−3, Te0 = 3.0 keV,
B0(0) = 2.65T,a= 0.2m,R= 1.0m. For the LH waves, we considerPLH(a, t) = 0.5MW, and chooseN¯k0 = 2.3 andfLH = 3.37×10⁹Hz, parameters which guarantee total
power absorption and which are in the range of parameters used in experiments.
For these parameters, the values ofN1andN2, which define the range of parallel refraction indexes covered by the LH spectrum, appear in Fig. (1), as a function of posi-tion inside the slab.
Figure 1. N|| accessibility conditions. N||L (full line), N||+
(dashed line), N||− (dotted line), N||ac (dashed dotted line),
N||min(dashed dotted dotted line) andN||max(short dashed line).
Obs.: the curves forN||minandN||acare in part superposed.
Figure 2 shows the profile of the density of absorbed LH power, as a function of electrostatic perturbation le-vel (panel a) and magnetic perturbation level (panel b), up to τ = 50. The density of absorbed power is ob-tained as follows (in W cm−3) from ρlh(r, τ) = 1.5 ×
10−16T
e0νe0R d3uu
2
2 (∂τfe)lh, where the symbol (...)lh
the absorption of LH waves at more external regions is fa-voured. However, if we compare the barrier case with the no barrier case (panelb of Fig. 2) the effect of the presence of the barrier appears as a reduction in the LH power absorbed levels outside the barrier region while the values inside the barrier region are greater for the barrier case than for the no barrier case.
Figure 2. ρlh: a)eb = 0andee: 0 (solid line),1×102 (dashed
line),5×102(dotted line),7.5×102(dashed dotted line),1×103 (dashed dotted dotted line) and without barrier (short dashed line); b)ee= 0andeb: 0 (solid line),5×10−5(dashed line),1×10−4 (dotted line),2.5×10−4(dashed dotted line),5×10−4(dashed dotted dotted line) and without barrier (short dashed line). Other parameters are:α= 0.125, sb= 0.5,Plh(a) = 0.5MW.
Figure 3. Current density profile: a)eb= 0andee=: 0 (solid line),
1×10²(dashed line), 5×10² (dotted line),7.5×102 (dashed dotted line),1×103 (dashed dotted dotted line) and without bar-rier (short dashed line); b)ee= 0andeb=: 0 (solid line),5×10−5 (dashed line ),1×10−4(dotted line),2.5×10−4(dashed dotted line),5×10−4(dashed dotted dotted line). Other parameters are:
α = 0.125, sb = 0.5,Plh(a) = 0.5MW. Also shown the case
α= 1(short dashed line). Other parameters and conventions as in Fig. 2.
The corresponding profile of the current density is shown in Fig. 3. The effects on the current density profile follow the ones in LH power deposition profile. Again the magnetic case is shown to be more sensible to the pertur-bation level. Comparison between the two panels of Fig. 3 shows the spreading of the current profile due to the trans-port. However this spread is different for different types of transport. For the electrostatic case the spread due to trans-port is noticeable only between the plasma edge and the bar-rier position while for the magnetic transport it occurs both toward the edge and toward the center of the slab, with gre-ater diffusion toward the plasma edge.
The effect of the turbulence level on the current genera-tion is shown in Fig. 4, which displays the time evolugenera-tion of
Ias a function of the perturbation level. In both electrosta-tic and magneelectrosta-tic transport cases we observe an increase on the values of current driven. However, this enhancement of current is much more pronounced in the magnetic case than in the electrostatic case. Again, the explanation is found in the diffusion of high speed particles toward the plasma edge, more pronounced in the case of magnetic transport. This im-plies that we have more energetic particles in positions be-fore the barrier region and, as LH waves interacts with parti-cles with high parallel momentum content, more LH power is deposited in more external positions. Combined with this we have a lower density region before the barrier region. In this way collisions are less efficient to destroy the created current density. As result of the synergy between these pro-cesses the current density in regions near the plasma edge increases and so the current. It’s interesting to observe from the panel (b) of Fig. 4 the effect of the barrier as compared with the no barrier case foreb= 5×10⁻⁴.
As remarked be-fore, due to the LH power deposition profile behavior, the barrier case shows greater values for the current driven as compared with the case without barrier.
Figure 4. Evolution of the current in time: a)eb= 0andee=: 0 (so-lid line),1×102 (dashed line),5×102(dotted line),7.5×102 (dashed dotted line), 1× 10³ (dashed dotted dotted line) and without barrier (short dashed line); b)ee = 0andeb =: 0 (solid line),5×10−5(dashed line ),1×10−4(dotted line),2.5×10−4 (dashed dotted dotted line),5×10−4(dashed dotted line) . Other parameters are: α= 0.125, sb = 0.5,Plh(a) = 0.5MW. Also
Similar analysis can be made for the EC emission. Fig. 5 displays the intensity of second harmonic EC emis-sion at x = a as a function of the perturbation level, for the X mode and perpendicular propagation, at the end of the time evolution, for the same values ofα,β andsbused
in Fig. 2. The figure also shows the emission due to the Maxwellian distribution, prior to the LH injection. The first thing to observe is the enhancement of the spectral intensity for low frequency values which happens both for the elec-trostatic and magnetic cases. This enhancement is a direct consequence of the relativistic mass variation of the elec-trons which permits the elecelec-trons to emit at a lower fre-quency than local EC frefre-quency. As the LH waves push electrons from low momentum to high momentum in mo-mentum space, the emission due to these electrons moves toward smaller frequencies, therefore producing increase of the spectral intensity in the low frequency part of the spec-trum.
Figure 5. Espectral intensity: a)eb= 0andee =:0 (dashed line),
1×10²(dotted line),5×102(dashed-dotted line),1×103 (dashed-dotted-dotted line); b)ee= 0andeb=: 0 (dashed line ),5×10−5 (dotted line),1×10−4 (dashed-dotted line),5×10−4 (dashed-dotted-dotted line) . Other parameters are: α= 0.125, sb = 0.5,
Plh(a) = 0.5MW. Also shown the Maxwellian distribution
func-tion case (solid line in both panels).
An example of such enhancement may be appreciated in Fig. 6, where the EC emission coefficient (βx) for one of
the frequencies in the low part of the spectrum (f = 125.3 GHz) is shown as a function of radial position, at steady state. This frequency corresponds to the second harmonic of the cyclotron frequency near the plasma edge. The emis-sion coefficient appearing in the figure is totally due to the electron tail, since the contribution due to the Maxwellian distribution function at this frequency nearly coincides with the horizontal axis and can not be seen in the scale of the figure. For this frequency the peak in the emission does not occur in the position where this frequency corresponds to the second harmonic, but in the region where the LH waves depose their energy. It is seen from the figure that there are significant differences in the emission profile depending on the type of transport, with the peak in the electrostatic case
higher than the peak for magnetic case, almost with the same value of the peak without transport. We attribute this diffe-rence to the higher efficiency demonstrated by the magnetic transport to radially diffuse the particles away from the re-gion of creation of the electron tail by the LH waves, which coincides with the region of the transport barrier. In both cases the emitting region is wider than in the case without transport. This points to lower precision in temperature me-asures obtained from ECE in such plasmas.
Figure 6. Electron cyclotron emission coefficient for the frequency 125.3 GHz. Maxwellian distribution function (solid line, coincides with the horizontal axis and is not visible in the scale of the figure) and at steady state: Without transport (dashed line), with magne-tic transport only (dotted line) and with electrostamagne-tic transport only (dahed-dotted line).
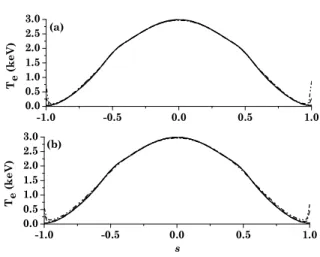
Figure 7. Plasma temperature profile at steady state: a)eb= 0and
e
e =: 0 (solid line),1×102(dashed line),5×102(dotted line),
7.5×10²(dashed dotted line),1×103(dashed dotted dotted line); b)ee= 0andeb=: 0 (solid line),5×10−5(dashed line ),1×10−4 (dotted line),2.5×10−4 (dashed dotted line),5×10−4 (dashed dotted dotted line) . Other parameters are:α= 0.125, sb = 0.5,
Figure 7 displays the temperature profile as a function of the perturbation level. It’s noticeable the modification in the plasma temperature profile in the region arounds= 0.5, due to the presence of the high energy tail created by LH waves.
The influence of the barrier depth on the current drive is shown in Fig. 8. The current drive in the electrostatic case is not sensible to the barrier depth as can be seen from the panel a of the figure. However, the current driven in the magnetic case has been shown to be very sensitive to the barrier depth.
Figure 8. Dependence of the current driven on the barrier depth. a)ee= 1×10³ andeb = 0; b)eb = 5×10⁻⁴ andee = 0. No transport (solid line), α : 0.125(dashed line), 0.5(dotted line), and1.(dashed dotted line). Other parameters and conventions as in Fig. 2.
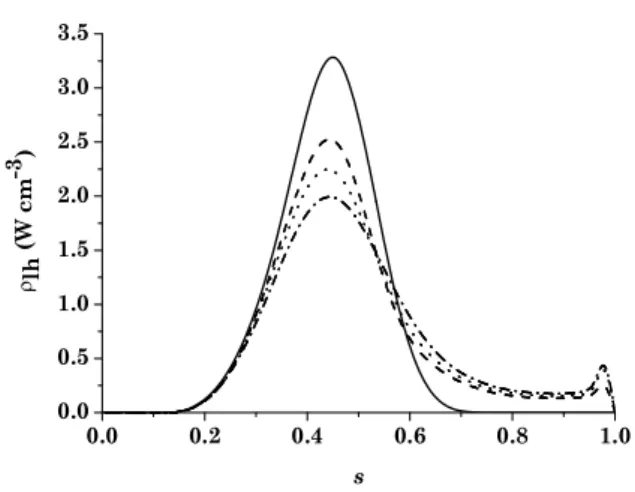
Figure 9. Asymptotic profile of the LH power deposition (ρlh) for
several values of the barrier depth, in the case of transport due to magnetic fluctuations (eb= 5 x 10⁻⁴): α= 0.125 (dashed line),α
= 0.5 (dotted line), and α= 1.0 (dashed-dotted line). The case without transport is also shown, as a solid line. Other parameters and conventions as in Fig. 2.
The reason is the effectiveness of the barrier to constrain the particles inside the barrier region, in this way enhancing the LH power deposition profile as can be seen in the Fig. 9. This is in apparent contradiction with the explanation above about the reason of the increment in the plasma current due to the diffusion of energetic electrons. To understand this behavior we invoke the following argument: the particles inside the barrier region receives energy from the waves un-til the magnetic diffusion becomes effective and then diffuse toward the plasma edge. As the barrier is stronger (lowerα
value) the electrons remain more time in interaction with the waves before diffusing. The diffused electrons are therefore more energetic and the value of the current increases.
4
Conclusions
In this work we have investigated how the occurrence of radial transport and the presence of an Internal Transport Barrier affect the current drive efficiency of LH waves. We have considered two possible mechanisms for radial trans-port, either due to magnetic fluctuations or due to electrosta-tic fluctuations, and studied the influence of the depth of the transport barrier and of the level of magnetic or electrostatic perturbation. For a given type of transport and a given set of parameters describing the barrier, our results have shown increase of the current drive efficiency when the turbulence level is increased, which is explained by considering that the transport diffuses high-velocity particles toward more exter-nal regions of the slab, where they are less collisioexter-nal and contribute more effectively to the current. The increase in the current drive efficiency in the case of transport due to magnetic turbulence has been observed to be more signifi-cant than the increase in the case of transport due to elec-trostatic turbulence. The reason is that magnetic transport is more effective on electrons at the tail of the distribution function, which give the most significant contribution to the current.
Grande do Sul (FAPERGS).
References
[1] S. Tsujiet al., Phys. Rev. Lett.64, 1023 (1990).
[2] R. Dumont, G. Giruzzi, and E. Barbato, Phys. Plasmas7, 4972 (2000).
[3] P. R. S. Rosa and L. F. Ziebell, Plasma Phys. Contr. Fusion 41, 525 (1999).
[4] G. Giruzzi, I. Fidone, and X. Garbet, Nuclear Fusion32, 1011 (1992).
[5] G. Giruzzi, Plasma Phys. Contr. Fusion35, A123 (1993). [6] G. Giruzzi et al., Plasma Phys. Contr. Fusion 38, 1593
(1996).
[7] X. Litaudon et al., Plasma Phys. Contr. Fusion 43, 677 (2001).
[8] C. D. Chalis et al., Plasma Phys. Contr. Fusion 43, 861 (2001).
[9] S. J. Wukitchet al., Physics of Plasmas9, 2149 (2002).
[10] P. R. S. Rosa and L. F. Ziebell, Plasma Phys. Contr. Fusion 44, 2065 (2002).
[11] G. M. Staebler, Plasma Phys. Contr. Fusion40, 569 (1998).
[12] L. F. Ziebell and D. Dillenburg, Phys. Fluids26, 80 (1983).